사전 준비물
django + apache (2대)
노드 설정
cat > /etc/yum.repos.d/prometheus.repo <<'EOF'
[prometheus]
name=prometheus
baseurl=https://packagecloud.io/prometheus-rpm/release/el/$releasever/$basearch
repo_gpgcheck=1
enabled=1
gpgkey=https://packagecloud.io/prometheus-rpm/release/gpgkey
       https://raw.githubusercontent.com/lest/prometheus-rpm/master/RPM-GPG-KEY-prometheus-rpm
gpgcheck=1
metadata_expire=300
EOF - 위의 명령어로 프로메테우스 기본 설정 파일 생성 및 수정
dnf -y install node_exportersettings.py
- 자신의 장고 프로젝트의 설정 파일로 들어가기
INSTALLED_APPS = [
		   ...
		   'django_prometheus',
		]

MIDDLEWARE = [
		  'django_prometheus.middleware.PrometheusBeforeMiddleware',
		    # All your other middlewares go here, including the default
		    # middlewares like SessionMiddleware, CommonMiddleware,
		    # CsrfViewmiddleware, SecurityMiddleware, etc.
		  'django_prometheus.middleware.PrometheusAfterMiddleware',
]

DATABASES = {
		  'default': {
		      'ENGINE': 'django_prometheus.db.backends.mysql',
			...
		  },
}- 위의 코드대로 수정
urls.py
- 가장 루트 폴더의 urls.py를 바꿔야 한다.
urlpatterns = [
	...
	path('monitor/', include('django_prometheus.urls')),
]- 추가해준다.
방화벽 해제
- setenforce 0
- systemctl stop firewalld
실행
systemctl restart httpd
systemctl restart node_exporter
MySQL (1대)
노드 설정
cat > /etc/yum.repos.d/prometheus.repo <<'EOF'
[prometheus]
name=prometheus
baseurl=https://packagecloud.io/prometheus-rpm/release/el/$releasever/$basearch
repo_gpgcheck=1
enabled=1
gpgkey=https://packagecloud.io/prometheus-rpm/release/gpgkey
       https://raw.githubusercontent.com/lest/prometheus-rpm/master/RPM-GPG-KEY-prometheus-rpm
gpgcheck=1
metadata_expire=300
EOF - 위의 명령어로 프로메테우스 기본 설정 파일 생성 및 수정
dnf -y install node_exporter방화벽 해제
- setenforce 0
- systemctl stop firewalld
실행
systemctl restart mysqld
systemctl restart node_exporter
haproxy (1대)
설치 방법
-
다른 vm에 haproxy 설치
- yum install haproxy
-
setenforce 0 (로컬 방화벽 중단)
-
systemctl stop firewalld (방화벽 중단)
-
설정
-
vi /etc/haproxy/haproxy.cfg
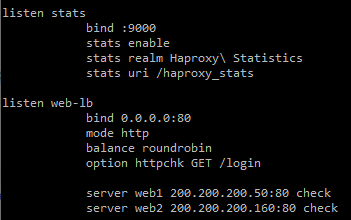
-
가장 아랫줄에 위의 그림처럼 작성해주자.
-
분산 처리해주는 알고리즘 RR 알고리즘을 사용했는데 운영체제때 다루었던 알고리즘이기에 넘어가겠다.
-
option mysql-check user 뒤에 비밀번호를 제거한 mysql 사용자 명인 remote를 써주자(만약 remote가 아니라면 본인이 설정한 이름)
-
그 밑에 server (django 서버명) (그 서버의 ip):80 check
-
-
systemctl restart haproxy 로 haproxy 서비스 재시작.
-
현재 haproxy를 설치한 vm의 ip주소:9000/haproxy_stats로 접속해보자.
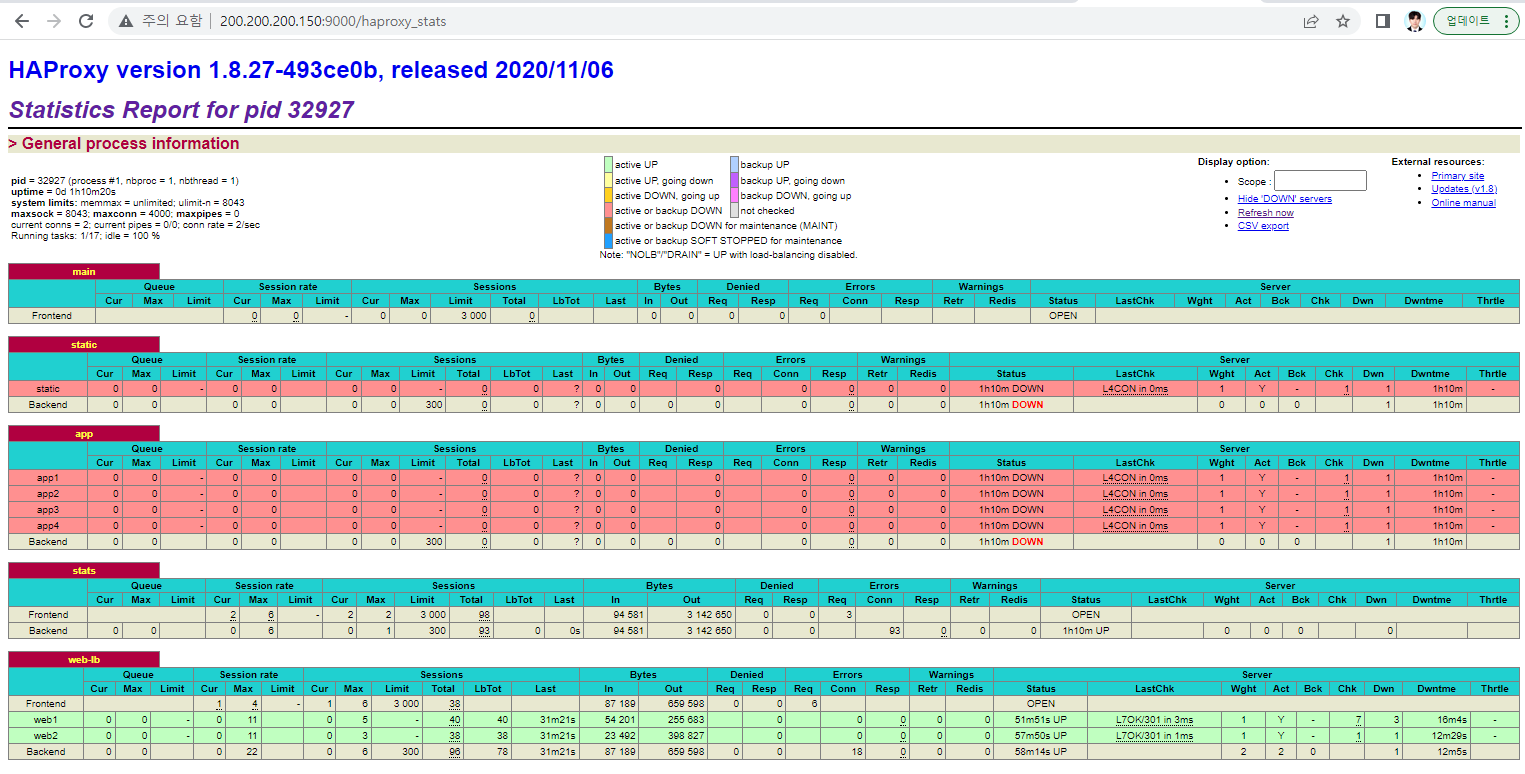
- 위의 페이지가 뜬다.
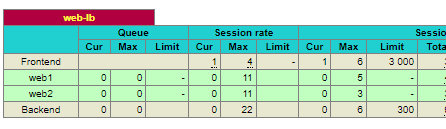
- 우리는 두개의 django 서버로 분산 처리를 하기 때문에 2개가 떠있는 것을 볼 수있다.
노드 설정
cat > /etc/yum.repos.d/prometheus.repo <<'EOF'
[prometheus]
name=prometheus
baseurl=https://packagecloud.io/prometheus-rpm/release/el/$releasever/$basearch
repo_gpgcheck=1
enabled=1
gpgkey=https://packagecloud.io/prometheus-rpm/release/gpgkey
       https://raw.githubusercontent.com/lest/prometheus-rpm/master/RPM-GPG-KEY-prometheus-rpm
gpgcheck=1
metadata_expire=300
EOF - 위의 명령어로 프로메테우스 기본 설정 파일 생성 및 수정
dnf -y install node_exporter방화벽 해제
- setenforce 0
- systemctl stop firewalld
실행
systemctl restart haproxy
systemctl restart node_exporter
프로메테우스
ip 매핑
- vi /etc/hosts
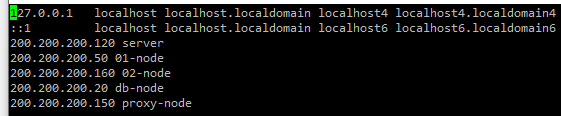
- 가장 위의 ::1까지는 그대로 놔두기
- 그 밑에는 자신부터 위에서 설정한 haproxy, django X 2, db 까지 총 4개를 ip 매핑해준다.
- 잘 매핑되었는지 확인하려면 ping [자신이 네이밍 한 이름] 으로 확인하면 된다.
설정
레포지토리 추가
cat > /etc/yum.repos.d/prometheus.repo <<'EOF'
[prometheus]
name=prometheus
baseurl=https://packagecloud.io/prometheus-rpm/release/el/$releasever/$basearch
repo_gpgcheck=1
enabled=1
gpgkey=https://packagecloud.io/prometheus-rpm/release/gpgkey
       https://raw.githubusercontent.com/lest/prometheus-rpm/master/RPM-GPG-KEY-prometheus-rpm
gpgcheck=1
metadata_expire=300
EOF
설치 파일
- dnf -y install prometheus2
설정 파일 수정
- vi /etc/prometheus/prometheus.yml
	  - job_name: node
	    static_configs:
	      - targets: ['[네이밍한 이름]:9100', '[네이밍한 이름]:9100', '[네이밍한 이름]:9100', '[네이밍한 이름]:9100', '[네이밍한 이름]:9100']
      - job_name: django
    	metrics_path: /monitor/metrics
    	static_configs:
      	  - targets: ['장고1IP:80', '장고2IP:80']
            labels:
               app: 'myblog'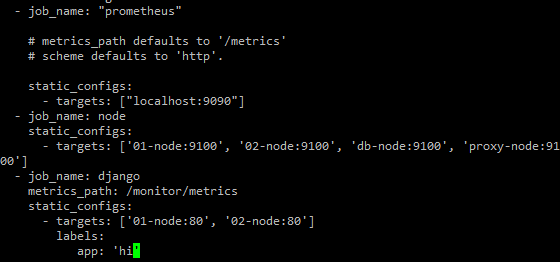
- 위에는 node 설정이다.
- 각 서버의 cpu나 램 사용량 같은 정보들을 긁어오기 위한 것
- 밑에는 django 서버를 모니터링 하기 위함이다.
- 어떠한 method들이 오고가는지, django 관련 모니터링을 위한 세팅이다.
- app: 뒤에는 아무거나 작성해도 상관없다.
방화벽 해제
- setenforce 0
- systemctl stop firewalld
실행
- systemctl restart prometheus
- 프로메테우스를 설정한 서버의 ip:9090 접속하면
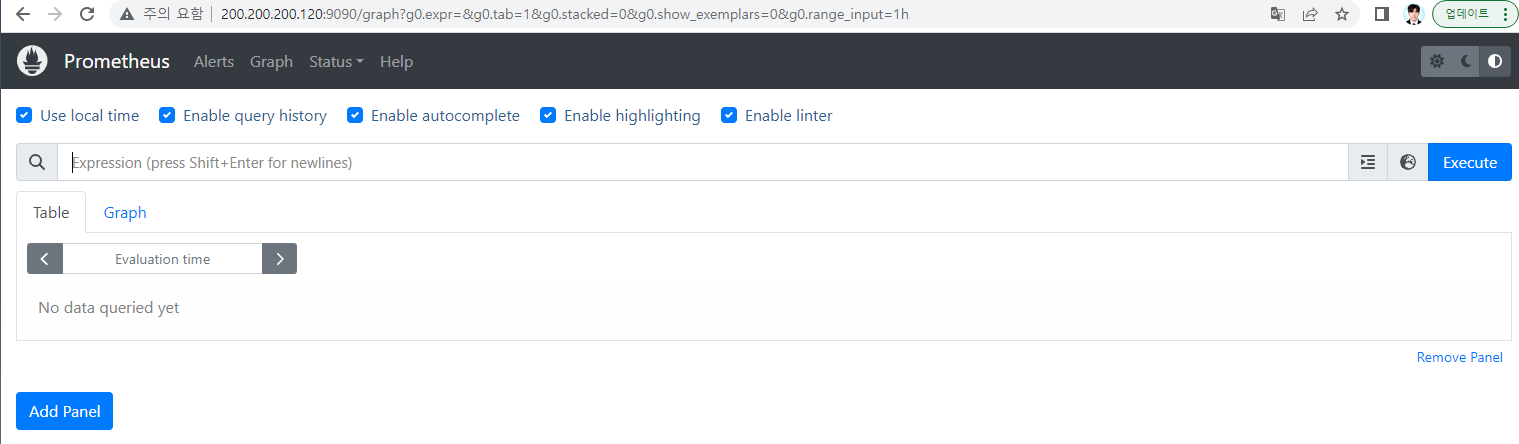
- 해당 웹사이트가 뜸.
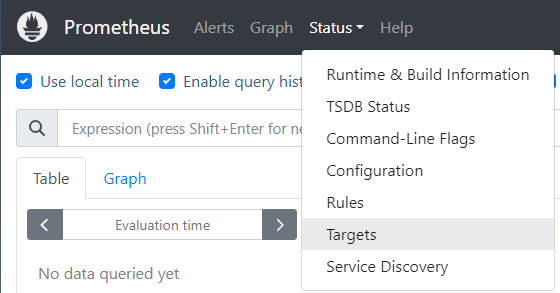
- status의 target 클릭
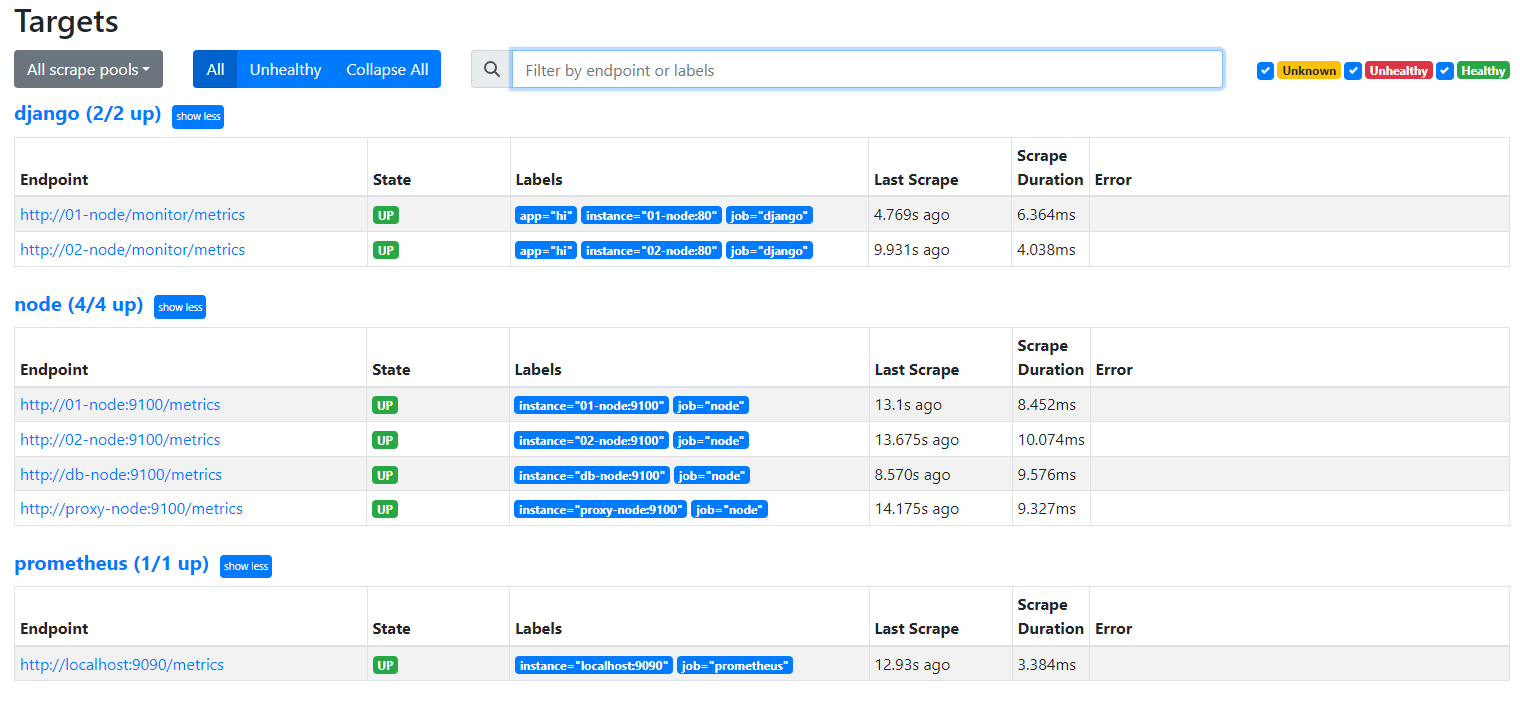
- 우리가 설정한 노드들과 django의 상태가 뜨는 걸 확인할 수 있다.
그라파나
설치
- dnf -y install grafana
설정
-
vi /etc/grafana/grafana.ini
-
35번 라인의 http_addr를 0.0.0.0 으로 수정해주자.
방화벽 해제
- setenforce 0
- systemctl stop firewalld
실행
- systemctl restart grafana-server
- 그라파나를 설치한 서버의 ip:3000 포트로 접속
- 로그인 id는 admin, pw도 admin이다.
- 자신의 비밀번호 설정
프로메테우스와 연동
- 7번까지 진행
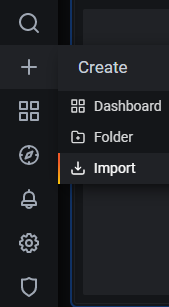
- 위의 그림처럼 클릭 후 import 클릭
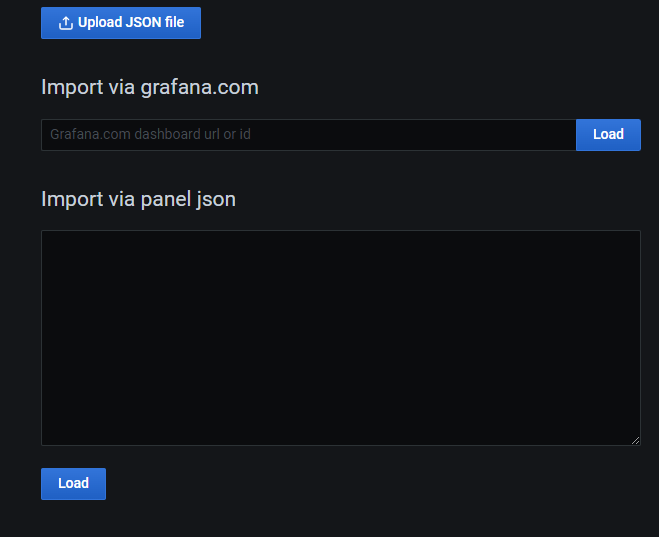
- 가장 위에 12486 입력 후 Load 버튼 클릭
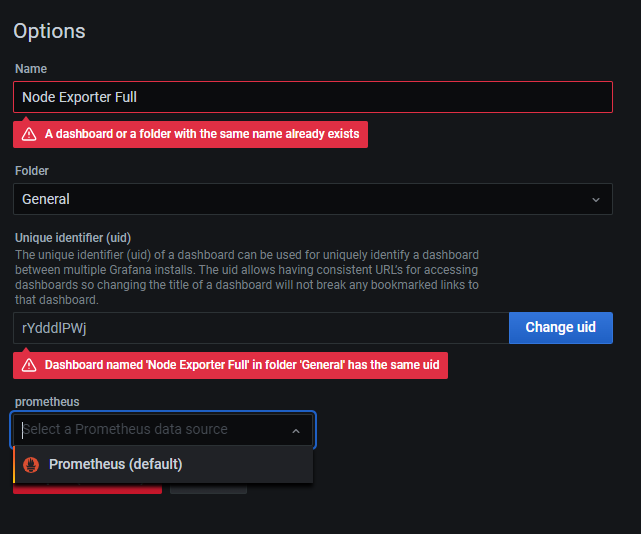
- 나는 이미 있어서 빨간색으로 나옴.
- 가장 아래 프로메테우스 클릭 후 Import 버튼 클릭
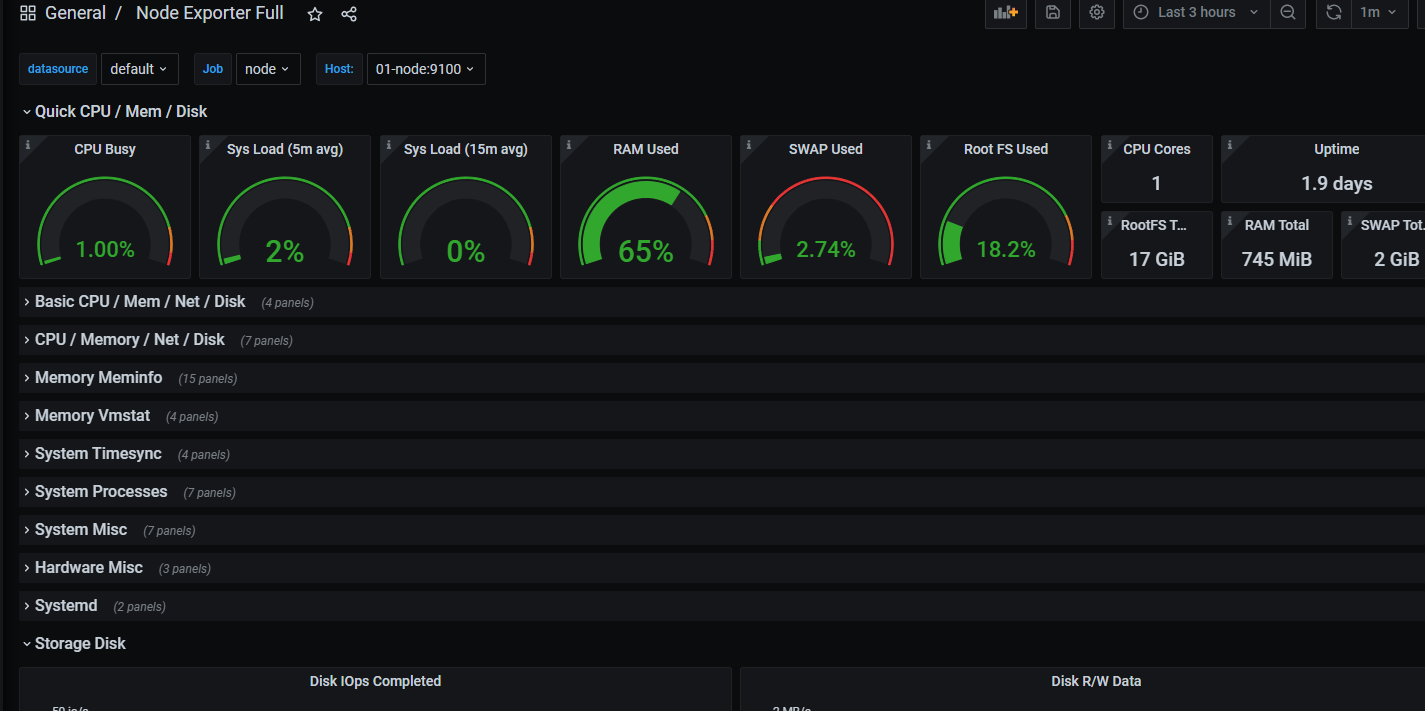
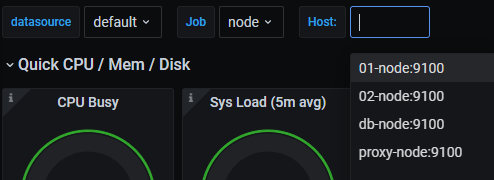
-
위의 그림처럼 각 노드들 별로 가상 컴퓨터 사용량을 확인할 수 있다.
-
그리고 다시 import 클릭 후 9528번 import
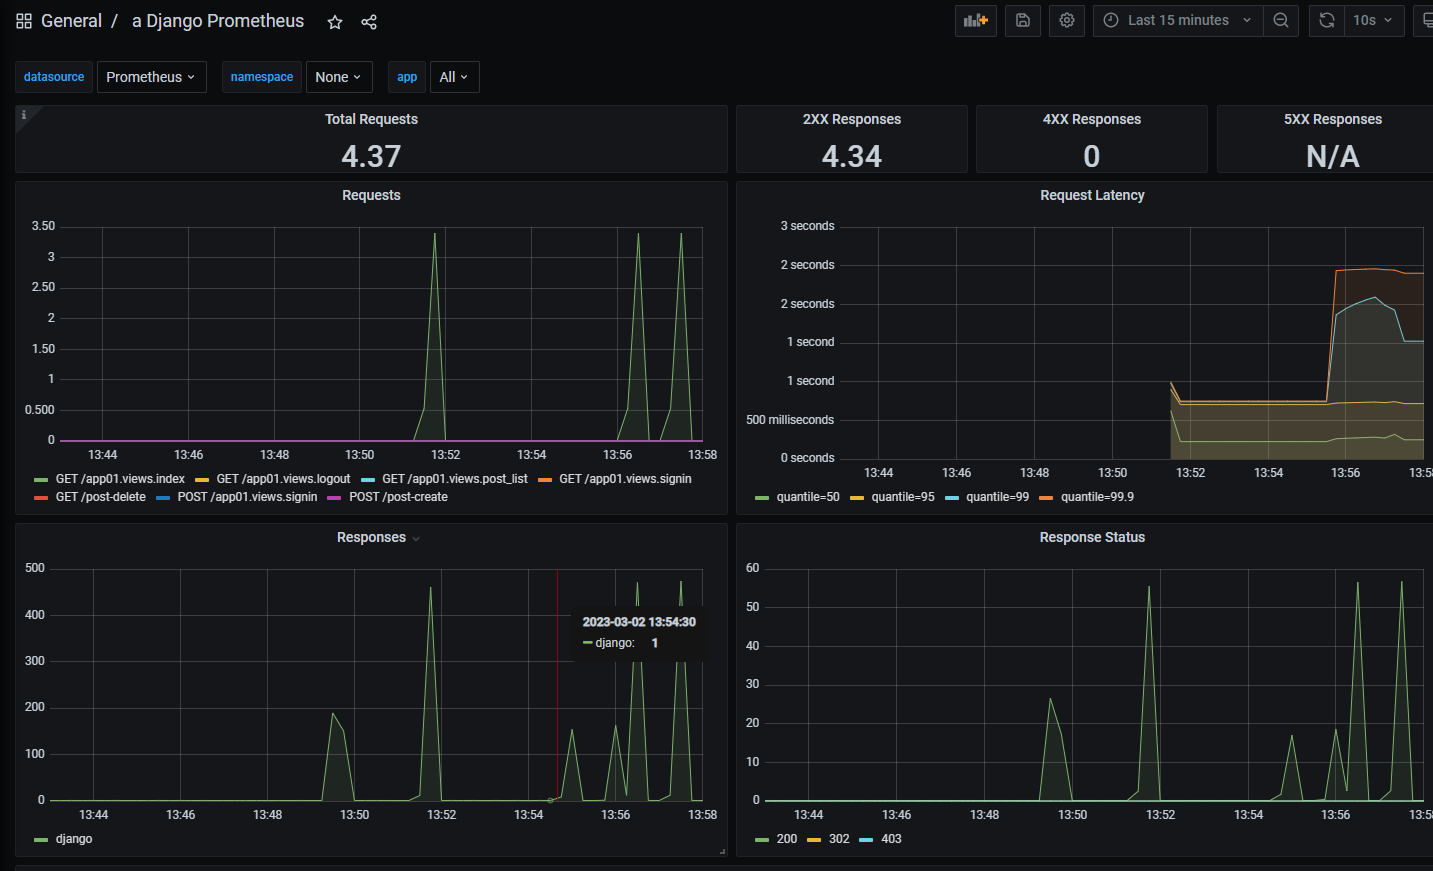
- 그러면 위의 그림처럼 Django로 만든 내 웹 사이트의 통신 정보들과 traffic 등등을 모니터링 할 수 있다.
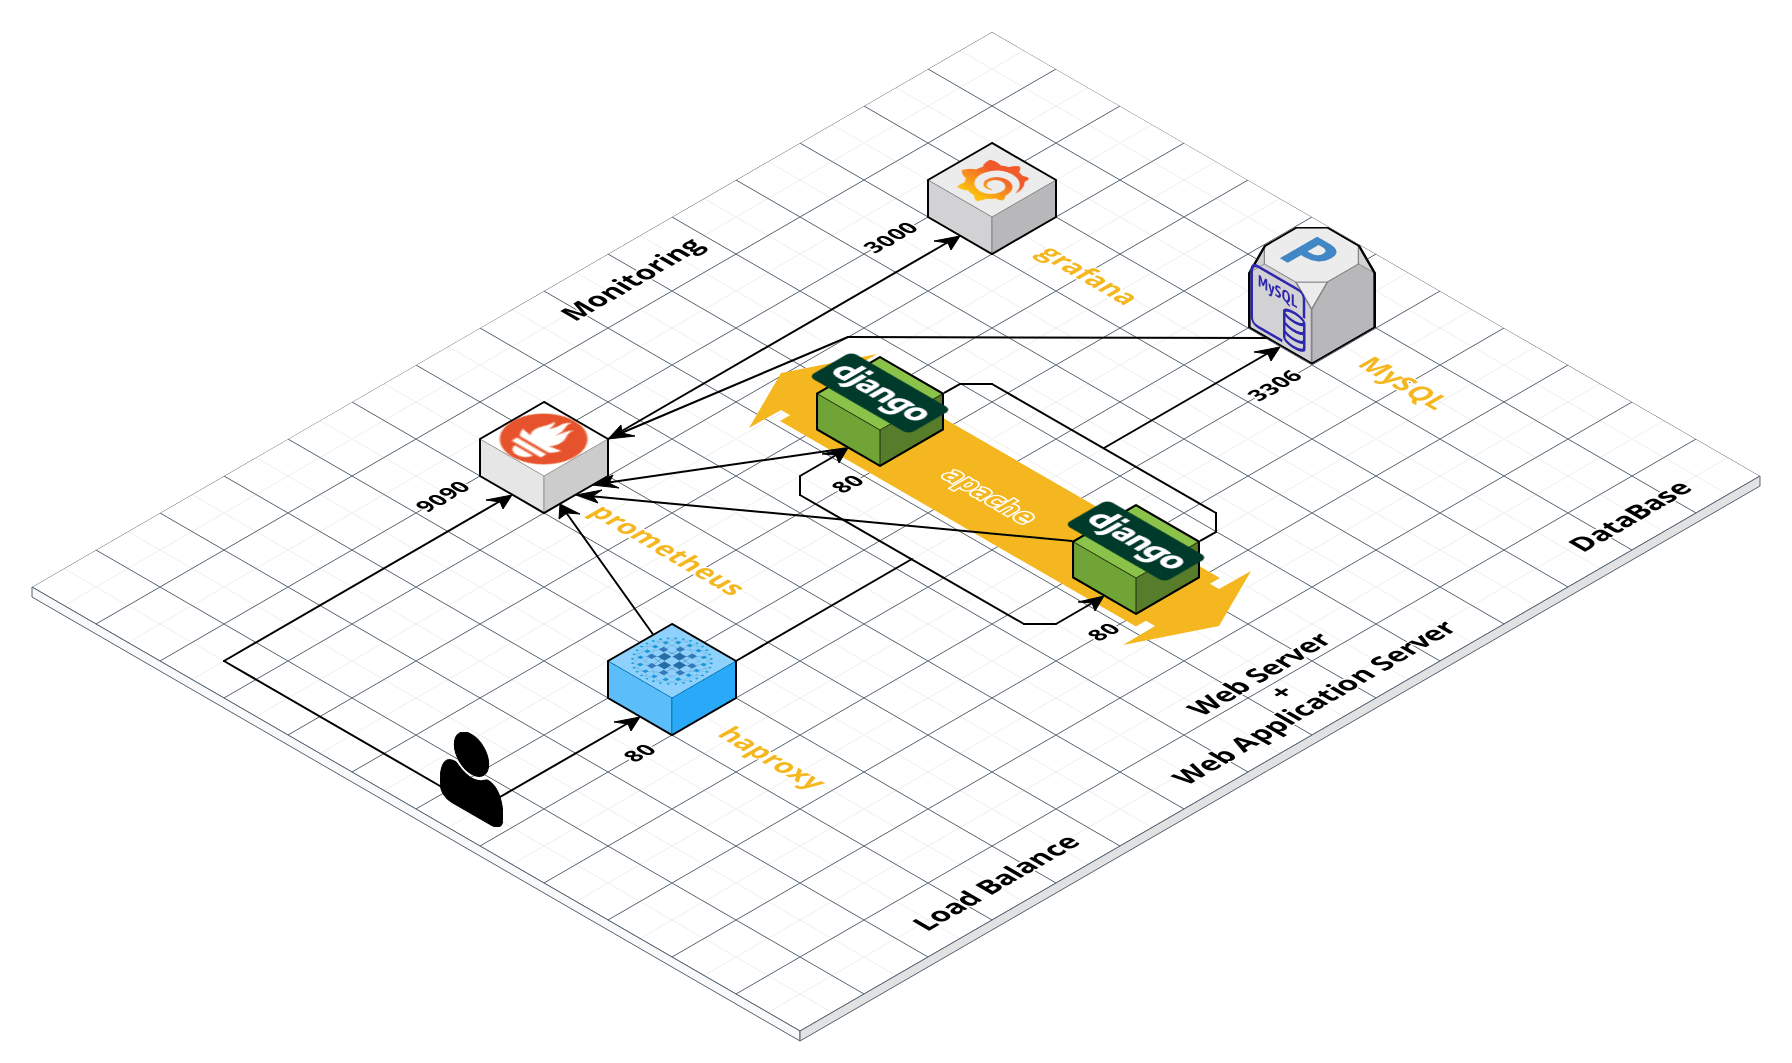
결과 아키텍쳐

- pure 장고를 이용했기 때문에 Web Server와 WAS를 한 곳에서 설계했다.
- 나중에는 front와 back을 분리해 3계층으로 설계할 예정
- haproxy를 이용해 부하를 분산
- 데이터베이스로는 MySQL을 사용
- 모니터링으로는 프로메테우스와 그라파나 사용
개선
- media 파일을 따로 스토리지를 만들어 주지 않아서 django에서 제공하는 개인 스토리지를 사용하고 있음.
- 그러다 보니, 해당 사이트에 들어가서 사진 게시글을 작성하면 한 장고 서버에는 저장이 되지만, 다른 장고 서버에는 저장이 안됨.
- 그래서 media 스토리지 서버를 구축해서 공동으로 사용할 예정.
- front와 back도 분리해서 Web Server와 WAS를 분리할 예정

2개의 댓글

This article was incredibly helpful! I was struggling to integrate Prometheus and Grafana with Django, and the step-by-step instructions here made it a lot easier to set up. I was having a hard time with configuring the settings.py and urls.py files, but the guide provided clear instructions that helped me understand exactly what I needed to do.
It was also nice to see the details on setting up Prometheus, MySQL, and HAProxy, which were crucial to the entire setup. It definitely saved me a lot of time, and I now have a fully working monitoring system in place!
Also, while looking for more setup guides, I came across this useful guide on how to install Tomcat on Ubuntu 24.04. If you're working on similar setups, it might help you out too!
Thanks again for sharing this article! It truly helped me a lot!
This article was incredibly helpful! I was struggling to integrate Prometheus and Grafana with Django, and the step-by-step instructions here made it a lot easier to set up. I was having a hard time with configuring the
settings.pyandurls.pyfiles, but the guide provided clear instructions that helped me understand exactly what I needed to do.It was also nice to see the details on setting up Prometheus, MySQL, and HAProxy, which were crucial to the entire setup. It definitely saved me a lot of time, and I now have a fully working monitoring system in place!
Also, while looking for more setup guides, I came across this useful guide on how to install Tomcat on Ubuntu 24.04. If you're working on similar setups, it might help you out too!
Thanks again for sharing this article! It truly helped me a lot!