eBPF "Hello World"
1. Build 환경 구성
만약 필요한 toolchain들이 없다면 설치해주도록 하자.
# eBPF 관련 동작에서는 sudo 권한이 필요
sudo -s
apt-get update
apt-get install -y apt-transport-https ca-certificates curl clang llvm jq
### libelf-dev, libpcap-dev, libbfd-dev, binutils-dev, build-essential, make: 이들은 개발에 필요한 라이브러리, 컴파일러, 빌드 도구 등을 제공
apt-get install -y libelf-dev libpcap-dev libbfd-dev binutils-dev build-essential make
### linux-tools-common, linux-tools-$(uname -r): 현재 실행 중인 리눅스 커널 버전에 맞는 리눅스 도구를 설치
apt-get install -y linux-tools-common linux-tools-$(uname -r)
apt-get install -y python3-pip
ebpf를 실행하기 위해서는 libbpf가 필요하다. libbpf는 BPF프로그램을 compile하고 load하는 데 사용되는 C라이브러리이다. 즉, BPF 프로그램의 실행에 초점을 맞춘 도구라고 볼 수 있는데, libbpf는 사용자가 작성한 BPF program을 binary형태로 변환하고 이를 커널에 load하며 program이 실행되는 동안 필요한 메모리 공간을 할당하는 등의 작업을 수행한다. 또한, BPF program의 오류를 감지고하고 디버깅하는 기능도 제공한다.
git clone --recurse-submodules https://github.com/libbpf/libbpf.git
cd libbpf/src
make install
또한, bcc라는 것 또한 필요한데 BPF를 위한 compiler와 tool들의 집합인 BPF Compiler Collection을 의미한다. bcc는 BPF program을 작성하는데 필요한 여러가지 언어와 tool를 제공하여, 이를 통해 network packet filtering, system monitoring, security monitoring 등의 작업을 수행할 수 있다. 또한, bcc는 BPF program을 debug하고 최적화하는데 도움이 되는 도구들도 포함하고 있다. 즉, 하나의 framework기능을 제공하는 것이다.
참고로 libbpf없이 bcc만으로도 컴파일 및 빌드, 실행이 가능하다. 실제로 bcc내부 code를 들여다보면 libbpf가 github module이 들어있다. 그러나 오늘날에는 bcc를 production으로 잘 사용하지 않고 libbpf만 사용한다. 이에 대해서는 추후에 알아보도록 하고, bcc를 사용해 ebpf에 대해서 알아보도록 하자. https://devops.com/libbpf-vs-bcc-for-bpf-development/
bcc의 간단한 설치 방법
echo deb http://cloudfront.debian.net/debian sid main >> /etc/apt/sources.list
sudo apt-get install -y bpfcc-tools libbpfcc libbpfcc-dev linux-headers-$(uname -r)
다음으로 BPF program의 동작 방식을 모니터링하고, program에서 발생한 event를 관찰하는데 도움을 주는 bpftool을 설치하도록 하자.
git clone --recurse-submodules https://github.com/libbpf/bpftool.git
cd bpftool
docker build -t bpftool .
docker run --rm -ti --privileged --pid=host bpftool prog list
alias bpftool=docker run --rm -ti --privileged --pid=host bpftool
bpftool prog list
prog list가 쭉 나열되면 성공한 것이다.
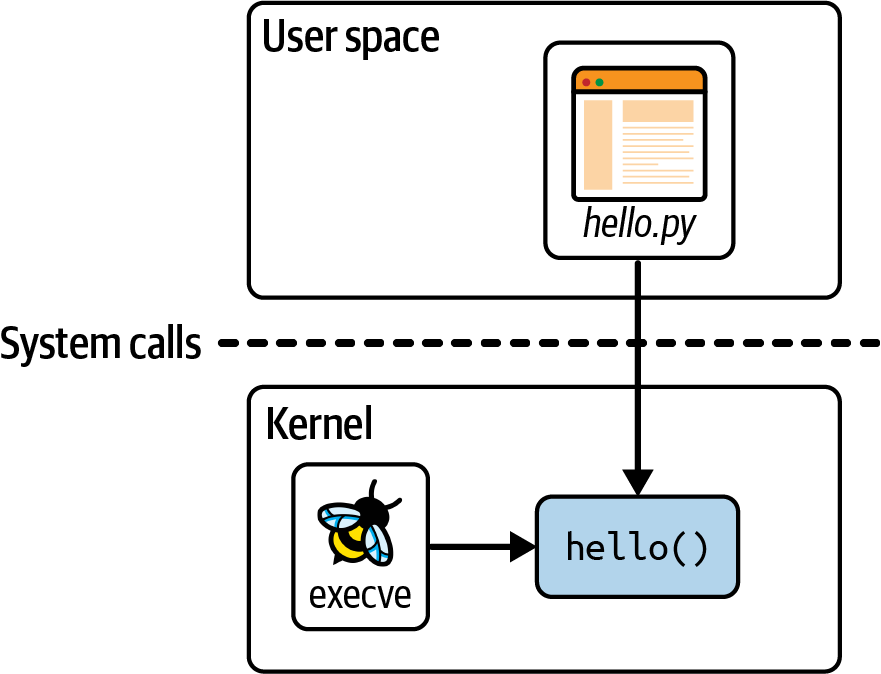
2. eBPF hello.py
이제 bpftool까지 설치완료하였으니 간단한 BPF program을 만들어 실행시켜주도록 하자.
- hello.py
#!/usr/bin/python3
from bcc import BPF

program = r"""
int hello(void *ctx) {
    bpf_trace_printk("Hello World!");
    return 0;
}
"""

b = BPF(text=program)
syscall = b.get_syscall_fnname("execve")
b.attach_kprobe(event=syscall, fn_name="hello")

b.trace_print()bcc를 설치했기 때문에 python으로 된 hell.py를 쉽게 실행시킬 수 있다.
이 code는 두 가지 부분으로 나눌 수 있다. 하나는 eBPF program 그 자체로 kernel에 동작할 부분이고 하나는 user space code로 eBPF program을 kernel에 로드하고, kernel에서 동작 중인 eBPF에서 생성한 것들을 trace하는 부분이다. hello.py는 user space application part이고 hello()은 kernel에서 동작하는 eBPF program인 것이다.
int hello(void *ctx) {
    bpf_trace_printk("Hello World!");
    return 0;
}
eBPF program 그자체는 C code로 쓰여있다.
bpf_trace_printk()는 message를 쓰기위해 사용하는 helper function이다. helper function은 BPF와 eBPF를 구분하는 큰 특징 중하나인데 helper function은 일련의 함수 set으로 system과 상호작용하기위해 사용한다.
위에서, 전체 eBPF program은 program이라는 string으로 정의되어있다. 이 C program은 실행되기 전에 compile이 되어야하는데 bcc에서 이를 책임져주므로, 오직 해당 eBPF program을 python code에 파라미터로 넘겨주면 될 뿐이다.
b = BPF(text=program)eBPF program은 event에 attach될 필요가 있는데, 해당 예시에서는 system call인 execve에 attach되었다. 해당 machine에 새로운 program이 실행될 때마다 execve() system call이 호출되므로, 새 program이 실행될 때마다 우리의 eBPF program이 실행된다. 비록 execve() 이름은 linux에서의 표준 정의이지만 chip architecture마다 다르다는 것에 유의하자.
syscall = b.get_syscall_fnname("execve")syscall은 kernel function을 나타낸다. 여기서는 execve이다. kprobe를 사용하여 kernel function event를 hello function에 attach해주도록 하자.
b.attach_kprobe(event=syscall, fn_name="hello")이 시점부터 eBPF program은 kernel에 load되고 event에 attach된다. 따라서, 새로운 실행 program이 machine에 생기면 eBPF program이 매번 실행되는 것이다.
b.trace_print()다음은 python code에서 eBPF program을 실행시키고 kernel에 의해 발생한 output을 읽는 코드이다.
다음은 우리가 만든 code의 실행을 보여준다.
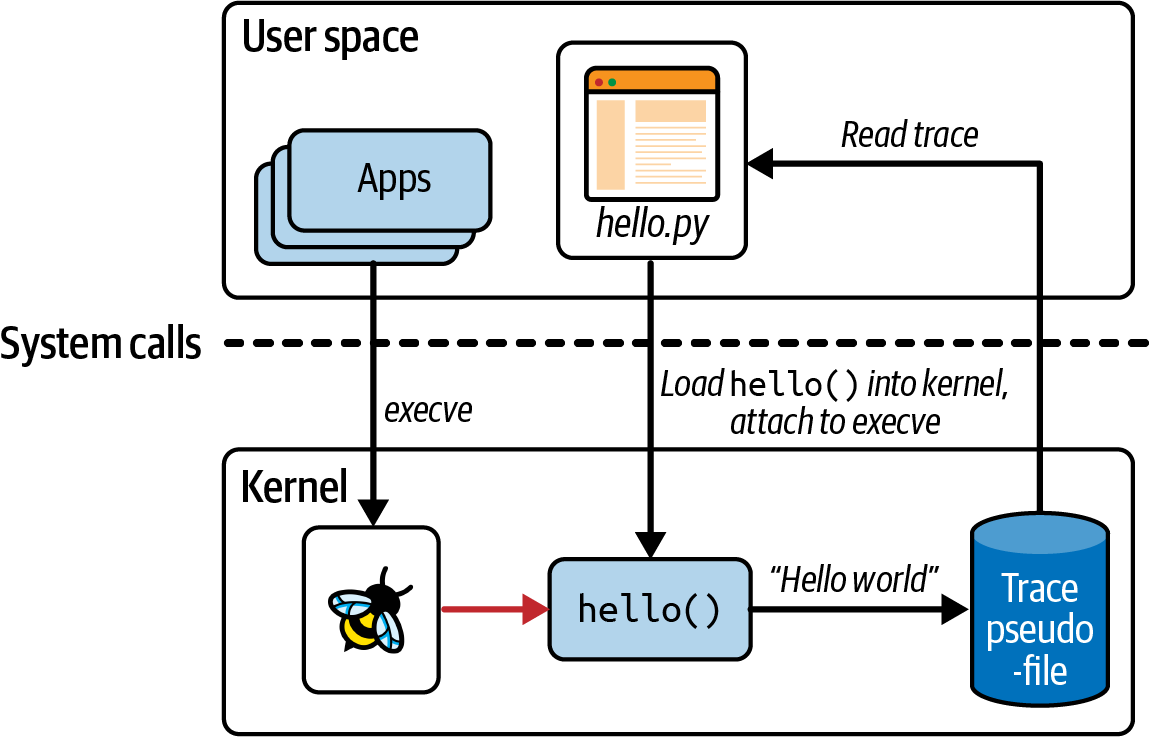
python program은 eBPF C code를 compile하고 kernel에 load한다. 또한, execve syscall kprobe에 eBPF C code를 attach하여, machine에 application이 실행되어 execve() call을 실행하면 eBPF program을 실행시키고, 특정 pseudofile에 trace line을 써준다. python program은 pseudofile로부터 trace message를 읽고 user에게 보여준다.
이제 hello.py를 실행시켜보도록 하자.
./hello.py
b'           <...>-940879  [002] d...1 2952790.470663: bpf_trace_printk: Hello World!'
b'           <...>-940887  [012] d...1 2952790.474027: bpf_trace_printk: Hello World!'
...
hello.py program을 실행시키자마자, 기존에 실행중인 process들에 의해 발생한 event들에 의해서 log들이 쭉쭉 올라올 것이다. 이러한 특징은 다음의 장점을 갖는다.
- eBPF program으 동적으로 사용하여 system의 동작을 바꿀 수 있다. machine을 재부팅할 필요도 없고, 실행중인 process를 재시작할 필요도 없다.
eBPFcode는 event에 attach되자마자 실행되기 때문이다. - 다른 application에 대해서 어떤 것도 변경할 필요가 없다.
trace output은 Hello World string뿐만 아니라 event에 대한 추가적인 context 정보를 보여준다. execve system call로 만들어진 process는 process ID를 가지며 위의 예제에서는 940879와 940887가 있다. 이러한 context 정보는 eBPF 자체에서 제공하는 것이 아니라 kernel tracing infrastructure로 추가되는 부분이다. 물론 contextual information을 eBPF program 자체에서 호출해보도록 할수는 있다.
어떻게 bpf_trace_printk를 통해서 python code가 kernel의 log를 가져올 수 있는 지 궁금할 것이다. 이 해답은 굉장히 간단한데, kernel안에서의 helper function은 output을 같은 predefined pseudofile에 전달한다. 이 file의 경로가 바로 /sys/kernel/debug/tracing/trace_pipe이다. cat을 통해서 해당 내용에 접근할 수가 있다.
이 뜻은 하나의 machine에 여러 eBPF program을 동작시키면 그 결과가 모두 같은 directory에 기록된다는 것이다. 따라서 좀 더 나은 방법을 제공하기 위해서 eBPF map을 제공한다.
3. BPF Maps
map은 eBPF program과 user space로부터 접근할 수 있는 자료구조이다. map은 eBPF와 BPF를 나누는 가장 큰 차이점 중 하나인데, 사실 BPF map이라고 써도 eBPF map과 같은 말이니 너무 구분할 필요없다.
Map은 여러 eBPF program들 사이에 data를 공유하거나 kernel 동작중인 eBPF code와 user space application 사이에 통신을 위해 사용된다. 일반적인 사용방법은 다음을 포함한다.
- user space에서 eBPF program이 사용할 configuration information을 써준다.
- 하나의 eBPF program이 state를 저장하고 나중에 또 다른 eBPF program이 이를 사용할 때 사용한다. 또는 같은 program이 미래에 다시 사용해서 이전 state를 복구할 때 사용한다.
- eBPF program이 results와 metrics를 map에 저장한다. 이 후에 user space app이 해당 값을 가져오고 결과를 application에 제공한다.
BPF map은 사실 굉장히 다양한 구현이 가능한데 bcc에서는 hash table map을 제공한다. 다음은 code는 위의 예제와 같은 code이지만 counter_table이라는 BPF map을 가지고 있다. counter_table은 key-value형식으로 key는 user ID이고 value는 execve가 실행된 개수이다.
- hello-map.py
#!/usr/bin/python3
from bcc import BPF
from time import sleep

program = r"""
BPF_HASH(counter_table);

int hello(void *ctx) {
   u64 uid;
   u64 counter = 0;
   u64 *p;

   uid = bpf_get_current_uid_gid() & 0xFFFFFFFF;
   p = counter_table.lookup(&uid);
   if (p != 0) {
      counter = *p;
   }
   counter++;
   counter_table.update(&uid, &counter);
   return 0;
}
"""

b = BPF(text=program)
syscall = b.get_syscall_fnname("execve")
b.attach_kprobe(event=syscall, fn_name="hello")

# Attach to a tracepoint that gets hit for all syscalls
# b.attach_raw_tracepoint(tp="sys_enter", fn_name="hello")

while True:
    sleep(2)
    s = ""
    for k,v in b["counter_table"].items():
        s += f"ID {k.value}: {v.value}\t"
print(s)BPF_HASH는BCCmacro로 hash table map을 정의한다.bpf_get_current_uid_gid()는 helper function으로 kprobe event를 발생시킨 process에 대한 user ID를 제공한다. user ID는 64bit로 이루어져 있고 앞의 값은 user ID를 나타내고, 뒤의 32bit는 group id를 나타낸다.counter_table.lookup을 통해서 user ID에 저장되어 있던 counter값을 가지고 오고, 해당 값을 업데이트한다. 만약 없었다면 0에서 +1을 한다.
hash table인 BPF map에 접근하는 code를 살펴보도록 하자.
p = counter_table.lookup(&uid);lookup는 counter_table의 uid에 해당하는 값을 가져오는 부분이다.
counter_table.update(&uid, &counter);update는 counter_table의 uid에 해당하는 값을 업데이트해주는 부분이다.
bcc의 재미난 점인데, 코드가 마치 golang처럼 보인다. 왜냐하면 golang에서는 구조체에 method를 추가할 수 있지만 c에서는 아니기 때문이다. 이처럼 bcc는 C스럽지 않은 코드를 제공해주는 것이 특징이다.
이전과 마찬가지로 program이라는 eBPF program을 실행하고 execve event에 attach하는 부분이다.
b = BPF(text=program)
syscall = b.get_syscall_fnname("execve")
b.attach_kprobe(event=syscall, fn_name="hello")
BPF map을 사용했기 때문에 python code에서 추가적으로 해야할 부분들이 있다.
while True:
    sleep(2)
    s = ""
    for k,v in b["counter_table"].items():
        s += f"ID {k.value}: {v.value}\t"
    print(s)
재밌게도 b["counter_table"]이라는 문법만으로 BPF map에 접근할 수 있다.
이제 program을 실행시키면 계속해서 실행되는 process의 counter를 볼 수 있다.
./hello-map.py
ID 1002: 29     ID 0: 47        ID 1001: 3
ID 1002: 41     ID 0: 94        ID 1001: 3
ID 1002: 70     ID 0: 138       ID 1001: 6
...
현재 table에 3개의 entry가 있다는 것이고, 1002, 0, 1001 process id가 있다는 것이다.
이렇게 BPF map(hash table)을 사용해 data를 eBPF program에서 user space로 전달할 수 있다. 그러나, 이러한 방식은 계속해서 user space에서 kernel의 영역에 대해서 polling해야한다는 부담이 있다. linux kernel에서는 이미 perf subsystem을 지원하여 kernel에서의 data를 user space로 제공하고, eBPF는 perf buffers와 그 후계자인 ring buffers를 지원한다. (https://perf.wiki.kernel.org/index.php/Main_Page)
4. Perf and Ring Buffer Maps
bcc의 BPF_PERF_OUTPUT 기능을 사용하여 perf ring buffer map에 data를 쓸 수 있다.
BPF ring buffers는 새롭게 등장한 단어로 현재는 BPF perf buffers보다 자주 쓰이고, 선호된다. 다음을 참고해보도록 하자. https://nakryiko.com/posts/bpf-ringbuf/
ring buffers는 딱히 별게아니라 ring모양의 memory space를 logical하게 구현한 것이 전부이다. 단 분리된 write, read 포인터가 존재한다. 임의의 길이를 가지는 data는 header에 있는 length 정보와 함께 write pointer가 가리키는 어디서든 쓰여진다. writer pointer는 data의 끝 이후로 다음 칸으로 이동하며, 다음 write operation을 준비한다.
read operation도 유사하게 read pointer가 있는 곳으로부터 data를 가져오는데 얼마나 data를 읽을 지 결정하기 위해서 header를 사용한다. read poin는 write pointer와 같은 방향으로 움직이기 때문에, 다음으로 읽을 data를 가리킬 수 있는 것이다. 아래의 그림은 3개의 다른 data를 가진 ring buffer을 보여준다.
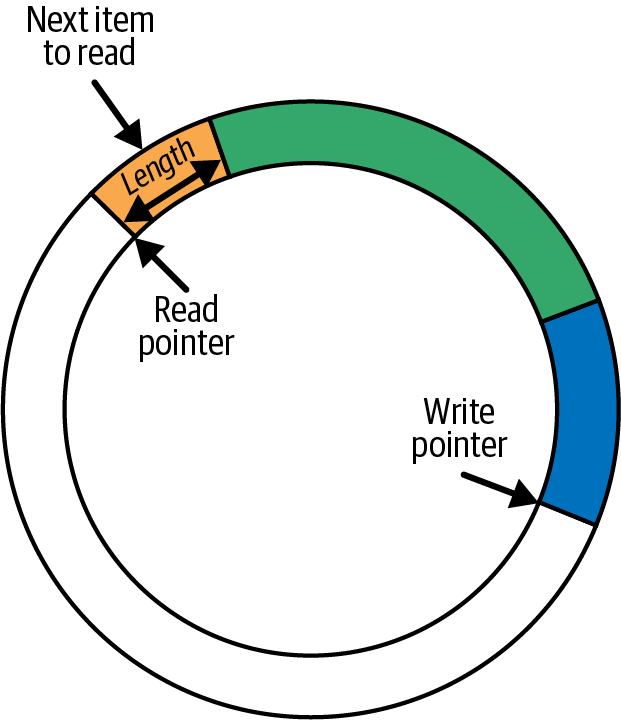
만약 read pointer가 write pointer를 따라잡으면 더이상 읽은 데이터가 없다는 것이다. 만약 writer operation에서 쓰여질 data의 length가 read pointer를 따라잡는다면 해당 data를 write하는 연산을 포기하고, drop counter를 증가시킨다. read operation은 drop counter를 포함하여 가장 최근에 성공한 read operation으로부터 data가 잃었는지 아닌지 알려준다.
ring buffer의 size는 write와 read 연산에서 사용되는 data의 크기를 수용 할만큼 충분하게 설정되어야한다.
이제 ring buffer를 사용해보도록 하자.
- hello-buffer.py
#!/usr/bin/python3
from bcc import BPF

program = r"""
BPF_PERF_OUTPUT(output);

struct data_t {
   int pid;
   int uid;
   char command[16];
   char message[12];
};

int hello(void *ctx) {
   struct data_t data = {};
   char message[12] = "Hello World";

   data.pid = bpf_get_current_pid_tgid() >> 32;
   data.uid = bpf_get_current_uid_gid() & 0xFFFFFFFF;

   bpf_get_current_comm(&data.command, sizeof(data.command));
   bpf_probe_read_kernel(&data.message, sizeof(data.message), message);

   output.perf_submit(ctx, &data, sizeof(data));

   return 0;
}
"""

b = BPF(text=program)
syscall = b.get_syscall_fnname("execve")
b.attach_kprobe(event=syscall, fn_name="hello")

def print_event(cpu, data, size):
   data = b["output"].event(data)
   print(f"{data.pid} {data.uid} {data.command.decode()} {data.message.decode()}")

b["output"].open_perf_buffer(print_event)
while True:
   b.perf_buffer_poll()
eBPF code만 따로보면 다음과 같다.
BPF_PERF_OUTPUT(output);

struct data_t {
   int pid;
   int uid;
   char command[16];
   char message[12];
};

int hello(void *ctx) {
   struct data_t data = {};
   char message[12] = "Hello World";

   data.pid = bpf_get_current_pid_tgid() >> 32;
   data.uid = bpf_get_current_uid_gid() & 0xFFFFFFFF;

   bpf_get_current_comm(&data.command, sizeof(data.command));
   bpf_probe_read_kernel(&data.message, sizeof(data.message), message);

   output.perf_submit(ctx, &data, sizeof(data));

   return 0;
}
"""BPF_PERF_OUTPUT: kernel에서 user space로 message를 전달하기 위해 사용되는 map를 생성한다. 위에서 해당map의 이름은output이 된다.hello()가 실행될 때마다data라는 구조체를 만든다. 이data구조체에는 processID와 현재 실행중인 command, 그리고 text message를 전달한다.bpf_get_current_pid_tgid는helper_function으로 eBPF program을 실행하도록한 process의 ID를 가져온다. 64bit로 되어있고 뒤의 32bit가 process ID이다.bpf_get_current_uid_gid를 통해서 user id를 가져올 수 있다.bpf_get_current_comm는 helper function으로execvesyscall을 만든 process에서 실행중인 command를 가져온다.bpf_probe_read_kernel는 kernel memory에 있는 data를 eBPF에서 복사할 때 사용한다.message가 kernel에 있는 data이기 때문에 message를data.message로 저장하기 위해서는bpf_probe_read_kernel을 사용해야한다. 단, 첫번째 인자로 double pointer가 들어가야한다.populated를 통해서 data를 ring buffer에 저장하는 것이다.
이제 python code에서 이를 어떻게 사용하는 지 확인해보도록 하자.
b = BPF(text=program)
syscall = b.get_syscall_fnname("execve")
b.attach_kprobe(event=syscall, fn_name="hello")

def print_event(cpu, data, size):
   data = b["output"].event(data)
   print(f"{data.pid} {data.uid} {data.command.decode()} {data.message.decode()}")

b["output"].open_perf_buffer(print_event)
while True:
b.perf_buffer_poll()print_event는 callback함수로 screen에 output data를 보여주고b["output"].event()를 사용해 data를 가져온다.b["output"].open_perf_buffer()는 perf ring buffer를 열어준다. 이 함수는print_event함수를 파라미터로 받아 buffer로부터 읽어들일 data가 있을 때마다, callback function으로 사용한다.b.perf_buffer_poll을while문으로 계속 실행하여 perf ring buffer를 polling한다. 만약 사용 가능한 data가 있다면print_event를 실행시킨다.
이제 실행시켜보도록 하자.
sudo ./hello-buffer.py
11654 node Hello World
11655 sh Hello World
...
이전 예제와는 달리 현재의 예제는 output이라는 ring buffer를 통해서 data가 있을 때만 data를 가져와 보여준다는 것이다.
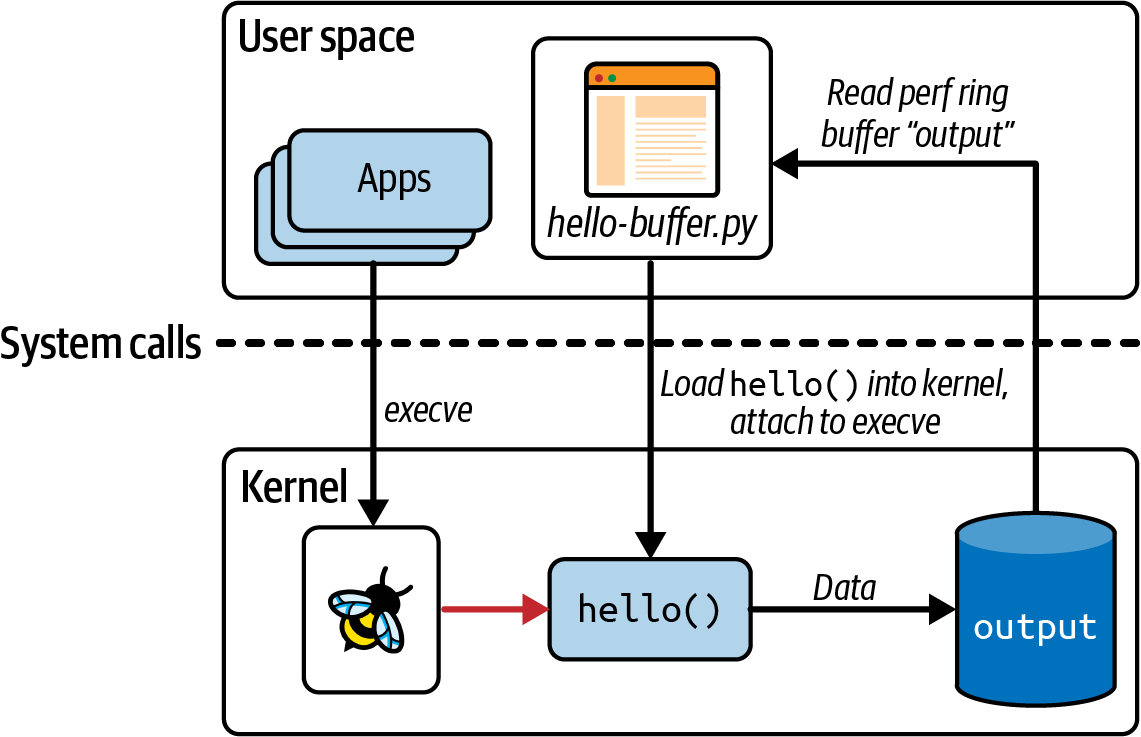
ring buffer를 사용했기 때문에 trace pipe로 data가 흘러가지 않는다. hello-buffer.py를 실행시키고 cat /sys/kernel/debug/tracing/trace_pipe을 실행시키면 아무것도 얻지 못할 것이다.
위 예제를 통해서 eBPF가 어떻게 동작하고 어떻게 데이터를 가져오는 지 알 수 있었다. 더 나아가 다양한 example들에 대해서 알아보도록 하자.
5. Function call과 tail calls
큰 code block을 여러 개의 code로 나누어 배치하는 function으로 만드는 것은 매우 일반적인 일이지만 BPF에서는 이것이 매우 어려운 일이다. 특히 bcc에서는 inline function이 이외에는 function call이 거의 불가능하다.
static __always_inline void my_function(void *ctx, int val)다음의 경우와 같은 inline function이 call가능한 이유는 아래와 같이 inline 함수는 일반적인 function과 달리 code실행 라인에 그대로 붙여지기 때문이다.
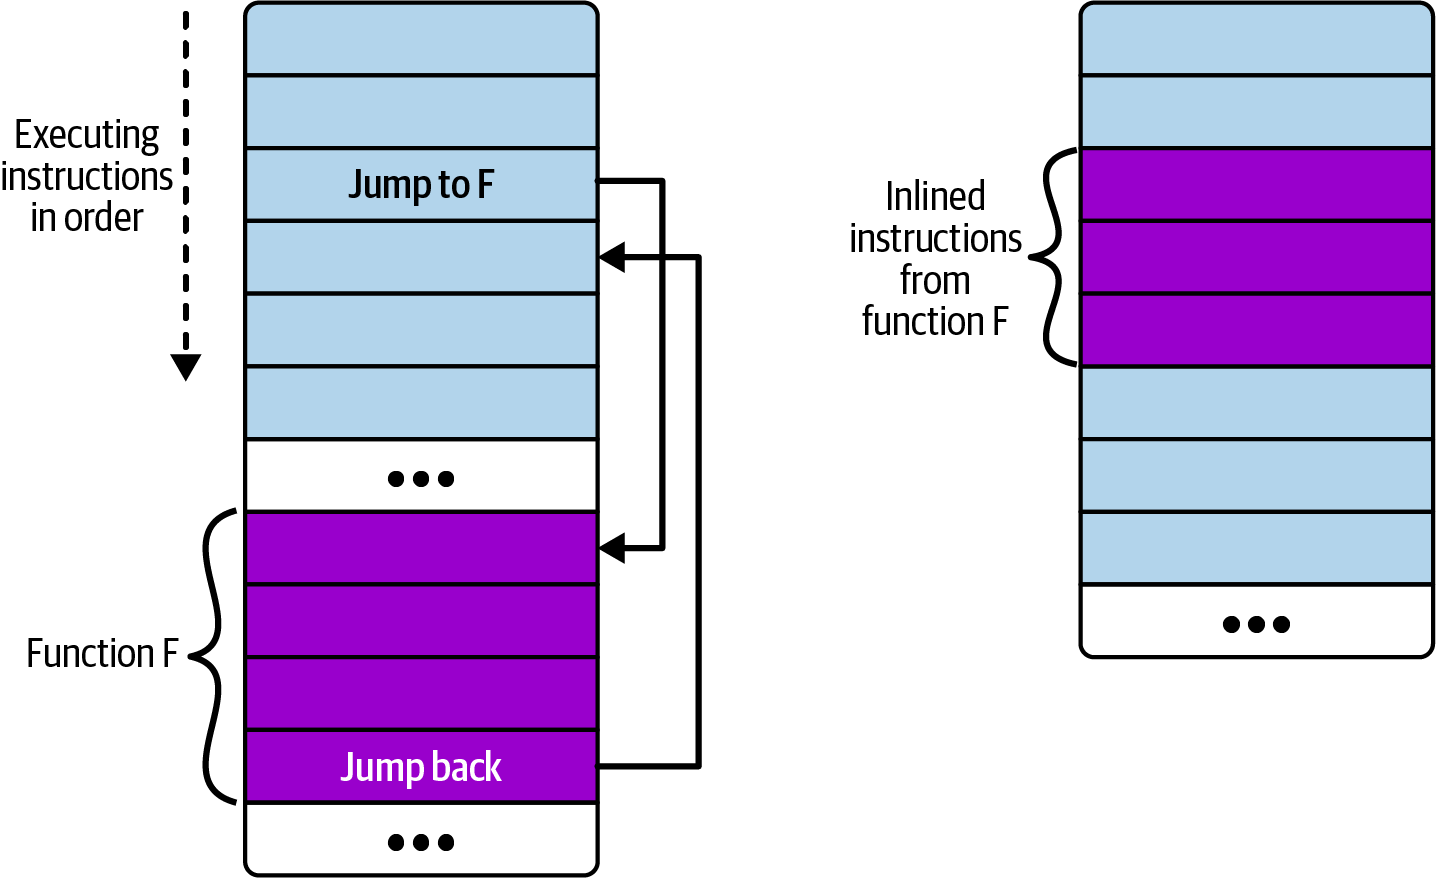
즉, 왼쪽의 일반적인 함수 호출에는 main code가 실행되다가 function의 instruction set으로 jump해야한다. 반면 오른쪽의 inline code는 main code에 function instruction set이 삽입되어 있어 jump없이 code가 실행되는 것이다.
다행히도 linux kerne 4.16과 LLVM 6.0이후로 이러한 제약이 풀려서, eBPF program에서 다른 eBPF program을 호출하는 것이 가능해졌다. 문제는 BPF to BPF function calls 또는 BPF subprograms는 여전히 bcc framework에서 불가능하다.
이러한 일을 해결하기위해서 eBPF에서는 tail calls라는 개념을 도입하였다.
ebpf.io에서는 tail calls는 또다른 eBPF program을 호출/실행시키고 execution context를 교체한다. 이는 마치execve() system call이 동작하는 것과 유사한데, 즉 tail call이 완료된 후에 execution이 호출자에게 돌아가지 않는다. 이는 마치 process가 fork시켜서 일련의 sub process를 만들어 chain을 이루는 것과 같은 동작이다.
이렇게 tail calls를 쓰는 이유는 function이 recursive하게 호출되어 stack overflow를 발생시키지 않게하기 위함이다. tail calls를 사용하면 stack size가 512bytes로 제한된 eBPF에서는 stack이 증가하는 일 없이 일련의 function call을 호출할 수 있는 장점이 있다.
tail calls는 bpf_tail_call() helper function을 사용하여 만들 수 있다.
long bpf_tail_call(void *ctx, struct bpf_map *prog_array_map, u32 index)ctx는 eBPF program을 호출할 때, context를 전달할 수 있다.prog_array_map은 eBPF map type인BPF_MAP_TYPE_PROG_ARRAY으로 eBPF program을 식별하는 일련의 file descriptor들을 가지고 있다.index는 어떤 eBPF program이 호출되어야하는 지를 나타낸다.
이 helper function은 함수가 성공하면 아무것도 반환하지 않는다는 점에서 다소 이례적이다. 현재 실행중인 eBPF program은 stack에서 program이 호출되는 것에 따라 변경된다. 가령, 만약 지시한 program이 map에 없다면 helper function이 실패할 수 있으며, 이 경우 기존 program이 계속 실행된다.
user space code는 모든 eBPF program을 kernel에 load해야하며 또한, program array map을 설정해야한다.
이제 예시를 보도록 하자.
- hello-tail.py
#!/usr/bin/python3
from bcc import BPF
import ctypes as ct

program = r"""
BPF_PROG_ARRAY(syscall, 300);

int hello(struct bpf_raw_tracepoint_args *ctx) {
    int opcode = ctx->args[1];
    syscall.call(ctx, opcode);
    bpf_trace_printk("Another syscall: %d", opcode);
    return 0;
}

int hello_exec(void *ctx) {
    bpf_trace_printk("Executing a program");
    return 0;
}

int hello_timer(struct bpf_raw_tracepoint_args *ctx) {
    int opcode = ctx->args[1];
    switch (opcode) {
        case 222:
            bpf_trace_printk("Creating a timer");
            break;
        case 226:
            bpf_trace_printk("Deleting a timer");
            break;
        default:
            bpf_trace_printk("Some other timer operation");
            break;
    }
    return 0;
}

int ignore_opcode(void *ctx) {
    return 0;
}
"""

b = BPF(text=program)
b.attach_raw_tracepoint(tp="sys_enter", fn_name="hello")

ignore_fn = b.load_func("ignore_opcode", BPF.RAW_TRACEPOINT)
exec_fn = b.load_func("hello_exec", BPF.RAW_TRACEPOINT)
timer_fn = b.load_func("hello_timer", BPF.RAW_TRACEPOINT)

prog_array = b.get_table("syscall")
prog_array[ct.c_int(59)] = ct.c_int(exec_fn.fd)
prog_array[ct.c_int(222)] = ct.c_int(timer_fn.fd)
prog_array[ct.c_int(223)] = ct.c_int(timer_fn.fd)
prog_array[ct.c_int(224)] = ct.c_int(timer_fn.fd)
prog_array[ct.c_int(225)] = ct.c_int(timer_fn.fd)
prog_array[ct.c_int(226)] = ct.c_int(timer_fn.fd)

# Ignore some syscalls that come up a lot
prog_array[ct.c_int(21)] = ct.c_int(ignore_fn.fd)
prog_array[ct.c_int(22)] = ct.c_int(ignore_fn.fd)
prog_array[ct.c_int(25)] = ct.c_int(ignore_fn.fd)
prog_array[ct.c_int(29)] = ct.c_int(ignore_fn.fd)
prog_array[ct.c_int(56)] = ct.c_int(ignore_fn.fd)
prog_array[ct.c_int(57)] = ct.c_int(ignore_fn.fd)
prog_array[ct.c_int(63)] = ct.c_int(ignore_fn.fd)
prog_array[ct.c_int(64)] = ct.c_int(ignore_fn.fd)
prog_array[ct.c_int(66)] = ct.c_int(ignore_fn.fd)
prog_array[ct.c_int(72)] = ct.c_int(ignore_fn.fd)
prog_array[ct.c_int(73)] = ct.c_int(ignore_fn.fd)
prog_array[ct.c_int(79)] = ct.c_int(ignore_fn.fd)
prog_array[ct.c_int(98)] = ct.c_int(ignore_fn.fd)
prog_array[ct.c_int(101)] = ct.c_int(ignore_fn.fd)
prog_array[ct.c_int(115)] = ct.c_int(ignore_fn.fd)
prog_array[ct.c_int(131)] = ct.c_int(ignore_fn.fd)
prog_array[ct.c_int(134)] = ct.c_int(ignore_fn.fd)
prog_array[ct.c_int(135)] = ct.c_int(ignore_fn.fd)
prog_array[ct.c_int(139)] = ct.c_int(ignore_fn.fd)
prog_array[ct.c_int(172)] = ct.c_int(ignore_fn.fd)
prog_array[ct.c_int(233)] = ct.c_int(ignore_fn.fd)
prog_array[ct.c_int(280)] = ct.c_int(ignore_fn.fd)
prog_array[ct.c_int(291)] = ct.c_int(ignore_fn.fd)

b.trace_print()
위 code의 메인 eBPF program은 모든 syscall의 entry point 추적점에 attach되어있다. eBPF program은 특정 syscall opcode에 대한 message를 trace하기위해 tail calls을 사용한다. 만약 주어진 opcode에 대한 tail calls가 없다면 program이 generic message를 추적한다.
만약 BCC framework를 사용한다면 tail calls를 만들기위해 다음의 간단한 form을 사용할 수 있다.
prog_array_map.call(ctx, index)compile이전에 BCC는 위의 라인을 다음과 같이 변경해준다.
bpf_tail_call(ctx, prog_array_map, index)eBPF program source code를 살펴보고 tail calls를 어떻게 사용하고 있는 지 확인해보도록 하자.
BPF_PROG_ARRAY(syscall, 300);

int hello(struct bpf_raw_tracepoint_args *ctx) {
    int opcode = ctx->args[1];
    syscall.call(ctx, opcode);
    bpf_trace_printk("Another syscall: %d", opcode);
    return 0;
}

int hello_exec(void *ctx) {
    bpf_trace_printk("Executing a program");
    return 0;
}

int hello_timer(struct bpf_raw_tracepoint_args *ctx) {
    int opcode = ctx->args[1];
    switch (opcode) {
        case 222:
            bpf_trace_printk("Creating a timer");
            break;
        case 226:
            bpf_trace_printk("Deleting a timer");
            break;
        default:
            bpf_trace_printk("Some other timer operation");
            break;
    }
    return 0;
}

int ignore_opcode(void *ctx) {
    return 0;
}bcc는BPF_PROG_ARRAYmacro를 제공하여BPF_MAP_TYPE_PROG_ARRAYtype map을 정의하기 쉽게 해준다. 위의 예제에서는syscallmap을 만들고300의 entry로 구성하였다.- 아래에 보게될 user space code에서
helloeBPF 함수를sys_enter에 attach시키도록 한다. 이는sys_enterraw tracepoint에 등록하여 해당 syscall이 발생할 때마다helloeBPF함수를 실행시키겠다는 것이다.helloeBPF함수의 파라미터인bpf_raw_tracepoint_args는 raw tracepoint로 등록했을 때 받는 context정보인 것이다. sys_enter를 trace할 때 어떤 system call이 발생했는 지 알기위해서int opcode = ctx->args[1];로 opcode를 확인하는 것이다.syscall.call(ctx, opcode);이 바로opcode에 해당하는 eBPF program을 호출하는 부분이다. 해당 라인은bpf_tail_call()helper function으로 compiler에 의해 다시 쓰여지게 된다.- 만약 tail call이 성공하게되면
bpf_trace_printk("Another syscall: %d", opcode);이 line은 실행되지 않는다. 이전에도 말했지만tail_calls는execve처럼 물고 들어가는 call형식이지 stack처럼 함수가 실행되는 형식이 아니다. 이 line이 실행되는 경우는 오직map에opcode에 해당하는tail calls가 없을 때이다. hello_exec()은tail calls로 호출될 program으로 eBPF map에 저장될 program이다. 이는 mapping된 opcode가execve()syscall을 실행하면 해당 program이 실행되고, user space에게 log를 남기는 것이 전부이다.hello_timer는 eBPF map에 저장될 또 다른 program이다.ignore_opcode는 아무것도 하지 않는tail calls로 trace하고싶지않은 syscall에 대해서 이 함수를 사용하도록 한다.
eBPF program을 관리하고 적재하는 user space code를 살펴보도록 하자.
b = BPF(text=program)
b.attach_raw_tracepoint(tp="sys_enter", fn_name="hello")

ignore_fn = b.load_func("ignore_opcode", BPF.RAW_TRACEPOINT)
exec_fn = b.load_func("hello_exec", BPF.RAW_TRACEPOINT)
timer_fn = b.load_func("hello_timer", BPF.RAW_TRACEPOINT)

prog_array = b.get_table("syscall")
prog_array[ct.c_int(59)] = ct.c_int(exec_fn.fd)
prog_array[ct.c_int(222)] = ct.c_int(timer_fn.fd)
prog_array[ct.c_int(223)] = ct.c_int(timer_fn.fd)
prog_array[ct.c_int(224)] = ct.c_int(timer_fn.fd)
prog_array[ct.c_int(225)] = ct.c_int(timer_fn.fd)
prog_array[ct.c_int(226)] = ct.c_int(timer_fn.fd)

# Ignore some syscalls that come up a lot
prog_array[ct.c_int(21)] = ct.c_int(ignore_fn.fd)
prog_array[ct.c_int(22)] = ct.c_int(ignore_fn.fd)
...

b.trace_print()
b.attach_raw_tracepoint(tp="sys_enter", fn_name="hello")다음의 code는 eBPF program을 kprobe에 attach하는 것이 아니라sys_enter를 tracepoint로 attach하는 것이다.b.load_func()는 각tail callsprogram에 대한 file descriptor를 반환한다. 주의해야할 것은tail calls는 parent와 같은 program type을 가져야한다는 것이다. 여기서는BPF.RAW_TRACEPOINT이다. 또한, 각 tail call program은 그 자체로 eBPF program이라는 것이다.prog_array = b.get_table("syscall")는 user space code에서syscallmap에 entry를 만든다. 만약 해당하는tail calls가 없다면 아무것도 실행하지 안는다. 또한, 다른 key에 같은 eBPF program을 적재해도 상관없다.ignore_opcode()tail call을 사용해서 무시하고 싶은 syscall을 연결하였다.trace_print로 trace를 출력한다.
이제 program을 실행시켜보도록 하자.
./hello-tail.py
b'   hello-tail.py-2767    ... Another syscall: 62'
b'   hello-tail.py-2767    ... Another syscall: 62'
...
b'            bash-2626    ... Executing a program'
b'            bash-2626    ... Another syscall: 220'
...
b'           <...>-2774    ... Creating a timer'
b'           <...>-2774    ... Another syscall: 48'
b'           <...>-2774    ... Deleting a timer'
...
b'              ls-2774    ... Another syscall: 61'
b'              ls-2774    ... Another syscall: 61'
...
opcode에 맞게 tail call이 실행되는 것을 볼 수 있다.
tail calls는 kernel version 4.2부터 지원하기 시작했지만, BPF to BPF function call과는 compatible하지 못했다 이러한 제약은 kernel 5.10이 되어서야 해제되었다.