
kaggle OTT data들을 타입별로 나눠 시각화 하는 중에 movie와 show를 나눠 파이그래프로 나타내고 싶어 df['type'].value_counts로 타입별 갯수를 파악했다. 그리고 인덱스와 벨류값을 나눠서 저장하고 plt.pie로 넣어줬는데, 이런 오류를 만났다.
AttributeError: 'Series' object has no attribute 'value'`(Unsupported object type list).
시리즈 값은 벨류를 표현할 수 없다는데, 왜일까...!
🛠error 난 코드
###아마존
a_type_label = ama_tit['type'].value_counts(ascending=False, normalize=True).index
a_type_val = ama_tit['type'].value_counts(ascending=False, normalize=True).value
###디즈니
d_type_label = dis_tit['type'].value_counts(ascending=False, normalize=True).index
d_type_val = dis_tit['type'].value_counts(ascending=False, normalize=True).value
###넷플릭스
n_type_label = nex_tit['type'].value_counts(ascending=False, normalize=True).index
n_type_val = nex_tit['type'].value_counts(ascending=False, normalize=True).value
###파라마운트
p_type_label = par_tit['type'].value_counts(ascending=False, normalize=True).index
p_type_val = dis_tit['type'].value_counts(ascending=False, normalize=True).value

fig = plt.figure()

plt.title("Amazon Type")
plt.pie(a_type_val, labels=a_type_label)
plt.axis('equal')

plt.show
🧐error 이유 : 이미 value_counts로 index/value값으로 나눠진 상태
-
.value_counts의 결과로 이미 x_type_val이 vlue값을 가진 'Series' object이기에 그걸 또 value로 표현할 수 없는건 당연하다. -
왜 안되는 걸까?
: Pandes Series 객체란 인덱싱된 1차원 배열이다. 마치 딕셔너리의 key값이 index로, value값이 value로 들어간 것과 비슷한 모양이다. 정해준 index를 통해 value값을 불러올 수 있는것도 마찬가지다. value값을 부르기 위해선 index를 통해서 불러야지,.value를 통해서는 부를 수 없는 것 같다. -
플러스, Series에서 사용하는 메서드들
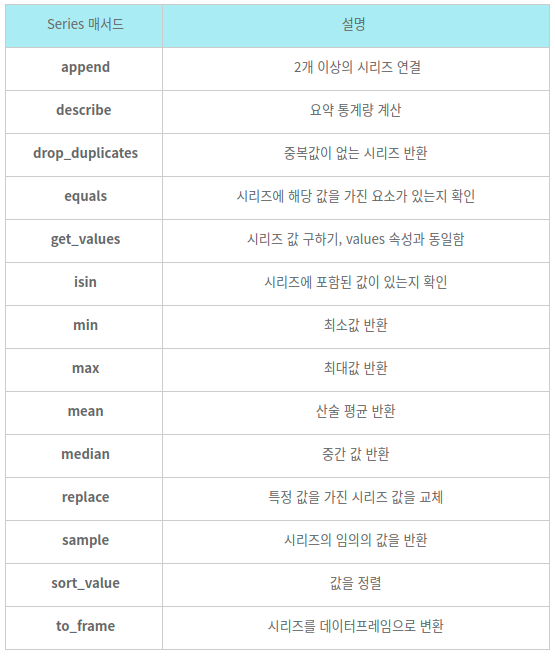
<출처 : 디지털 플레이 블로그>
🙌 해결 방법 : 뒤에 .value를 없애줌
###아마존
a_type_label = ama_tit['type'].value_counts(ascending=False, normalize=True).index
a_type_val = ama_tit['type'].value_counts(ascending=False, normalize=True)
###디즈니
d_type_label = dis_tit['type'].value_counts(ascending=False, normalize=True).index
d_type_val = dis_tit['type'].value_counts(ascending=False, normalize=True)
###넷플릭스
n_type_label = nex_tit['type'].value_counts(ascending=False, normalize=True).index
n_type_val = nex_tit['type'].value_counts(ascending=False, normalize=True)
###파라마운트
p_type_label = par_tit['type'].value_counts(ascending=False, normalize=True).index
p_type_val = dis_tit['type'].value_counts(ascending=False, normalize=True)

fig = plt.figure()

plt.title("Amazon Type")
plt.pie(a_type_val, labels=a_type_label)
plt.axis('equal')

plt.showama_tit['type'].value_counts(ascending=False, normalize=True)
> MOVIE 0.862527
> SHOW 0.137473
> Name: type, dtype: float64라벨로 불러올 자료는 value_counts에서 뒤에 .index로 index를 불러오고, 비율을 나타내는 value값은 이미 value_count 자체의 값이 value기 때문에 뒤에 적었던 .value를 지워준다.
Reference

차보의 Data Engineer 도전기♥ (근데 기록을 곁들인)