지난번에 ftrace에 대해 간략히 알아봤다. 이번 글에서는 ftrace의 cli front-end인 trace-cmd에 대해 간략히 알아보고 이를 응용해 Linux kernel 5.15 에서 프로세스의 생성, 스테줄링, 종료시 커널 내부에서 어떤 함수가 호출되는지 알아본다.
trace-cmd는 ftrace의 개발자인 Steven Rostedt가 개발하고 관리하고 있는 도구다. 확실히 ftrace가 의존하고 있는 tracefs를 직접 쓰는것보단 편하다. 그러나 내부적으로는 ftrace를 사용하므로 sudo 권한이 필요하다.
사용법은 직관적이다. man page의 SYNOPSIS를 보면 trace-cmd COMMAND [OPTIONS] 꼴로 되어있음을 볼 수 있다. 이번에 사용할 COMMAND들을 나열하면..
-
record: live trace를 trace.dat에 기록. start > trace.dat && stop과 동일
-
report: trace.dat을 읽어 사람이 읽을 수 있는 ASCII 형태로 변환
-
hist: trace.dat의 histogram 정보 조회
-
stat: 현재 시스템의 tracing 상태 조회
-
reset: 모든 tracing 비활성화
-
list: 사용가능한 plugin, event, option들을 나열
이외에도 hist, options, extract, split, ... 등이 있지만 필요하다면 다른 글에서 정리하겠다.
이어서 예제 코드를 보겠다.
dongho@dongho-arch:~
 $ cat playground/task_test.c
#include <stdio.h>
#include <unistd.h>

int main()
{
        while(1) {
                printf("test...\n");
                sleep(3);
        }

        return 0;
}
3초마다 'test...'를 출력하는 프로그램이다.
tracing을 진행할 시나리오는 다음과 같다.
- tracing 시작
- task_test 실행
- 10초간 대기
- task_test를 SIGINT로 종료
- tracing 종료
이번 tracing에서 무엇을 보고 싶은지도 중요하다. 일단 무엇을 볼 수 있는지 보자.
[root@dongho-arch dongho]# trace-cmd list -e | cut -d: -f1 | sort | uniq | paste - - - - - - -
alarmtimer	avc	block	bpf_test_run	bpf_trace	bridge	cfg80211
cgroup	clk	cma	compaction	cpuhp	cros_ec	dev
devfreq	devlink	dma_fence	drm	error_report	exceptions	ext4
fib	fib6	filelock	filemap	fs_dax	gpio	huge_memory
hwmon	hyperv	i2c	initcall	intel_iommu	interconnect	iocost
iomap	iommu	io_uring	irq	irq_matrix	irq_vectors	jbd2
kmem	kyber	libata	mce	migrate	mmap	mmap_lock
module	mptcp	msr	napi	neigh	net	netlink
nmi	nvme	oom	osnoise	page_isolation	pagemap	page_pool
percpu	power	printk	pwm	qdisc	random	ras
raw_syscalls	rcu	regmap	regulator	resctrl	rpm	rseq
rtc	sched	scsi	signal	skb	smbus	snd_pcm
sock	spi	swiotlb	syscalls	task	tcp	thermal
thermal_power_allocator	timer	tlb	udp	vmscan	vsock	vsyscall
wbt	workqueue	writeback	x86_fpu	xdp	xen	xhci-hcd
조회할 수 있는 이벤트는 전체 1698개로 모두 파악하긴 무리일것 같아 큰 카테고리만 조회해봤다. 여기서는 스케줄링과 인터럽트 tracing에 사용할 sched, signal 카테고리를 볼 수 있겠다. 조회할 이벤트들은 signal, sched_switch, sched_wakeup, sched_process_fork, sched_process_exit 이다. 추가로 task_rename도 추가해줘야 프로세스 생성시 fork -> exec 과정에서 자식 프로세스의 이름이 제대로 나오니 참고하자.
plugin(ftrace의 tracer)은 function_graph를 사용한다. 여기서 그냥 tracing을 진행하면 엄청나게 많은 로그가 단시간에 쌓이게 되니 필터링은 필수다. trace-cmd list -f ...로 어떤 함수들을 필터링 할 수 있는지 볼 수 있다. 프로세스의 생성과 종료 부분을 보고 싶으므로 kernel_clone(구 _do_fork)와 do_exit를 필터링 하겠다.
이 상태에서 tracing을 하면 아직도 로그가 너무 많이 쌓인다. trace-cmd hist로 살펴보면 로그의 절반 가량이 프로세스 스케줄링인 것을 볼 수 있었다. 아무런 플러그인도 없는 sh shell을 하나 새로 띄워 해당 프로세스 아래에서 일어나는 일만 tracing하게 했다. 그리고 function_graph의 depth를 3으로 제한하니 몇백줄 수준으로 어느정도 파악이 가능하게 됐다.
아래는 사용한 명령어고 75198은 sh의 pid다.
trace-cmd record -e signal -e sched_switch -e task_rename -p function_graph -g kernel_clone -g do_exit -P 75198 -c --max-graph-depth 3이렇게 수집한 로그는 trace-cmd report | vi -로 에디터에서 조회해 볼 수 있다.
먼저 헤더 부분을 살펴보면..
  1 CPU 0 is empty
  2 CPU 2 is empty
  3 CPU 3 is empty
  4 CPU 4 is empty
  5 CPU 6 is empty
  6 CPU 7 is empty
  7 cpus=8
  8   kworker/u256:3-73618 [005] 125043.469144: sched_switch:         prev_comm=kworker/u256:3 prev_pid=73618 prev_prio=120 prev_state=I ==> next_comm=sh next_pid=75198 next_prio=120
  9               sh-75198 [005] 125043.469207: sched_switch:         prev_comm=sh prev_pid=75198 prev_prio=120 prev_state=R+ ==> next_comm=kworker/u256:3 next_pid=73618 next_prio=120
 10   kworker/u256:3-73618 [005] 125043.469213: sched_switch:         prev_comm=kworker/u256:3 prev_pid=73618 prev_prio=120 prev_state=I ==> next_comm=sh next_pid=75198 next_prio=120
 11               sh-75198 [005] 125043.469229: sched_switch:         prev_comm=sh prev_pid=75198 prev_prio=120 prev_state=S ==> next_comm=swapper/5 next_pid=0 next_prio=120
 12   kworker/u256:3-73618 [005] 125044.293192: sched_switch:         prev_comm=kworker/u256:3 prev_pid=73618 prev_prio=120 prev_state=I ==> next_comm=sh next_pid=75198 next_prio=120
 13               sh-75198 [005] 125044.293230: sched_switch:         prev_comm=sh prev_pid=75198 prev_prio=120 prev_state=R+ ==> next_comm=kworker/u256:3 next_pid=73618 next_prio=120
 14   kworker/u256:3-73618 [005] 125044.293236: sched_switch:         prev_comm=kworker/u256:3 prev_pid=73618 prev_prio=120 prev_state=I ==> next_comm=sh next_pid=75198 next_prio=120
 15               sh-75198 [005] 125044.293251: sched_switch:         prev_comm=sh prev_pid=75198 prev_prio=120 prev_state=R+ ==> next_comm=kworker/u256:3 next_pid=73618 next_prio=120
 16   kworker/u256:3-73618 [005] 125044.293256: sched_switch:         prev_comm=kworker/u256:3 prev_pid=73618 prev_prio=120 prev_state=I ==> next_comm=sh next_pid=75198 next_prio=120
...
처음엔 sh와 kernel간 컨텍스트 스위칭이 계속 발생하는것을 볼 수 있다. PID 필터링이 없다면 sh <-> kernel 뿐만 아니라 수많은 컨텍스트 스위칭이 기록되었을 것이다.
이어서 쭉 보면..
...
 17               sh-75198 [005] 125044.293322: funcgraph_entry:                   |  kernel_clone() {
 18               sh-75198 [005] 125044.293322: funcgraph_entry:                   |    copy_process() {
 19               sh-75198 [005] 125044.293323: funcgraph_entry:        0.141 us   |      _raw_spin_lock_irq();
 20               sh-75198 [005] 125044.293323: funcgraph_entry:        0.148 us   |      recalc_sigpending();
 21               sh-75198 [005] 125044.293323: funcgraph_entry:        0.127 us   |      _raw_spin_unlock_irq();
 22               sh-75198 [005] 125044.293324: funcgraph_entry:        0.204 us   |      tsk_fork_get_node();
 23               sh-75198 [005] 125044.293324: funcgraph_entry:        3.957 us   |      kmem_cache_alloc_node();
 24               sh-75198 [005] 125044.293328: funcgraph_entry:      + 15.164 us  |      __vmalloc_node_range();
 25               sh-75198 [005] 125044.293344: funcgraph_entry:        0.402 us   |      find_vm_area();
 26               sh-75198 [005] 125044.293344: funcgraph_entry:        0.737 us   |      __memcg_kmem_charge_page();
 27               sh-75198 [005] 125044.293345: funcgraph_entry:        0.644 us   |      __memcg_kmem_charge_page();
...
 59               sh-75198 [005] 125044.293381: funcgraph_entry:        0.126 us   |      __mutex_init();
 60               sh-75198 [005] 125044.293381: funcgraph_entry:        0.129 us   |      __init_rwsem();
 61               sh-75198 [005] 125044.293382: funcgraph_entry:      ! 198.629 us |      dup_mm();
 62               sh-75198 [005] 125044.293581: funcgraph_entry:        0.442 us   |      copy_namespaces();
 63               sh-75198 [005] 125044.293581: funcgraph_entry:        0.568 us   |      copy_thread();
...
 85               sh-75198 [005] 125044.293611: funcgraph_entry:        0.156 us   |      uprobe_copy_process();
 86               sh-75198 [005] 125044.293612: funcgraph_exit:       ! 289.184 us |    }
 87               sh-75198 [005] 125044.293612: funcgraph_entry:        0.561 us   |    __traceiter_sched_process_fork();
 88               sh-75198 [005] 125044.293613: funcgraph_entry:                   |    get_task_pid() {
 89               sh-75198 [005] 125044.293613: funcgraph_entry:        0.130 us   |      __rcu_read_lock();
 90               sh-75198 [005] 125044.293613: funcgraph_entry:        0.147 us   |      __rcu_read_unlock();
 91               sh-75198 [005] 125044.293613: funcgraph_exit:         0.635 us   |    }
 92               sh-75198 [005] 125044.293613: funcgraph_entry:        0.143 us   |    pid_vnr();
 93               sh-75198 [005] 125044.293614: funcgraph_entry:                   |    wake_up_new_task() {
 94               sh-75198 [005] 125044.293614: funcgraph_entry:        0.130 us   |      _raw_spin_lock_irqsave();
...
102               sh-75198 [005] 125044.293620: funcgraph_entry:        0.410 us   |      __traceiter_sched_wakeup_new();
103               sh-75198 [005] 125044.293621: funcgraph_entry:      + 14.539 us  |      check_preempt_curr();
104               sh-75198 [005] 125044.293636: funcgraph_entry:        0.231 us   |      raw_spin_rq_unlock();
105               sh-75198 [005] 125044.293637: funcgraph_entry:        0.133 us   |      _raw_spin_unlock_irqrestore();
106               sh-75198 [005] 125044.293637: funcgraph_exit:       + 23.428 us  |    }
107               sh-75198 [005] 125044.293637: funcgraph_entry:                   |    put_pid() {
108               sh-75198 [005] 125044.293637: funcgraph_entry:        0.204 us   |      put_pid.part.0();
109               sh-75198 [005] 125044.293638: funcgraph_exit:         0.461 us   |    }
110               sh-75198 [005] 125044.293638: funcgraph_exit:       ! 315.951 us |  }
...
depth 3으로 제한했음에도 불구하고 프로세스 생성에 관한 로그만 100여줄이 나왔다.
...
139               sh-75198 [005] 125044.293813: sched_switch:         prev_comm=sh prev_pid=75198 prev_prio=120 prev_state=S ==> next_comm=trace-cmd next_pid=75670 next_prio=120
140        task_test-75673 [001] 125044.294414: task_rename:          pid=75673 oldcomm=sh newcomm=task_test oom_score_adj=0
141        task_test-75673 [001] 125044.295338: sched_switch:         prev_comm=task_test prev_pid=75673 prev_prio=120 prev_state=S ==> next_comm=swapper/1 next_pid=0 next_prio=120
142           <idle>-0     [001] 125047.295847: sched_switch:         prev_comm=swapper/1 prev_pid=0 prev_prio=120 prev_state=R ==> next_comm=task_test next_pid=75673 next_prio=120
143        task_test-75673 [001] 125047.296019: sched_switch:         prev_comm=task_test prev_pid=75673 prev_prio=120 prev_state=S ==> next_comm=swapper/1 next_pid=0 next_prio=120
144            <...>-434   [001] 125050.296544: sched_switch:         prev_comm=containerd prev_pid=434 prev_prio=120 prev_state=S ==> next_comm=task_test next_pid=75673 next_prio=120
145        task_test-75673 [001] 125050.296637: sched_switch:         prev_comm=task_test prev_pid=75673 prev_prio=120 prev_state=R+ ==> next_comm=kworker/u256:3 next_pid=73618 next_prio=120
146   kworker/u256:3-73618 [001] 125050.296735: sched_switch:         prev_comm=kworker/u256:3 prev_pid=73618 prev_prio=120 prev_state=I ==> next_comm=task_test next_pid=75673 next_prio=120
147        task_test-75673 [001] 125050.296768: sched_switch:         prev_comm=task_test prev_pid=75673 prev_prio=120 prev_state=R+ ==> next_comm=kworker/u256:3 next_pid=73618 next_prio=120
148   kworker/u256:3-73618 [001] 125050.296788: sched_switch:         prev_comm=kworker/u256:3 prev_pid=73618 prev_prio=120 prev_state=I ==> next_comm=task_test next_pid=75673 next_prio=120
149        task_test-75673 [001] 125050.296844: sched_switch:         prev_comm=task_test prev_pid=75673 prev_prio=120 prev_state=S ==> next_comm=swapper/1 next_pid=0 next_prio=120
150   kworker/u256:3-73618 [001] 125051.039194: sched_switch:         prev_comm=kworker/u256:3 prev_pid=73618 prev_prio=120 prev_state=I ==> next_comm=task_test next_pid=75673 next_prio=120
...sh에서 task_test를 실행시켰기 때문에 task_rename 이벤트에서 비로소 이름이 제대로 나오는것을 볼 수 있다. 그 이후엔 다시 쭉 sched_switch 이벤트만 보인다. 보면 크게 3초 간격으로 스위칭이 되는것을 볼 수 있는데 sleep(3) 때문일것으로 보인다. sleep이 CPU를 명시적으로 양보하는지는 나중에 다른 글에서 다뤄보면 좋을 주제 같다.
151        task_test-75673 [001] 125051.039219: signal_deliver:       sig=9 errno=0 code=0 sa_handler=0 sa_flags=0
152        task_test-75673 [001] 125051.039221: funcgraph_entry:                   |  do_exit() {
153        task_test-75673 [001] 125051.039223: funcgraph_entry:                   |    profile_task_exit() {
154        task_test-75673 [001] 125051.039223: funcgraph_entry:        0.878 us   |      blocking_notifier_call_chain();
155        task_test-75673 [001] 125051.039225: funcgraph_exit:         2.338 us   |    }
156        task_test-75673 [001] 125051.039226: funcgraph_entry:                   |    exit_signals() {
157        task_test-75673 [001] 125051.039226: funcgraph_entry:        0.534 us   |      __percpu_down_read();
158        task_test-75673 [001] 125051.039228: funcgraph_entry:        1.120 us   |      rcuwait_wake_up();
159        task_test-75673 [001] 125051.039229: funcgraph_exit:         3.732 us   |    }
...
209        task_test-75673 [001] 125051.040240: funcgraph_entry:        0.589 us   |    exit_sem();
210        task_test-75673 [001] 125051.040241: funcgraph_entry:                   |    exit_shm() {
211        task_test-75673 [001] 125051.040242: funcgraph_entry:        0.535 us   |      _raw_spin_lock();
212        task_test-75673 [001] 125051.040243: funcgraph_entry:        0.482 us   |      _raw_spin_unlock();
213        task_test-75673 [001] 125051.040244: funcgraph_exit:         2.543 us   |    }
214        task_test-75673 [001] 125051.040244: funcgraph_entry:                   |    exit_files() {
215        task_test-75673 [001] 125051.040245: funcgraph_entry:        0.495 us   |      _raw_spin_lock();
216        task_test-75673 [001] 125051.040246: funcgraph_entry:        0.484 us   |      _raw_spin_unlock();
217        task_test-75673 [001] 125051.040247: funcgraph_entry:      + 18.093 us  |      put_files_struct();
218        task_test-75673 [001] 125051.040265: funcgraph_exit:       + 20.936 us  |    }
219        task_test-75673 [001] 125051.040266: funcgraph_entry:                   |    exit_fs() {
...
227        task_test-75673 [001] 125051.040280: funcgraph_exit:       + 14.296 us  |    }
...
248        task_test-75673 [001] 125051.040316: funcgraph_entry:                   |    sched_autogroup_exit_task() {
249        task_test-75673 [001] 125051.040316: funcgraph_entry:      + 30.906 us  |      sched_move_task();
...
271        task_test-75673 [001] 125051.040370: funcgraph_entry:                   |    do_notify_parent() {
...
285        task_test-75673 [001] 125051.040387: funcgraph_entry:                   |      __send_signal() {
286        task_test-75673 [001] 125051.040392: signal_generate:      sig=17 errno=0 code=2 comm=sh pid=75198 grp=1 res=0
287        task_test-75673 [001] 125051.040393: funcgraph_exit:         5.783 us   |      }
288        task_test-75673 [001] 125051.040394: funcgraph_entry:      + 53.095 us  |      __wake_up_parent();
289        task_test-75673 [001] 125051.040449: funcgraph_entry:        0.610 us   |      _raw_spin_unlock_irqrestore();
290        task_test-75673 [001] 125051.040450: funcgraph_exit:       + 79.320 us  |    }
...
296        task_test-75673 [001] 125051.040456: funcgraph_exit:         2.617 us   |    }
297        task_test-75673 [001] 125051.040457: funcgraph_entry:        0.469 us   |    exit_rcu();
298        task_test-75673 [001] 125051.040458: funcgraph_entry:                   |    exit_tasks_rcu_finish() {
299        task_test-75673 [001] 125051.040458: funcgraph_entry:        0.605 us   |      __srcu_read_unlock();
300        task_test-75673 [001] 125051.040460: funcgraph_exit:         1.585 us   |    }
301        task_test-75673 [001] 125051.040460: funcgraph_entry:                   |    do_task_dead() {
...
프로세스 종료시엔 로그가 150여줄 남았다. signal event를 보면 재밌는걸 볼 수 있는데 signal 넘버가 처음엔 9, 두번째엔 17인것을 볼 수 있다.
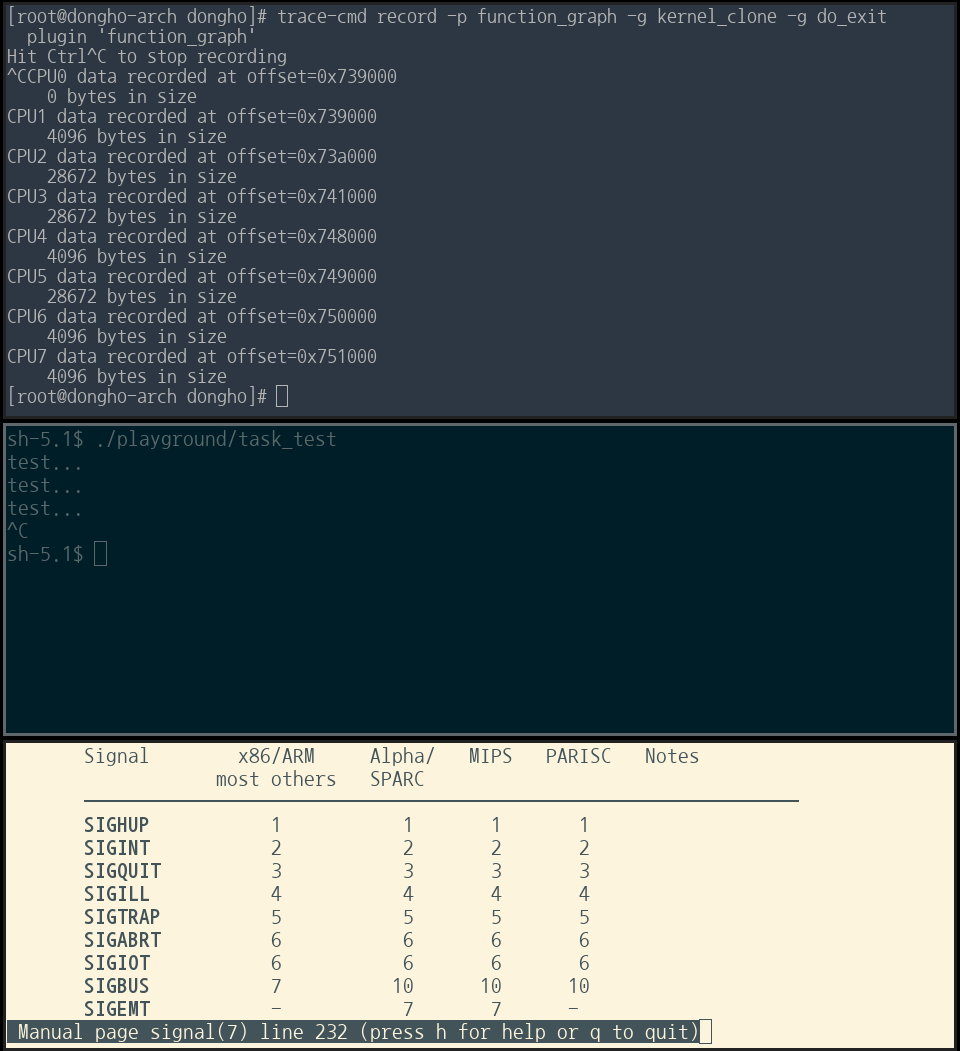
signal(7)의 Signal numbering for standard signals 섹션에서 아키텍처별 표준 signal 넘버링을 확인해보면 x86에서 9=SIGKILL, 17=SIGCHLD 이다. sh의 자식 프로세스인 task_test가 종료될 때 부모에게 SIGCHLD 신호를 보내는건 이해가 된다. 그런데 왜 2=SIGINT를 보냈는데 9=SIGKILL만 보이는걸까? signal 이벤트만 남겨서 다시 필터링 해보면
  8   kworker/u256:2-80813 [006] 139012.904507: signal_generate:      sig=2 errno=0 code=128 comm=task_test pid=81401 grp=1 res=0
  9        task_test-81401 [006] 139012.904542: signal_deliver:       sig=9 errno=0 code=0 sa_handler=0 sa_flags=0
 10        task_test-81401 [006] 139012.904608: signal_generate:      sig=17 errno=0 code=2 comm=sh pid=75198 grp=1 res=0
와 같은 깔끔한 로그를 다시 얻을 수 있다. 처음엔 SIGINT로 잘 들어왔으나 해당 프로세스에 제어권이 넘어가면 중간에 SIGKILL로 변하는 것으로 보인다.
한번 trace-cmd를 사용해 프로세스의 생성과 스케줄링 그리고 종료 과정을 살펴봤다. 위에선 많은 부분 생략했지만, 아래 명령어로 depth 제한없이 모든 함수 호출을 로깅하면
trace-cmd record -p function_graph -g kernel_clone -g do_exit
단순히 프로세스를 실행 시키고 종료시키는데만도 각각 함수 호출이 4000여개, 7000여개가 기록되었다. 내가 커널 개발을 할거라면 각각의 모든 함수들을 다 파악해보면 좋겠지만.. 아쉽게도 그럴 여유는 없을 것 같다. 계속 공부하다보면 자연스레 알게될 것이라 기대한다.