📌 서울시 유동 인구 데이터 사용하기 - 리스트 페이지 만들기
하드코딩
import React, { Component } from 'react';

class floatingPopulationList extends Component {
    render () {
        return (
            <section class="sub_wrap" >
                <article class="s_cnt mp_pro_li ct1 mp_pro_li_admin">
                    <div class="li_top">
                        <h2 class="s_tit1">서울시 유동인구 데이터 - 19년 11월</h2>
                    </div>
                    <div class="list_cont list_cont_admin">
                        <table class="table_ty1 fp_tlist">
                            <tr>
                                <th>Row</th>
                                <th>일자</th>
                                <th>시간</th>
                                <th>연령대</th>
                                <th>성별</th>
                                <th>시</th>
                                <th>군구</th>
                                <th>유동인구수</th>
                            </tr>
                        </table>
                        <table class="table_ty2 fp_tlist">
                            <tr class="hidden_type">
                                <td>1</td>
                                <td>20191101</td>
                                <td>00</td>
                                <td>40</td>
                                <td>여성</td>
                                <td>서울</td>
                                <td>영등포구</td>
                                <td>32670</td>
                            </tr>
                            <tr class="hidden_type">
                                <td>1</td>
                                <td>20191101</td>
                                <td>00</td>
                                <td>50</td>
                                <td>남성</td>
                                <td>서울</td>
                                <td>구로구</td>
                                <td>27888</td>
                            </tr>
                        </table>
                    </div>
                </article>
            </section>
        );
    }
}

export default floatingPopulationList;
📌 서울시 유동 인구 데이터 사용하기 - axios로 api 호출하기
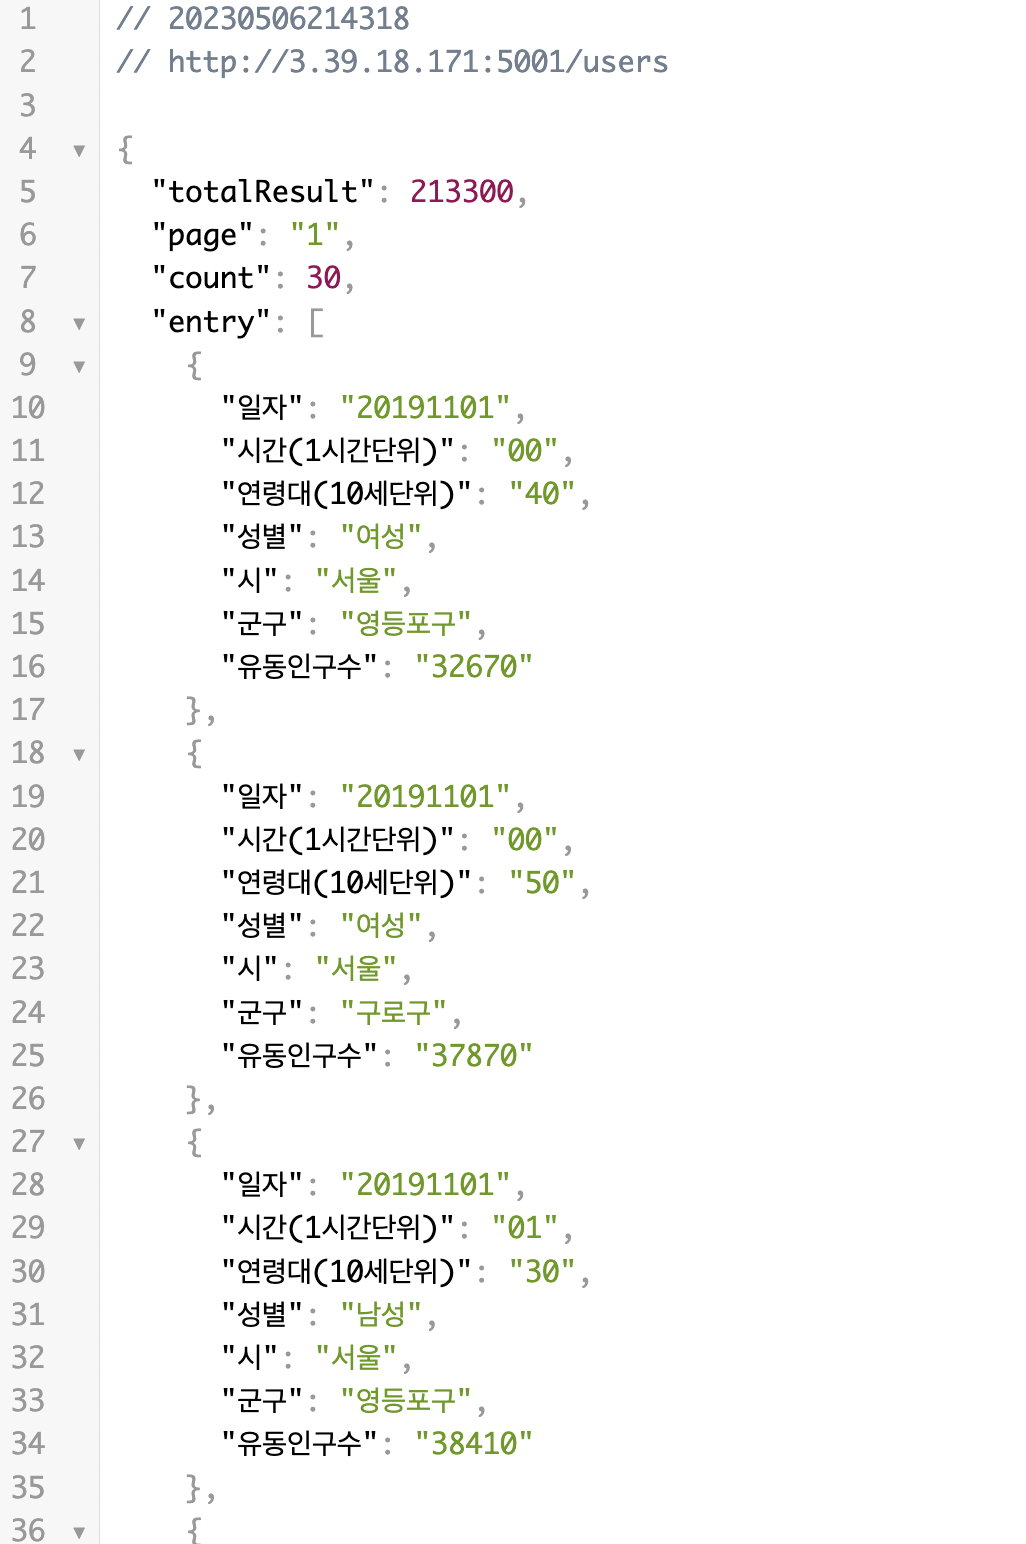
axios의 get 메소드를 이용해 아래 주소에 있는 데이터를 가져온다.
import React, { Component } from "react";
import axios from "axios";

class floatingPopulationList extends Component {
  constructor(props) {
    super(props);

    this.state = {
      responseFPList: "", // response 저장할 state
      append_FPList: "", // 데이터 가공해서 담을 state
    };
  }

  componentDidMount() {
    this.callFloatPopulListApi();
  }

  // axios로 데이터 get해서 state에 저장
  callFloatPopulListApi = async () => {
    axios
      .get("http://3.39.18.171:5001/users", {})
      .then((response) => {
        try {
          this.setState({ responseFPList: response });
          this.setState({ append_FPList: this.FloatPopulListAppend() });
        } catch (error) {
          alert(error);
        }
      })
      .catch((error) => {
        alert(error);
        return false;
      });
  };

  // 데이터 가공(불필요한 문자 제거), 반복문으로 하나씩 result(빈 배열)에 push
  FloatPopulListAppend = () => {
    let result = [];
    var FPList = this.state.responseFPList.data;
    var jsonString = JSON.stringify(FPList);
    jsonString = jsonString.replace(/\(1시간단위\)/g, "");
    jsonString = jsonString.replace(/\(10세단위\)/g, "");
    var json = JSON.parse(jsonString);

    for (let i = 0; i < json.entry.length; i++) {
      var data = json.entry[i];
      var idx = i + 1;
      result.push(
        <tr class="hidden_type">
          <td>{idx}</td>
          <td>{data.일자}</td>
          <td>{data.시간}</td>
          <td>{data.연령대}</td>
          <td>{data.성별}</td>
          <td>{data.시}</td>
          <td>{data.군구}</td>
          <td>{data.유동인구수}</td>
        </tr>
      );
    }
    return result;
  };

  render() {
    return (
      <section class="sub_wrap">
        <article class="s_cnt mp_pro_li ct1 mp_pro_li_admin">
          <div class="li_top">
            <h2 class="s_tit1">서울시 유동인구 데이터 - 19년 11월</h2>
          </div>
          <div class="list_cont list_cont_admin">
            <table class="table_ty1 fp_tlist">
              <tr>
                <th>Row</th>
                <th>일자</th>
                <th>시간</th>
                <th>연령대</th>
                <th>성별</th>
                <th>시</th>
                <th>군구</th>
                <th>유동인구수</th>
              </tr>
            </table>
            <table class="table_ty2 fp_tlist">{this.state.append_FPList}</table>
          </div>
        </article>
      </section>
    );
  }
}
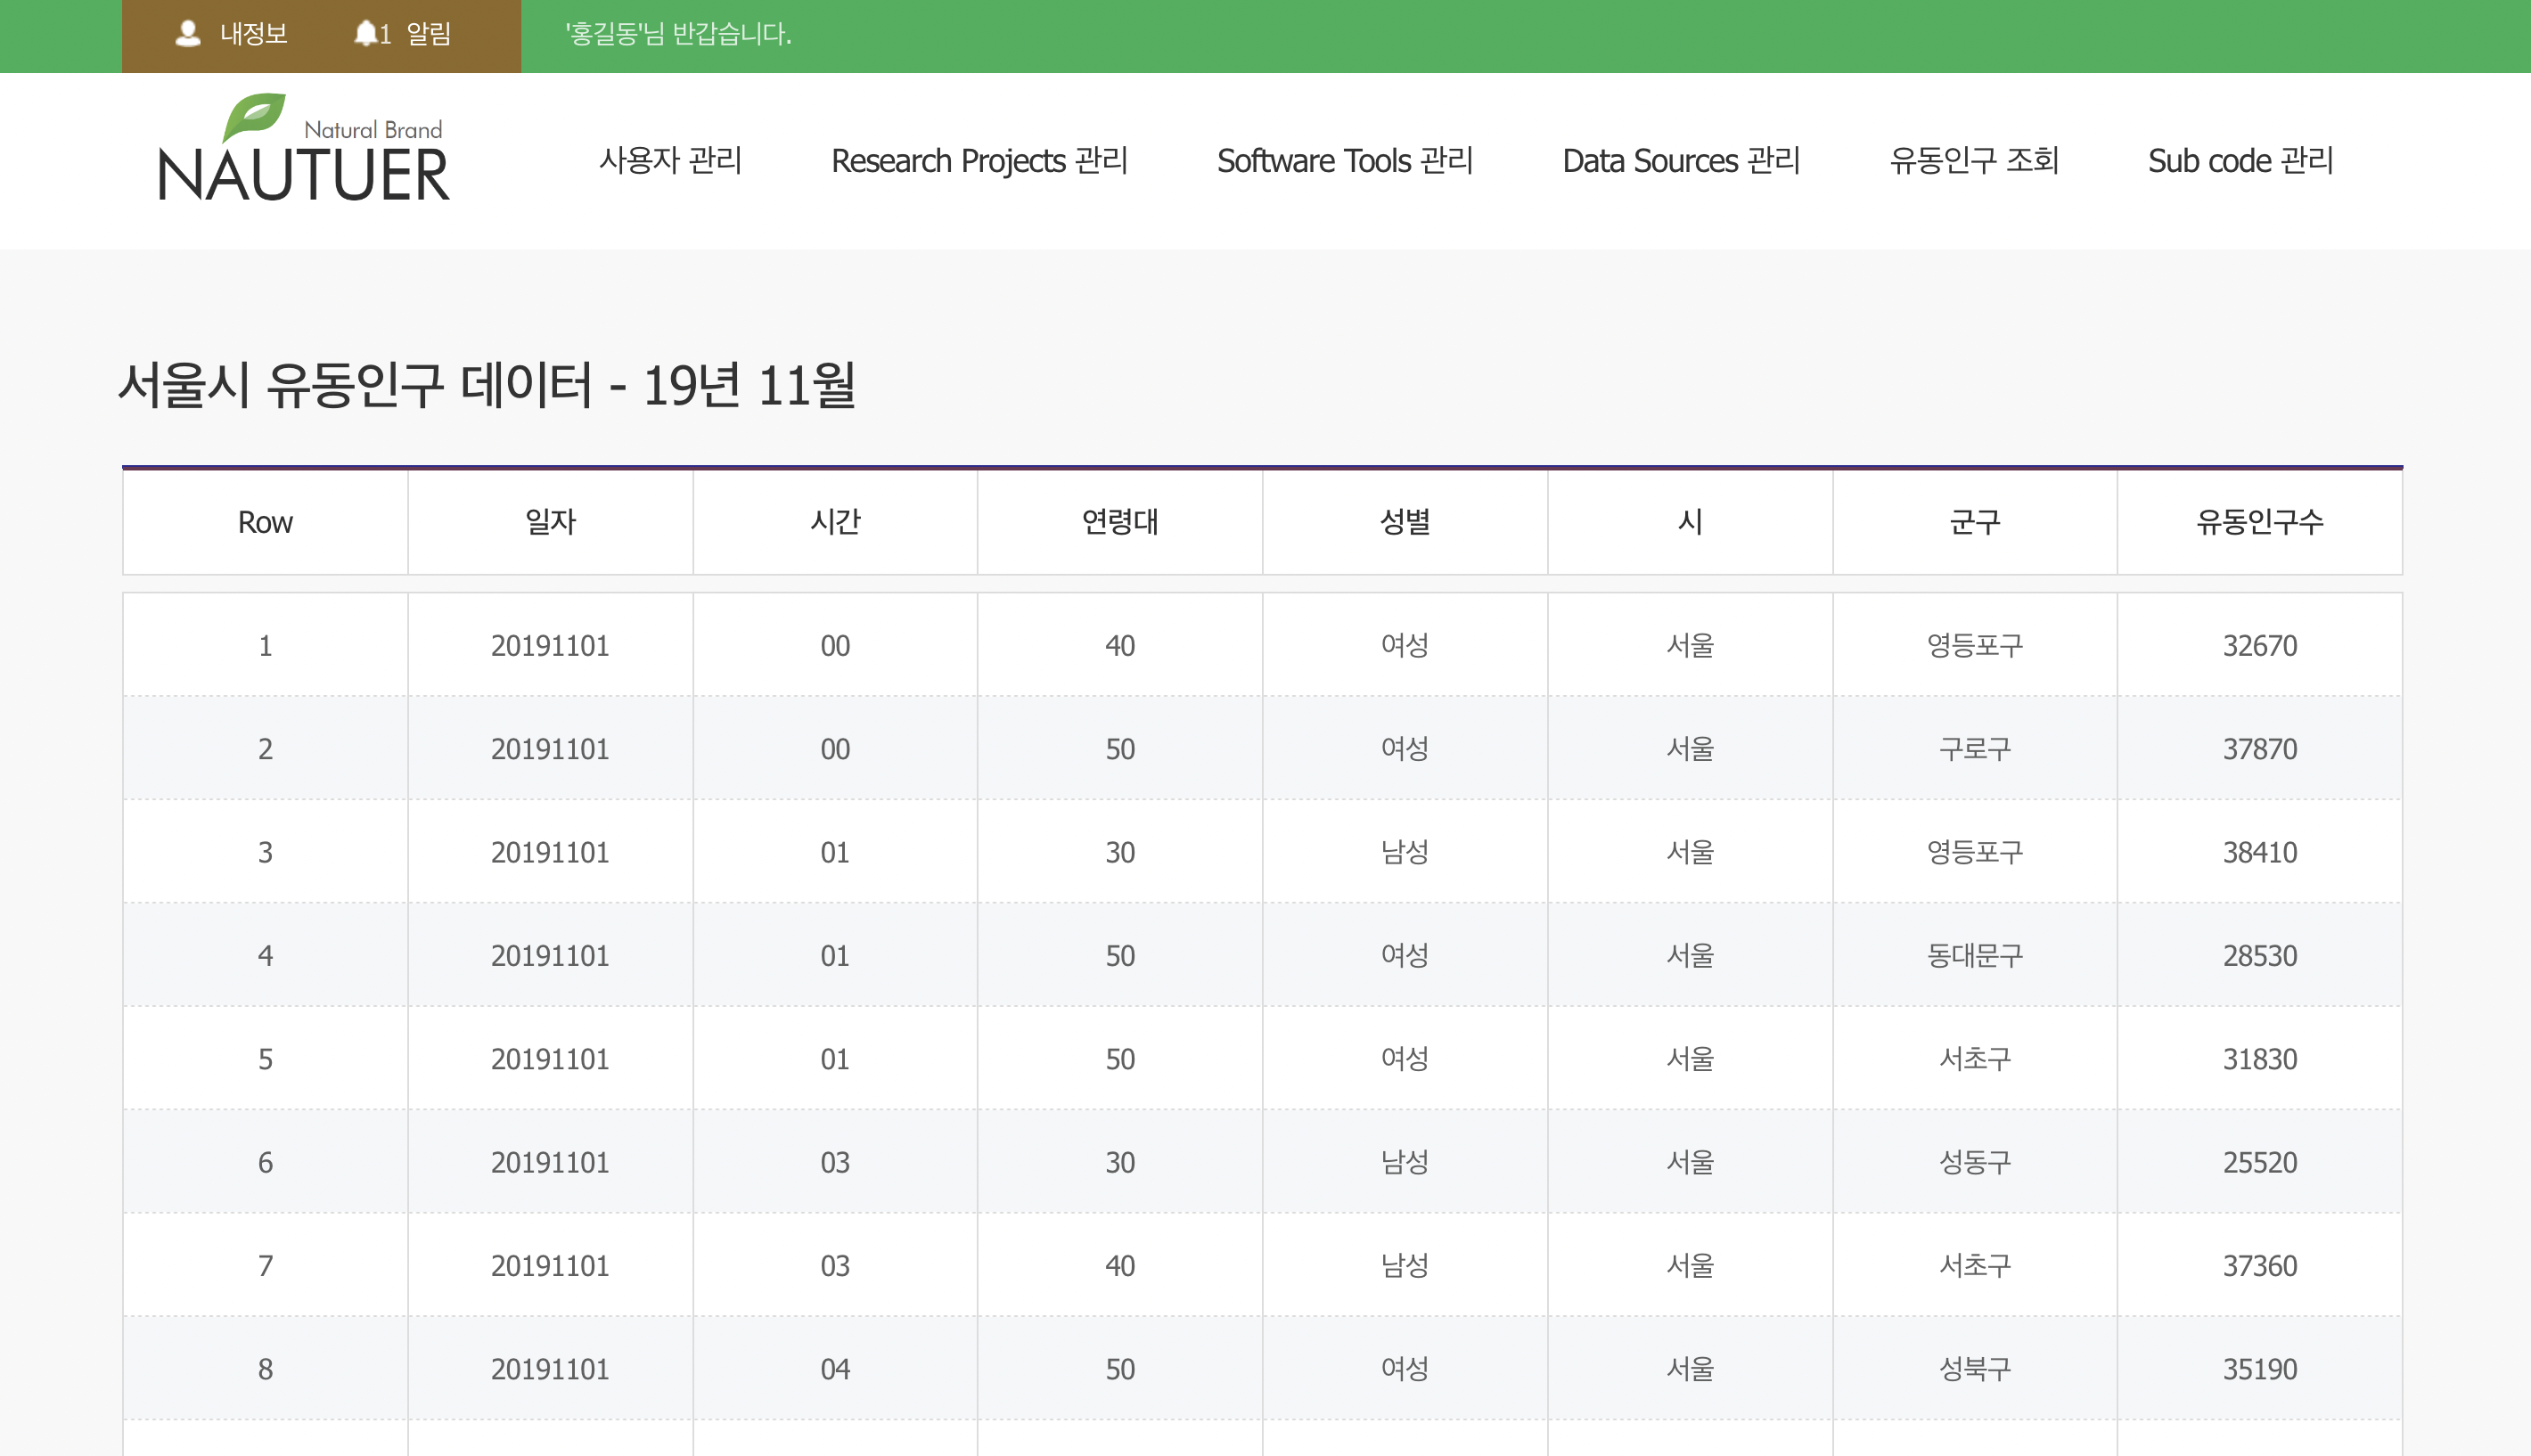
export default floatingPopulationList;- 다음과 같은 결과가 나온다.
📌 recharts로 LineChart 구현하기
recharts 패키지는 react에서 간편하게 다양한 형태의 chart를 구현할 수 있도록 api를 제공한다.
설치
npm install --save recharts예제
- LineChart : 화면에 표시할 차트 영역의 가로 길이, 세로 길이, 데이터, margin 값 할당
- CartesianGrid : 차트 내부에 표시되는 격자선 간격을 조정할 수 있다.
- XAxis : X축에 사용할 데이터의 key 값 지정
- Tooltip : 마우스가 차트로 이동했을 때 이동한 좌표의 데이터를 화면에 나타낸다.
- Legend : 차트 하단 범례를 영역에 표시한다.
- Line : Y축에 표현될 데이터 key 값과 라인색을 지정한다.
import React, { PureComponent } from 'react';
import {
  LineChart, Line, XAxis, YAxis, CartesianGrid, Tooltip, Legend,
} from 'recharts';

const data = [
  { 군구: '광진구', 유동인구수: 32760, 비유동인구수: 34000 },
  { 군구: '동대문구', 유동인구수: 30480, 비유동인구수: 56000 },
  { 군구: '마포구', 유동인구수: 27250, 비유동인구수: 23000 },
  { 군구: '구로구', 유동인구수: 49870, 비유동인구수: 67000 },
  { 군구: '강남구', 유동인구수: 51420, 비유동인구수: 55000 },
];

export default class rechartsSimpleLineChart extends PureComponent {
  static jsfiddleUrl = 'https://jsfiddle.net/alidingling/xqjtetw0/';

  render() {
    return (
      <LineChart
        width={1000}
        height={300}
        data={data}
        margin={{ top: 5, right: 30, left: 20, bottom: 5 }}
      >
        <CartesianGrid strokeDasharray="3 3" />
        <XAxis dataKey="군구" /><YAxis />
        <Tooltip />
        <Legend />
        <Line type="monotone" dataKey="유동인구수" stroke="#8884d8" activeDot={{ r: 8 }} />
        <Line type="monotone" dataKey="비유동인구수" stroke="#82ca9d" />
      </LineChart>
    );
  }
}-
아래와 같은 결과가 나온다.
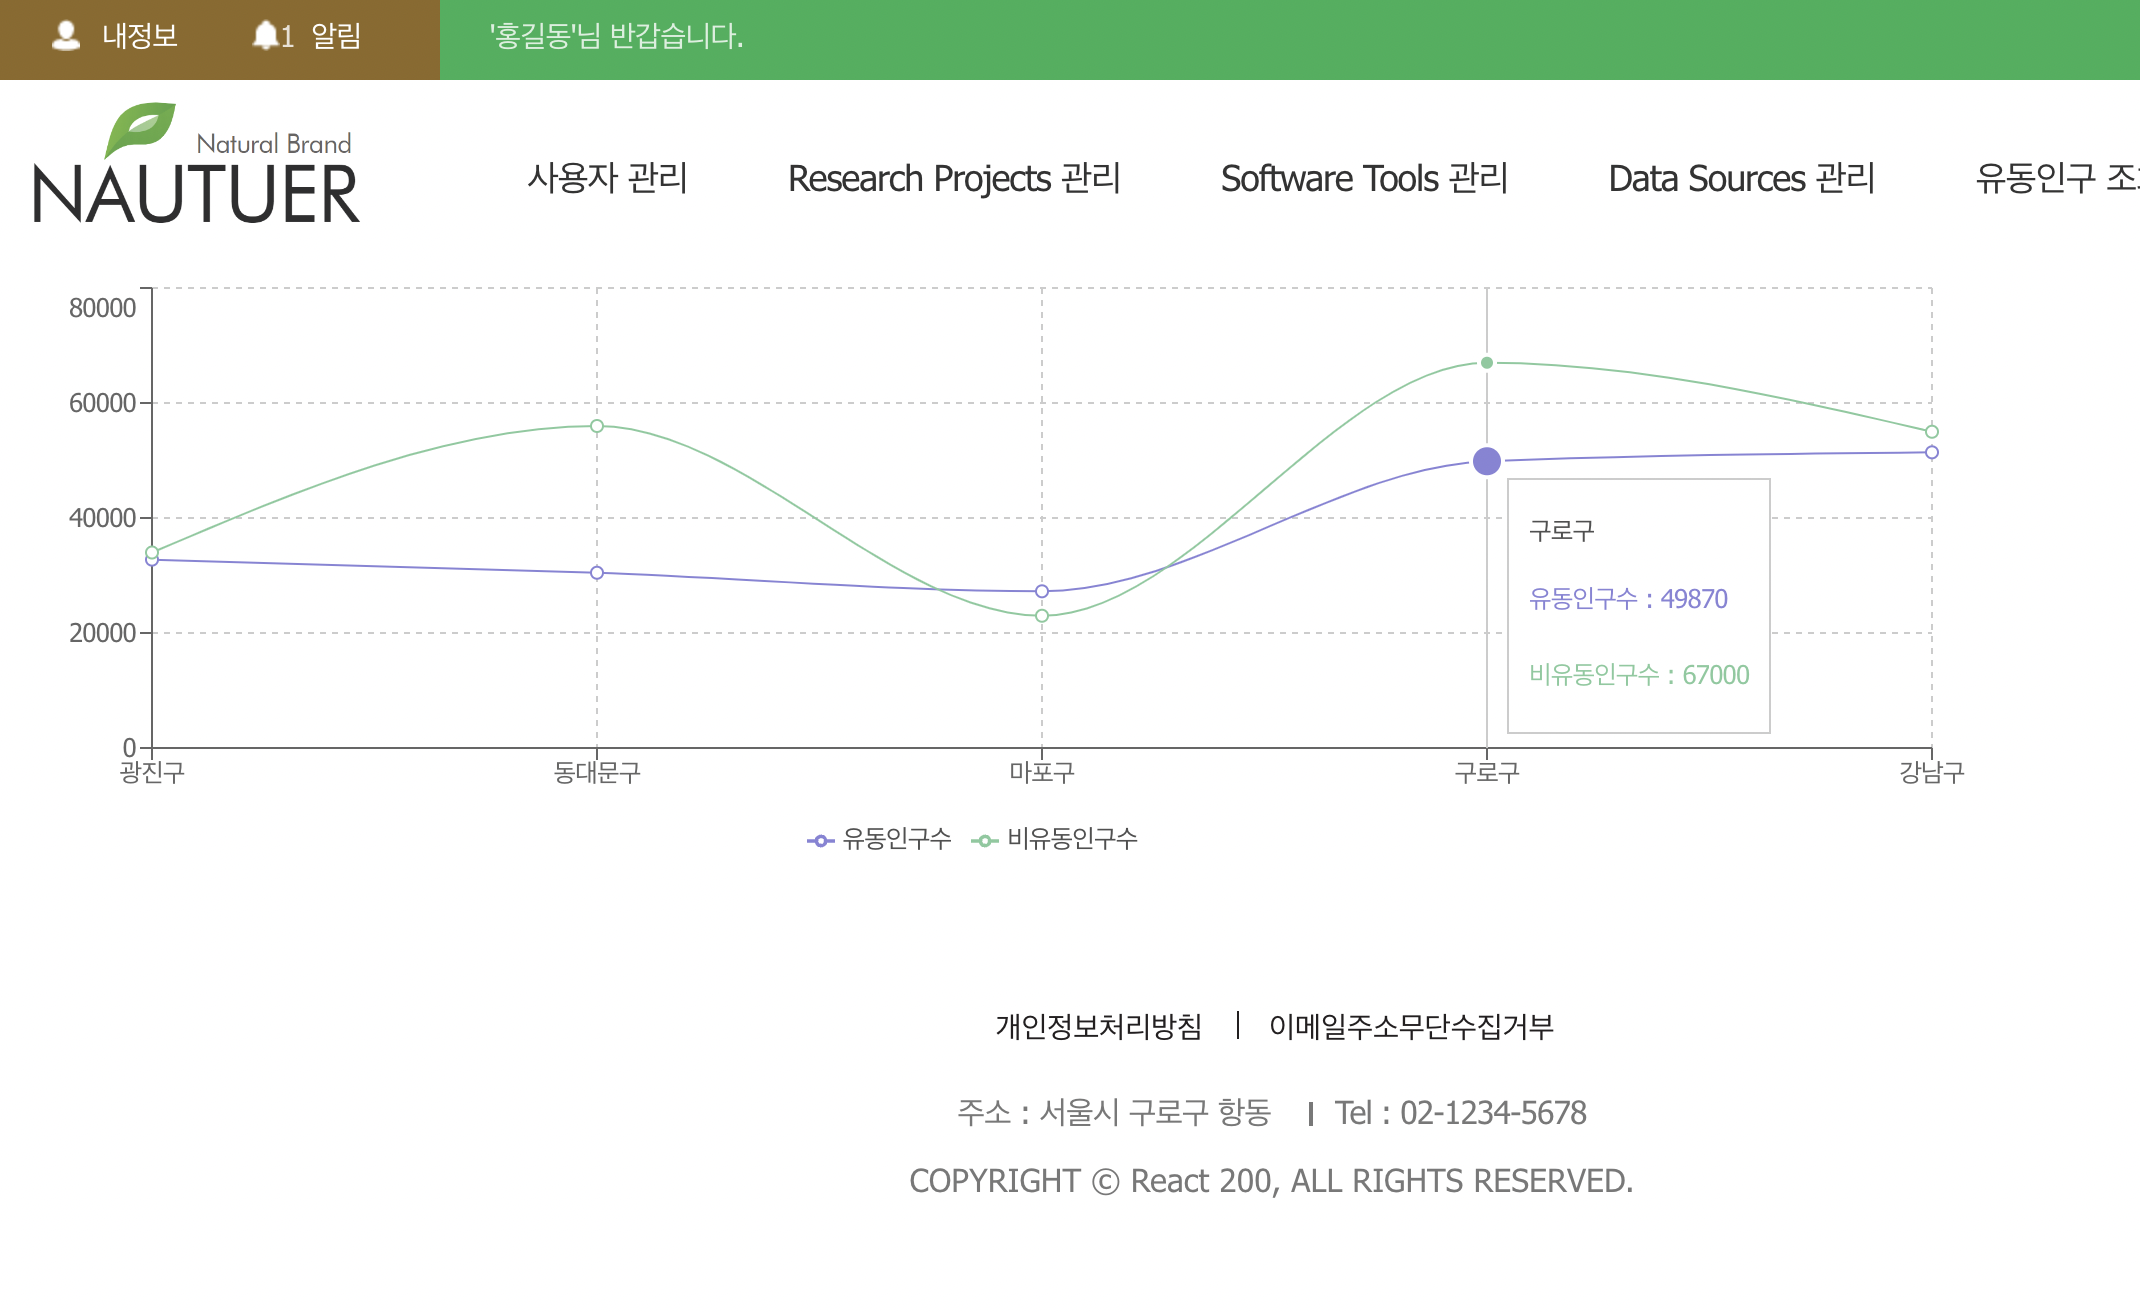
-
LineChart 외에도 AreaChart, BarChart, ComposedChart, ScatterChart 등을 만들 수 있다.

모든게 새롭고 재밌는 프론트엔드 새싹