K8s에서 Prometheus를 설치하기 위한 방법으로는 YAML로 설치하는 방법과 Operator를 사용하는 방법이 있습니다.
이번 편에서는 YAML을 사용해서 수동 설치하는 방법을 사용할 예정입니다.
💡참고 : 본 실습은 KANS 스터디 3주차 환경에서 진행하였습니다.
1. Calico Metric 수집을 위한 사전설정
Configure Calico to enable metrics reporting
Felix prometheus metrics 활성화
calicoctl patch명령으로prometheusMetricsEnabled": true활성화 설정합니다.
🌱 일반적인 모니터링 솔루션은 push 방식인데, prometheus 는 pull 방식을 사용합니다.
따라서 calico metric을 expose하기 위해prometheusMetricsEnabled": true활성화 설정합니다.
calicoctl patch felixConfiguration default --patch '{"spec":{"prometheusMetricsEnabled": true}}'- 확인
calicoctl get felixConfiguration default -o yamlapiVersion: projectcalico.org/v3
kind: FelixConfiguration
metadata:
creationTimestamp: "2022-01-23T11:30:58Z"
name: default
resourceVersion: "34942"
uid: 406fd34e-370d-4022-892a-cc416f018429
spec:
bpfLogLevel: ""
ipipEnabled: true
logSeverityScreen: Info
prometheusMetricsEnabled: true
reportingInterval: 0s- Creating a service to expose Felix metrics
kubectl apply -f - <<EOF
apiVersion: v1
kind: Service
metadata:
  name: felix-metrics-svc
  namespace: kube-system
spec:
  selector:
    k8s-app: calico-node
  ports:
  - port: 9091
    targetPort: 9091
EOF- 확인
kubectl get svc -n kube-system felix-metrics-svcNAME TYPE CLUSTER-IP EXTERNAL-IP PORT(S) AGE
felix-metrics-svc ClusterIP 10.98.193.230 <none> 9091/TCP 30s- 확인
calicoctl get kubecontrollersconfiguration default -o yamlapiVersion: projectcalico.org/v3
kind: KubeControllersConfiguration
metadata:
creationTimestamp: "2022-01-23T11:31:19Z"
name: default
resourceVersion: "799"
uid: 34edee4a-d9ba-4eba-9311-0f2bf746fdc9
spec:
controllers:
namespace:
reconcilerPeriod: 5m0s
node:
leakGracePeriod: 15m0s
reconcilerPeriod: 5m0s
syncLabels: Enabled
policy:
reconcilerPeriod: 5m0s
serviceAccount:
reconcilerPeriod: 5m0s
workloadEndpoint:
reconcilerPeriod: 5m0s
etcdV3CompactionPeriod: 10m0s
healthChecks: Enabled
logSeverityScreen: Info
prometheusMetricsPort: 9094 #🌱요거 확인
status:
environmentVars:
DATASTORE_TYPE: kubernetes
ENABLED_CONTROLLERS: node
runningConfig:
controllers:
node:
hostEndpoint:
autoCreate: Disabled
leakGracePeriod: 15m0s
syncLabels: Disabled
etcdV3CompactionPeriod: 10m0s
healthChecks: Enabled
logSeverityScreen: InfoCreating a service to expose kube-controllers metrics
- Metrics 값을 Expose하기 위한 Service를 생성합니다.
kubectl apply -f - <<EOF
apiVersion: v1
kind: Service
metadata:
  name: kube-controllers-metrics-svc
  namespace: kube-system
spec:
  selector:
    k8s-app: calico-kube-controllers
  ports:
  - port: 9094 #🌱얘가 위에 prometheusMetricsPort port와 같아요!
    targetPort: 9094
EOF
🌱 도입부에 언급한 것 처럼 일반적인 모니터링 솔루션은 push 방식인데, prometheus 는 pull 방식을 사용합니다.
- 확인
kubectl get svc -n kube-system kube-controllers-metrics-svcNAME TYPE CLUSTER-IP EXTERNAL-IP PORT(S) AGE
kube-controllers-metrics-svc ClusterIP 10.108.6.131 <none> 9094/TCP 11m2. 모니터링 준비사항(preparation)
calico 모니터링을 위한 네임스페이스 생성 : role(monitoring)을 지정합니다.
- Namespace 생성
kubectl apply -f -<<EOF
apiVersion: v1
kind: Namespace
metadata:
  name: calico-monitoring
  labels:
    app:  ns-calico-monitoring
    role: monitoring
EOF- Namespace 생성을 확인합니다.
kubectl describe ns calico-monitoringName: calico-monitoring
Labels: app=ns-calico-monitoring
kubernetes.io/metadata.name=calico-monitoring
role=monitoring
Annotations: <none>
Status: Active
No resource quota.
No LimitRange resource.잘 있구나...
SA(Service Account) 생성
- SA, CR, CRB 를 생성 합니다.
kubectl apply -f - <<EOF
apiVersion: rbac.authorization.k8s.io/v1
kind: ClusterRole
metadata:
  name: calico-prometheus-user
rules:
- apiGroups: [""]
  resources:
  - endpoints
  - services
  - pods
  verbs: ["get", "list", "watch"]
- nonResourceURLs: ["/metrics"]
  verbs: ["get"]
---
apiVersion: v1
kind: ServiceAccount
metadata:
  name: calico-prometheus-user
  namespace: calico-monitoring
---
apiVersion: rbac.authorization.k8s.io/v1
kind: ClusterRoleBinding
metadata:
  name: calico-prometheus-user
roleRef:
  apiGroup: rbac.authorization.k8s.io
  kind: ClusterRole
  name: calico-prometheus-user
subjects:
- kind: ServiceAccount
  name: calico-prometheus-user
  namespace: calico-monitoring
EOF- 생성 확인
kubectl get sa,ClusterRole,ClusterRoleBinding calico-prometheus-user -n calico-monitoringNAME SECRETS AGE
serviceaccount/calico-prometheus-user 1 12m
NAME CREATED AT
clusterrole.rbac.authorization.k8s.io/calico-prometheus-user 2022-02-06T04:15:27Z
NAME ROLE AGE
clusterrolebinding.rbac.authorization.k8s.io/calico-prometheus-user ClusterRole/calico-prometheus-user 12m잘 있구나...
💡 참고 : SA, Role, Cluster Role [링크[https://v1-21.docs.kubernetes.io/docs/reference/access-authn-authz/rbac/)
3. Prometheus 설치
Create prometheus config file
- configMap을 배포합니다.
kubectl apply -f - <<EOF
apiVersion: v1
kind: ConfigMap
metadata:
  name: prometheus-config
  namespace: calico-monitoring
data:
  prometheus.yml: |-
    global:
      scrape_interval:   15s
      external_labels:
        monitor: 'tutorial-monitor'
    scrape_configs:
    - job_name: 'prometheus'
      scrape_interval: 5s
      static_configs:
      - targets: ['localhost:9090']
    - job_name: 'felix_metrics'
      scrape_interval: 5s
      scheme: http
      kubernetes_sd_configs:
      - role: endpoints
      relabel_configs:
      - source_labels: [__meta_kubernetes_service_name]
        regex: felix-metrics-svc
        replacement: $1
        action: keep
    - job_name: 'typha_metrics'
      scrape_interval: 5s
      scheme: http
      kubernetes_sd_configs:
      - role: endpoints
      relabel_configs:
      - source_labels: [__meta_kubernetes_service_name]
        regex: typha-metrics-svc
        replacement: $1
        action: keep
    - job_name: 'kube_controllers_metrics'
      scrape_interval: 5s
      scheme: http
      kubernetes_sd_configs:
      - role: endpoints
      relabel_configs:
      - source_labels: [__meta_kubernetes_service_name]
        regex: kube-controllers-metrics-svc
        replacement: $1
        action: keep
EOF
🌱 configMap이란?
컨피그맵은 키-값 쌍으로 기밀이 아닌 데이터를 저장하는 데 사용하는 API 오브젝트입니다. 파드는 볼륨에서 환경 변수, 커맨드-라인 인수 또는 구성 파일로 컨피그맵을 사용할 수 있습니다.
상단 내용 중 job_name: 'felix_metrics', job_name: 'typha_metrics' 이 부분들이 추가 되어서 프로메테우스에서 정보를 pull 할 수 있습니다~
- configMap 배포를 확인합니다.
kubectl get cm prometheus-config -n calico-monitoring(calico-k8s:default) root@k8s-m:~# kubectl get cm prometheus-config -n calico-monitoring
NAME DATA AGE
prometheus-config 1 12mCreate Prometheus pod
- pod 배포
kubectl apply -f - <<EOF
apiVersion: v1
kind: Pod
metadata:
  name: prometheus-pod
  namespace: calico-monitoring
  labels:
    app: prometheus-pod
    role: monitoring
spec:
  serviceAccountName: calico-prometheus-user
  containers:
  - name: prometheus-pod
    image: prom/prometheus
    resources:
      limits:
        memory: "128Mi"
        cpu: "500m"
    volumeMounts:
    - name: config-volume
      mountPath: /etc/prometheus/prometheus.yml
      subPath: prometheus.yml
    ports:
    - containerPort: 9090
  volumes:
  - name: config-volume
    configMap:
      name: prometheus-config
EOF
상단 spec > serviceAccountName 프로메테우스가 다른 파드 정보를 수집하기 때문에 serviceAccountName 정보를 가져와야 합니다.
volumeMounts는 위에서 만든 prometheus.yml를 마운트 하네요.
- pod 배포확인
kubectl get pods prometheus-pod -n calico-monitoring(calico-k8s:default) root@k8s-m:~# kubectl get pods prometheus-pod -n calico-monitoring
NAME READY STATUS RESTARTS AGE
prometheus-pod 1/1 Running 0 12mCreating a service to expose prometheus pod
- Service 배포
kubectl apply -f - <<EOF
apiVersion: v1
kind: Service
metadata:
  name: prometheus-dashboard-svc
  namespace: calico-monitoring
spec:
  selector:
      app:  prometheus-pod
      role: monitoring
  ports:
  - port: 9090
    targetPort: 9090
  type: NodePort
EOF- Service 확인
kubectl get svc -n calico-monitoring prometheus-dashboard-svc(calico-k8s:default) root@k8s-m:~# kubectl get svc -n calico-monitoring prometheus-dashboard-svc
NAME TYPE CLUSTER-IP EXTERNAL-IP PORT(S) AGE
prometheus-dashboard-svc NodePort 10.103.91.129 <none> 9090:30795/TCP 12m- NodePort을 통해 대시보드 접속을 확인합니다.
😁참고! : 실제
Master IP: NodePort로 접속시 정상적으로 작동합니다.하지만, 제 mac 환경에서는 NodePort로 접속이 되지 않아, window 환경에서 test 후 화면 캡쳐하여 함께 포스팅 했습니다!클러스터 재구성하니까 되네요...Port-Forward후 localhost로 접속하면 정상적으로 Query 호출이 되지 않아요.
제껀 왜 안될까요...?ㅋㅋㅋ😂
🌱 방법1. NodePort 접속
(Service-k8s:default) root@k8s-m:~# kubectl get node -o wide
NAME     STATUS   ROLES                  AGE   VERSION   INTERNAL-IP      EXTERNAL-IP   OS-IMAGE             KERNEL-VERSION     CONTAINER-RUNTIME
k8s-m    Ready    control-plane,master   61m   v1.22.6   192.168.10.10    <none>        Ubuntu 20.04.3 LTS   5.4.0-91-generic   docker://20.10.12
k8s-w1   Ready    <none>                 57m   v1.22.6   192.168.10.101   <none>        Ubuntu 20.04.3 LTS   5.4.0-91-generic   docker://20.10.12
k8s-w2   Ready    <none>                 54m   v1.22.6   192.168.10.102   <none>        Ubuntu 20.04.3 LTS   5.4.0-91-generic   docker://20.10.12
k8s-w3   Ready    <none>                 51m   v1.22.6   192.168.10.103   <none>        Ubuntu 20.04.3 LTS   5.4.0-91-generic   docker://20.10.12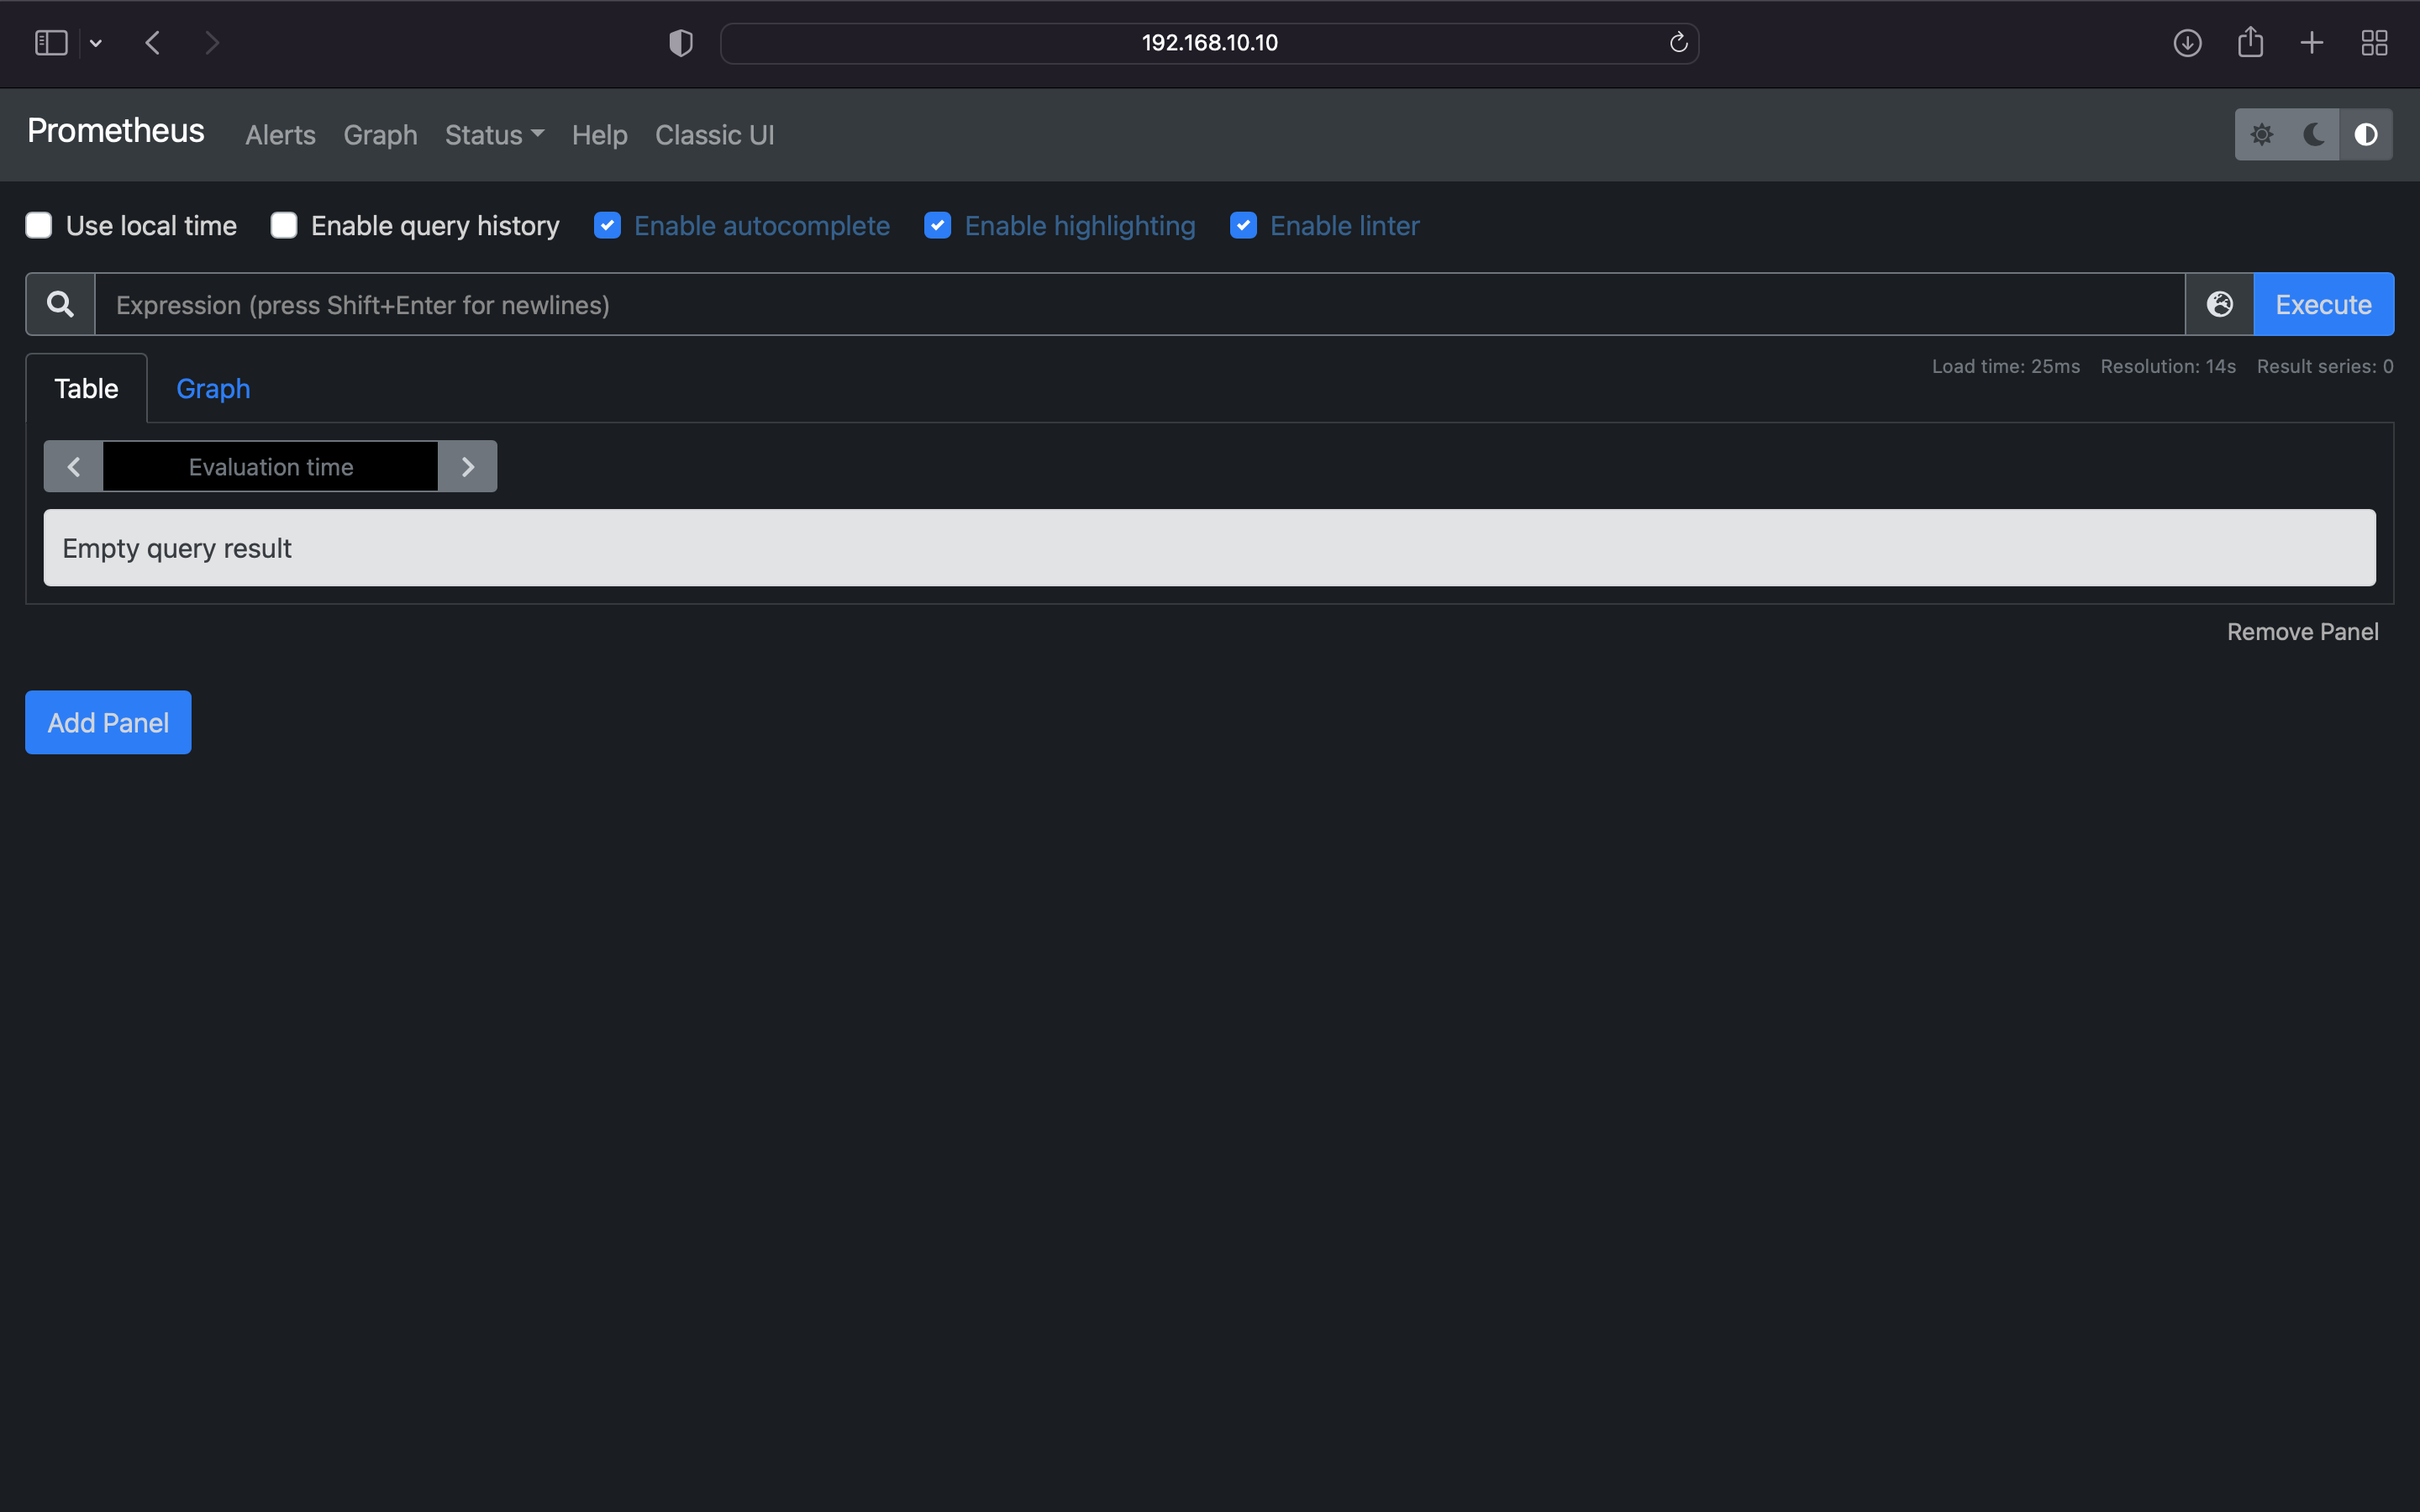
🌱 방법2. port-forward 접속
kubectl port-forward명령을 사용하여 로컬접속을 합니다.
 kubectl port-forward -n calico-monitoring svc/prometheus-dashboard-svc 9000:9090  --kubeconfig config
Forwarding from 127.0.0.1:9000 -> 9090
Forwarding from [::1]:9000 -> 9090
Handling connection for 9000
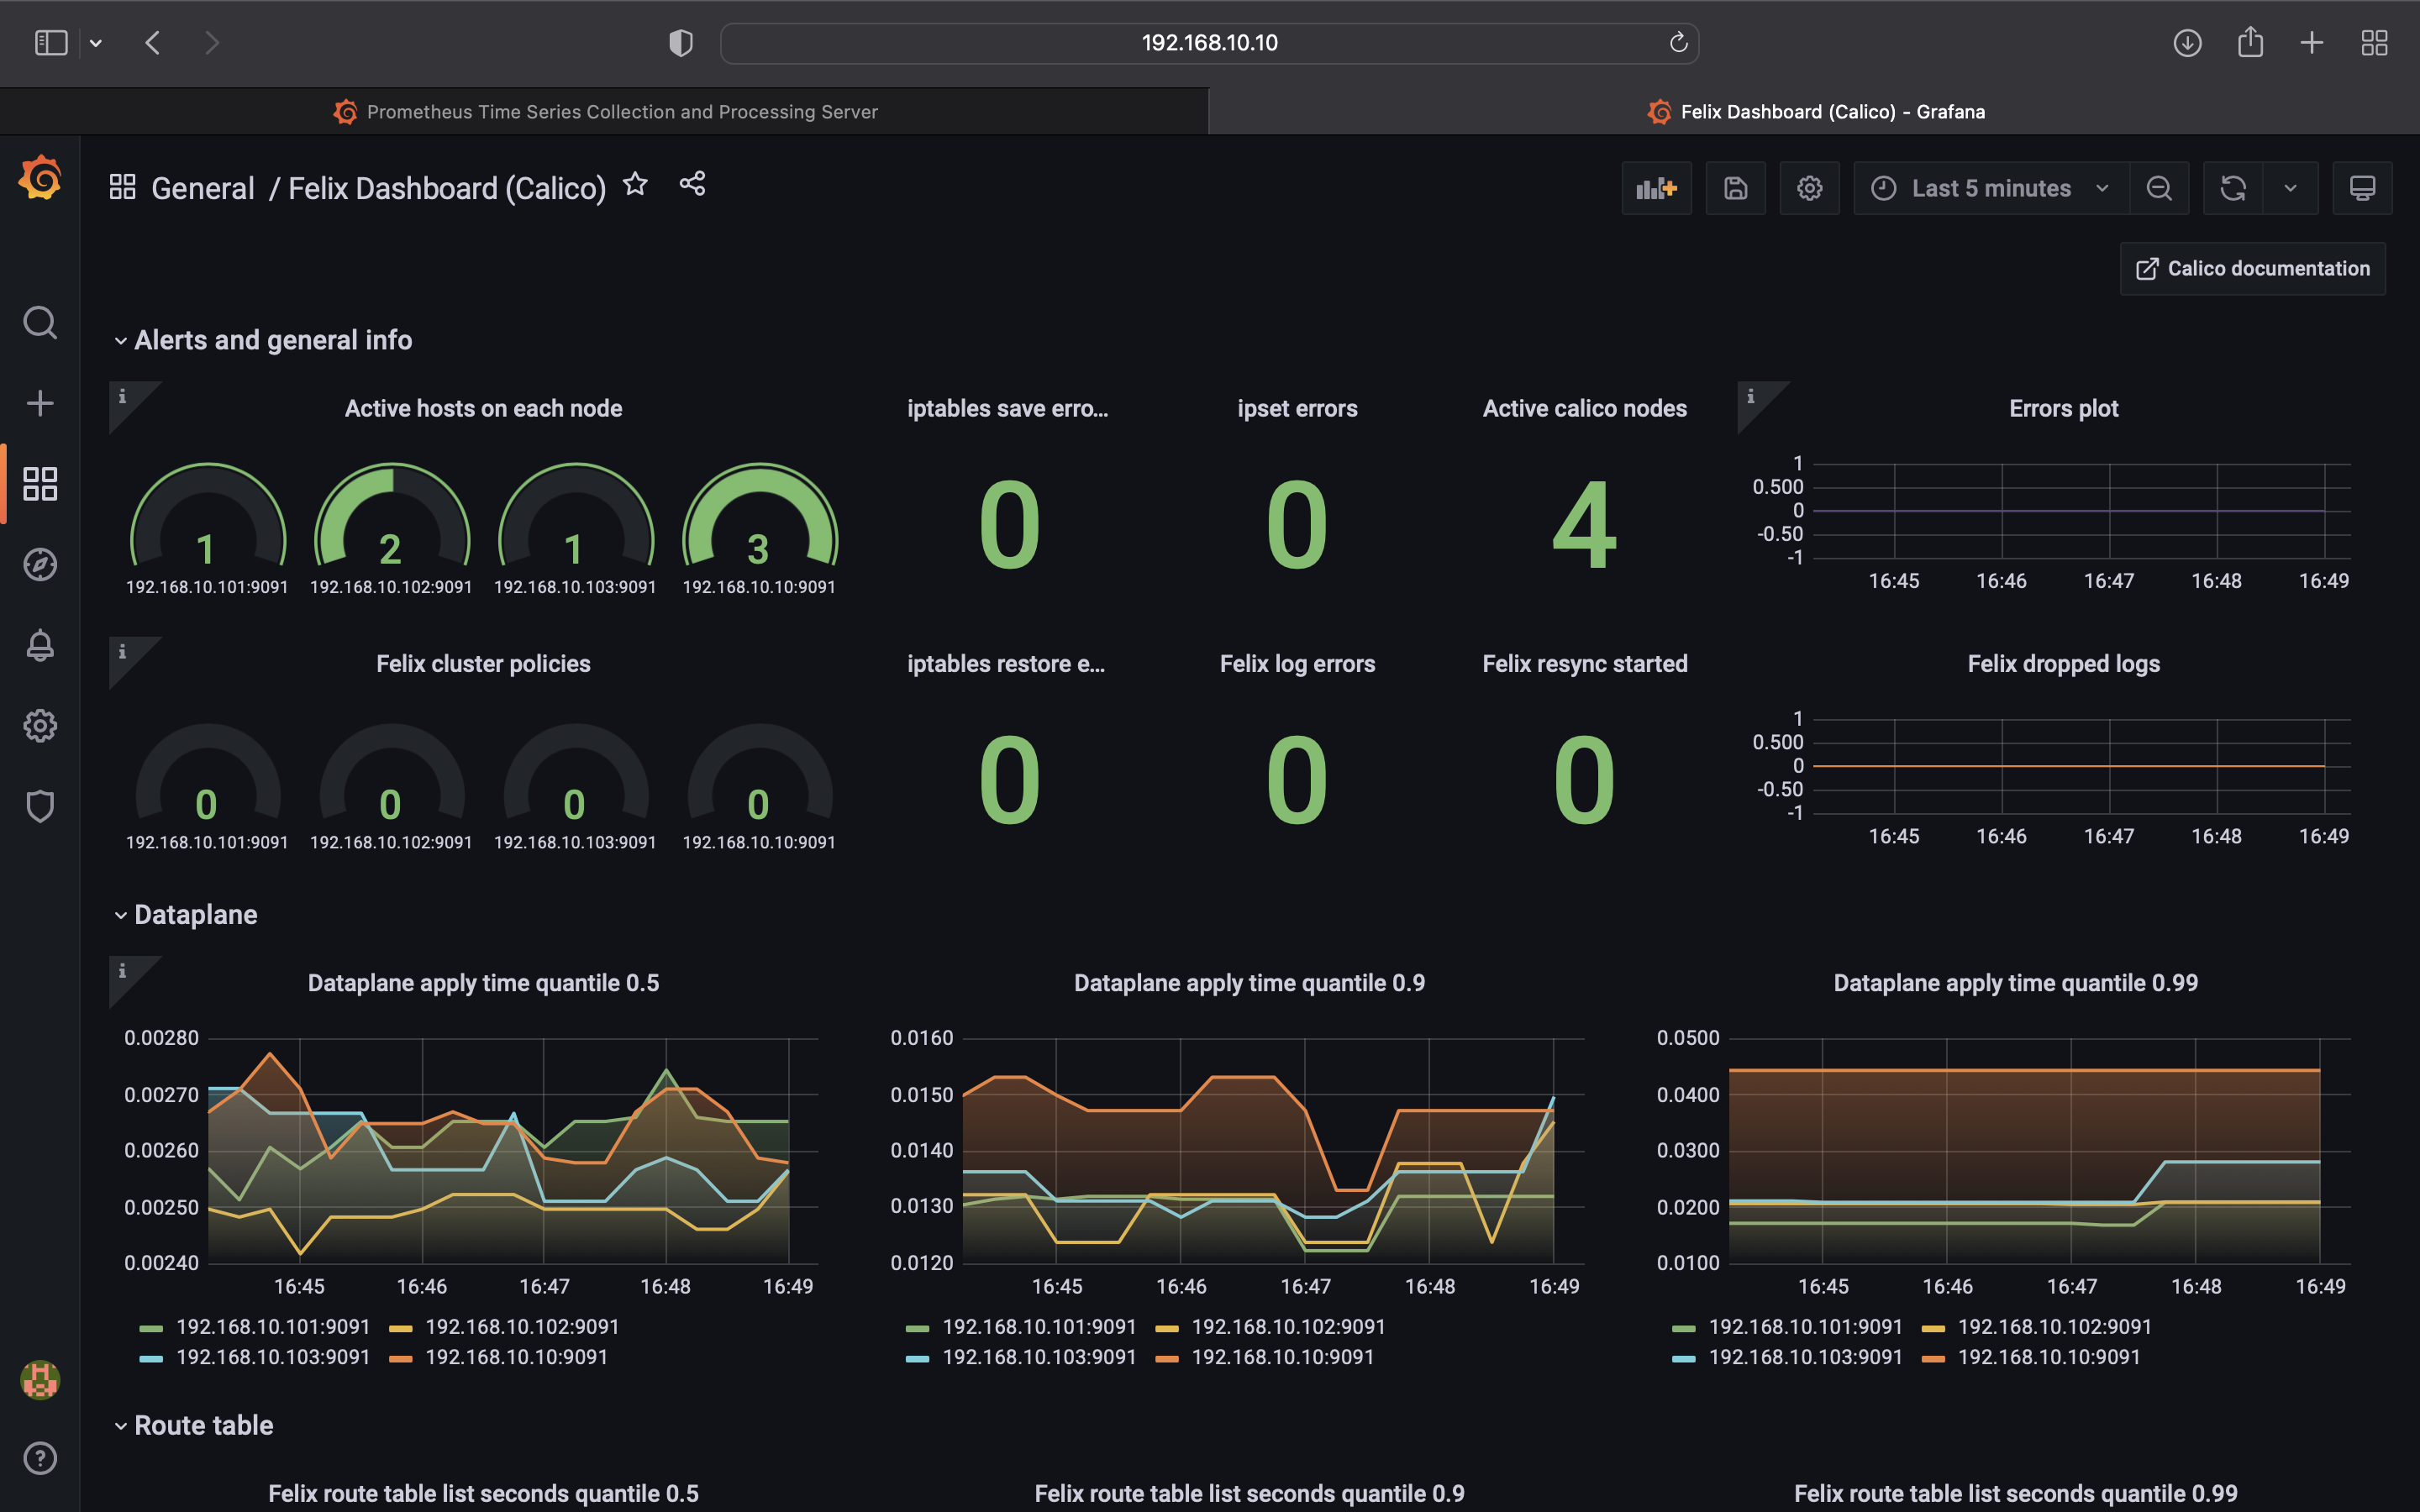
4. Grafana 대시보드
Preparing Grafana pod
- Provisioning datasource - configmap
kubectl apply -f - <<EOF
apiVersion: v1
kind: ConfigMap
metadata:
  name: grafana-config
  namespace: calico-monitoring
data:
  prometheus.yaml: |-
    {
        "apiVersion": 1,
        "datasources": [
            {
               "access":"proxy",
                "editable": true,
                "name": "calico-demo-prometheus",
                "orgId": 1,
                "type": "prometheus",
                "url": "http://prometheus-dashboard-svc.calico-monitoring.svc:9090",
                "version": 1
            }
        ]
    }
EOF- ConfigMap 배포 확인
kubectl get cm -n calico-monitoring grafana-config(calico-k8s:default) root@k8s-m:~# kubectl get cm -n calico-monitoring grafana-config
NAME DATA AGE
grafana-config 1 12m- Provisioning Calico dashboards - Here you will create a configmap with Felix and Typha dashboards.
kubectl apply -f https://docs.projectcalico.org/manifests/grafana-dashboards.yaml- 확인
kubectl get cm -n calico-monitoring grafana-dashboards-config(calico-k8s:default) root@k8s-m:~# kubectl get cm -n calico-monitoring grafana-dashboards-config
NAME DATA AGE
grafana-dashboards-config 3 13m- Grafana Pod 생성(Creating Grafana pod)
kubectl apply -f - <<EOF
apiVersion: v1
kind: Pod
metadata:
  name: grafana-pod
  namespace: calico-monitoring
  labels:
    app:  grafana-pod
    role: monitoring
spec:
  containers:
  - name: grafana-pod
    image: grafana/grafana:latest
    resources:
      limits:
        memory: "128Mi"
        cpu: "500m"
    volumeMounts:
    - name: grafana-config-volume
      mountPath: /etc/grafana/provisioning/datasources
    - name: grafana-dashboards-volume
      mountPath: /etc/grafana/provisioning/dashboards
    - name: grafana-storage-volume
      mountPath: /var/lib/grafana
    ports:
    - containerPort: 3000
  volumes:
  - name: grafana-storage-volume
    emptyDir: {}
  - name: grafana-config-volume
    configMap:
      name: grafana-config
  - name: grafana-dashboards-volume
    configMap:
      name: grafana-dashboards-config
EOF- Grafana Pod 배포 확인
kubectl get pod -n calico-monitoring grafana-pod(calico-k8s:default) root@k8s-m:~# kubectl get pod -n calico-monitoring grafana-pod
NAME READY STATUS RESTARTS AGE
grafana-pod 1/1 Running 0 11m- Grafana Expose를 위한 Service 생성
kubectl apply -f - <<EOF
apiVersion: v1
kind: Service
metadata:
  name: grafana-dashboard-svc
  namespace: calico-monitoring
spec:
  selector:
      app:  grafana-pod
      role: monitoring
  ports:
  - port: 3000
    targetPort: 3000
  type: NodePort
EOF- Service 생성 확인
kubectl get svc -n calico-monitoring grafana-dashboard-svc(calico-k8s:default) root@k8s-m:~# kubectl get svc -n calico-monitoring grafana-dashboard-svc
NAME TYPE CLUSTER-IP EXTERNAL-IP PORT(S) AGE
grafana-dashboard-svc NodePort 10.107.170.12 <none> 3000:31340/TCP 11m- NodePort 접속 확인
🌱 방법1. NodePort 접속
(Service-k8s:default) root@k8s-m:~# kubectl get node -o wide
NAME     STATUS   ROLES                  AGE   VERSION   INTERNAL-IP      EXTERNAL-IP   OS-IMAGE             KERNEL-VERSION     CONTAINER-RUNTIME
k8s-m    Ready    control-plane,master   61m   v1.22.6   192.168.10.10    <none>        Ubuntu 20.04.3 LTS   5.4.0-91-generic   docker://20.10.12
k8s-w1   Ready    <none>                 57m   v1.22.6   192.168.10.101   <none>        Ubuntu 20.04.3 LTS   5.4.0-91-generic   docker://20.10.12
k8s-w2   Ready    <none>                 54m   v1.22.6   192.168.10.102   <none>        Ubuntu 20.04.3 LTS   5.4.0-91-generic   docker://20.10.12
k8s-w3   Ready    <none>                 51m   v1.22.6   192.168.10.103   <none>        Ubuntu 20.04.3 LTS   5.4.0-91-generic   docker://20.10.12
🌱 방법2. port-forward 접속
kubectl port-forward명령을 사용하여 로컬접속을 합니다.
 ~/KANS/3week  kubectl port-forward -n calico-monitoring svc/grafana-dashboard-svc 3000:3000  --kubeconfig config                        1 err  eksadmin@pod1.ap-northeast-2.eksctl.io kube  01:45:41 PM
Forwarding from 127.0.0.1:3000 -> 3000
Forwarding from [::1]:3000 -> 3000
Handling connection for 3000
Handling connection for 3000
Handling connection for 3000
Handling connection for 3000
...

끝✌🏻

Calico 모니터링에 대한 친절한 실습 가이드 내용 잘 봤습니다.
남은 기간도 잘 부탁드립니다 :)