
prometheus
https://prometheus.io/docs/introduction/overview/
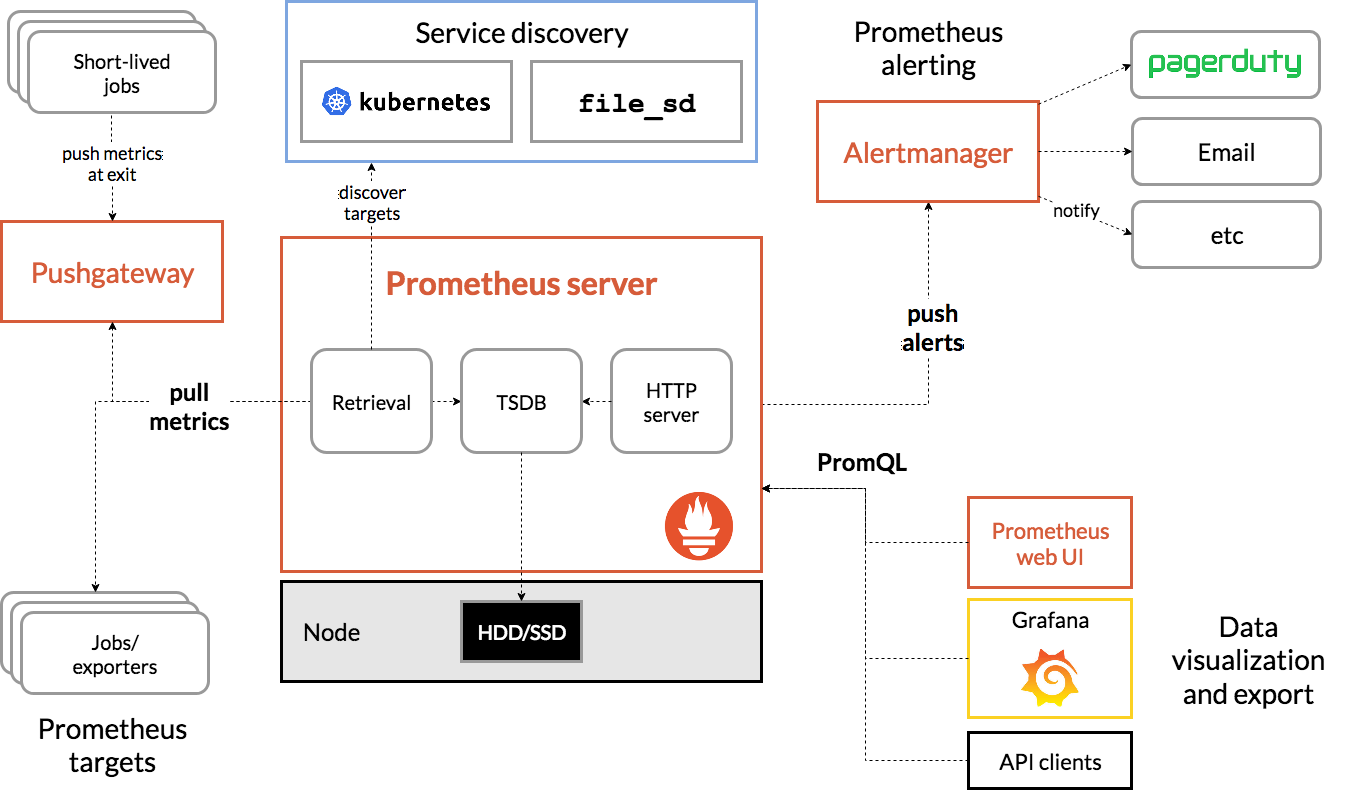
프로메테우스는 웹 서버, 데이터베이스 등 다양한 시스템을 모니터링하고, 특정 조건이 발생하면 담당자에게 경고(Alert) 할 수 있는 모니터링 오픈 소스이다.
프로메테우스는 설정된 작업(job)에 대로 매트릭(metrics) 정보를 모니터링 대상 시스템에 설치된 익스포터(Exporter) 혹은 푸시 게이트웨이(Push Gateway)를 통해 수집한다. 수집된 모든 정보를 로컬에 저장하고, 규칙(rule)을 수행하여 시계열 형태의 데이터(TSDB: Time Series Database)로 수집하고 특정 조건에 설정된 경고(Alert) 등을 발생한다.
config
prometheus server 에 대한 상세한 설정은 prometheus.yml 에서 구현한다.
prometheus 공식 홈페이지에서 (https://prometheus.io/download/) prometheus 를 다운받아보자.
다운받은 파일의 prometheus.yml 의 기본적인 구조는 다음과 같다.
// default prometheus.yml

# my global config
global:
  scrape_interval: 15s # Set the scrape interval to every 15 seconds. Default is every 1 minute.
  evaluation_interval: 15s # Evaluate rules every 15 seconds. The default is every 1 minute.
  # scrape_timeout is set to the global default (10s).

# Alertmanager configuration
alerting:
  alertmanagers:
    - static_configs:
        - targets:
          # - alertmanager:9093

# Load rules once and periodically evaluate them according to the global 'evaluation_interval'.
rule_files:
  # - "first_rules.yml"
  # - "second_rules.yml"

# A scrape configuration containing exactly one endpoint to scrape:
# Here it's Prometheus itself.
scrape_configs:
  # The job name is added as a label `job=<job_name>` to any timeseries scraped from this config.
  - job_name: "prometheus"

    # metrics_path defaults to '/metrics'
    # scheme defaults to 'http'.

    static_configs:
      - targets: ["localhost:9090"]
global (전역 설정)
	scrape_interval: metric 수집 주기를 설정
	evaluate_interval: 규칙을 평가할 주기를 설정

alerting (alertmanager 설정)
	rule_files: 규칙을 로딩하고 evaluation_interval 에 따라서 주기적으로 평가

scrape_configs (metric 수집 endpoint 설정)
	- job_name: 이 설정에서 수집한 타임시리즈에 대해 'job=<job_name>'으로 라벨을 추가
      scrape_interval: metric 수집 주기를 설정
      metrics_path: 경로 지정( ex. '/node' )
	  static_configs: 타겟(엔드포인트)과 타겟에 대한 라벨을 지정
		- targets: metric 을 수집할 endpoint 지정
          labels:
          	metric_group:
            cluster:
      scheme:
      basic_auth:
      	username:
        password:
alerting rule
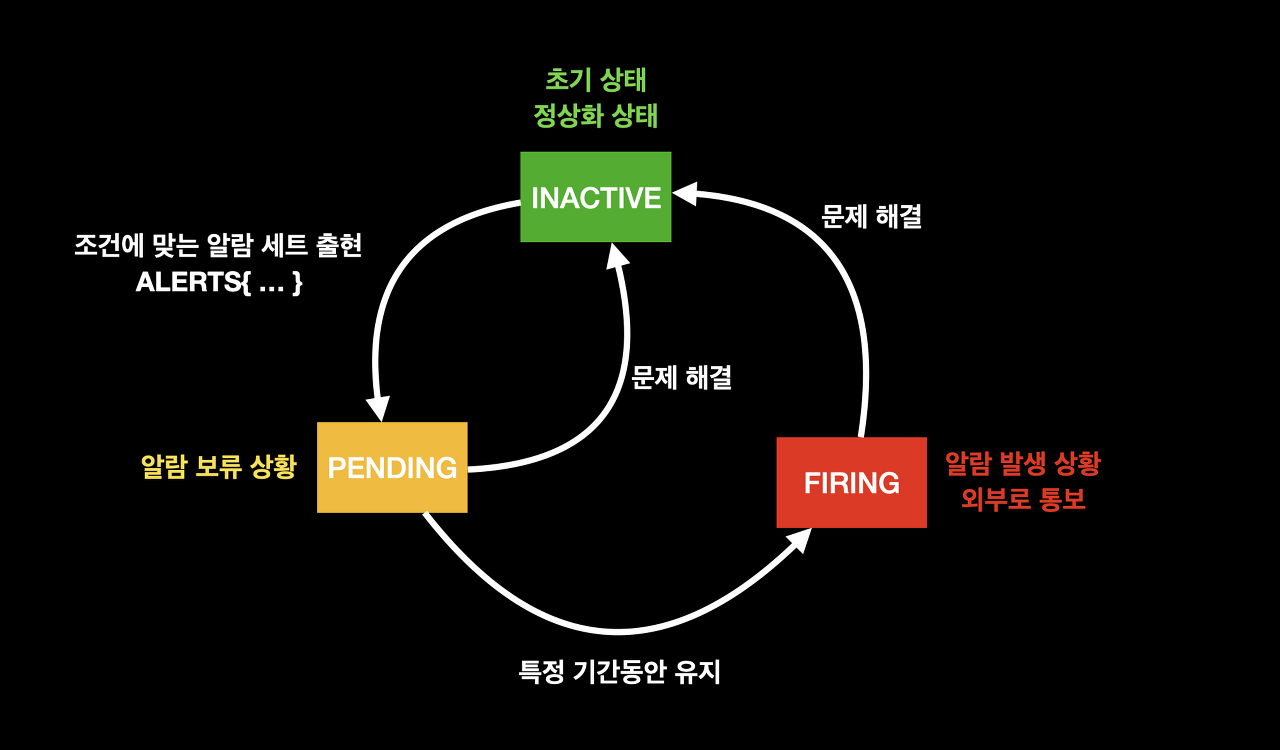
알람은 크게 2가지로 나누어진다.
- Alerting Rule - 알람 규칙을 정의
- Alert Manager - 생성된 알람을 3자에 전달
alerting Rule 이란, PromQL을 기반으로 알람 조건을 정의하고, Alert Manager 에게 alert 메시지를 전달하면
Alert Manager 가 slack, email 과 같은 외부 서비스에 FIRING 된 알람들을 전달한다. 알림에는 다음과 같이 3가지 상태가 존재한다.

-
INACTIVE : 알람 조건에 맞는 알람 세트가 없음. 정상 상태.
-
PENDING : 알람 조건에 충족하여 알람 세트가 생성된 상태. Alert Rule에 정의된 "for" 기간 동안 이 상태를 유지하게 되면 "FIRING" 상태가 된다.
-
FIRING : "PENDING" 상태가 주어진 기간동안 유지될 경우, 이 상태로 전이한다. 이 상태가 되면 Prometheus는 알람의 "Notification"을 Alertmanager로 전송한다.
알림의 사이클은 다음과 같이 진행된다.
metric & label
metric 은 모니터링하는 시스템의 특정 데이터를 의미한다. 예를 들어 내가 Apache 웹 서버를 모니터링한다면, 웹 서버가 단위 시간 내 얼마나 많은 HTTP 요청을 받았는지의 값을 구하기 위해서 http_requests_total이라는 metric 을 사용한다. metric 은 프로메테우스 내에서 기본적으로 정의되어 있다.
label 은 metric 을 좀 더 조건을 추가하여 상세화 한 것이다. 예를 들어 HTTP 요청 중, POST 메서드로 /api/v2라는 경로를 요청한 수만 알고 싶다면 http_requests_total에 조건을 추가해주어야 한다. metric 에 중괄호{..}를 사용하고, key-value 형태의 label 을 쿼리에 추가하여 가능하다
#형식
<metric name>{<label name>=<label value>, ...}

#예제
http_requests_total{method="POST", handler="/api/v2"}
[ref]
https://prometheus.io/
https://gurumee92.tistory.com/268
https://m.blog.naver.com/techtrip/221798353723