
이 설정은 Local에서 Docker 사용하지 않고, 설치형으로 작성된 글입니다.
1. Spring Boot 설정
1-1) Spring Boot
dependencies {
	implementation 'org.springframework.boot:spring-boot-starter-actuator'
	implementation 'io.micrometer:micrometer-registry-prometheus'
}
build.gradle에 해당 dependecy를 추가해준다.
1-2) application.yml 설정
spring:
  application:
    name: monitoring-test

management:
  endpoint:
    metrics:
      enabled: true
    prometheus:
      enabled: true

  endpoints:
    web:
      exposure:
        include: health, info, metrics, prometheus

  metrics:
    tags:
      application: ${spring.application.name}
1-3) 테스트 Controller 작성
@Controller
@EnableAutoConfiguration
public class MonitorController {
    @RequestMapping(value = "/")
    @ResponseBody
    public String doMain() {
        return "[Monitoring] Hello, World!";
    }

    @RequestMapping("/endpoint1")
    @ResponseBody
    public String doEndPoint1() {
        return "[Monitoring] EndPoint 1";
    }

    @RequestMapping("/endpoint2")
    @ResponseBody
    public String doEndPoint2() {
        return "[Monitoring] EndPoint 2";
    }
}
1-4) /actuator/prometheus 접속 확인
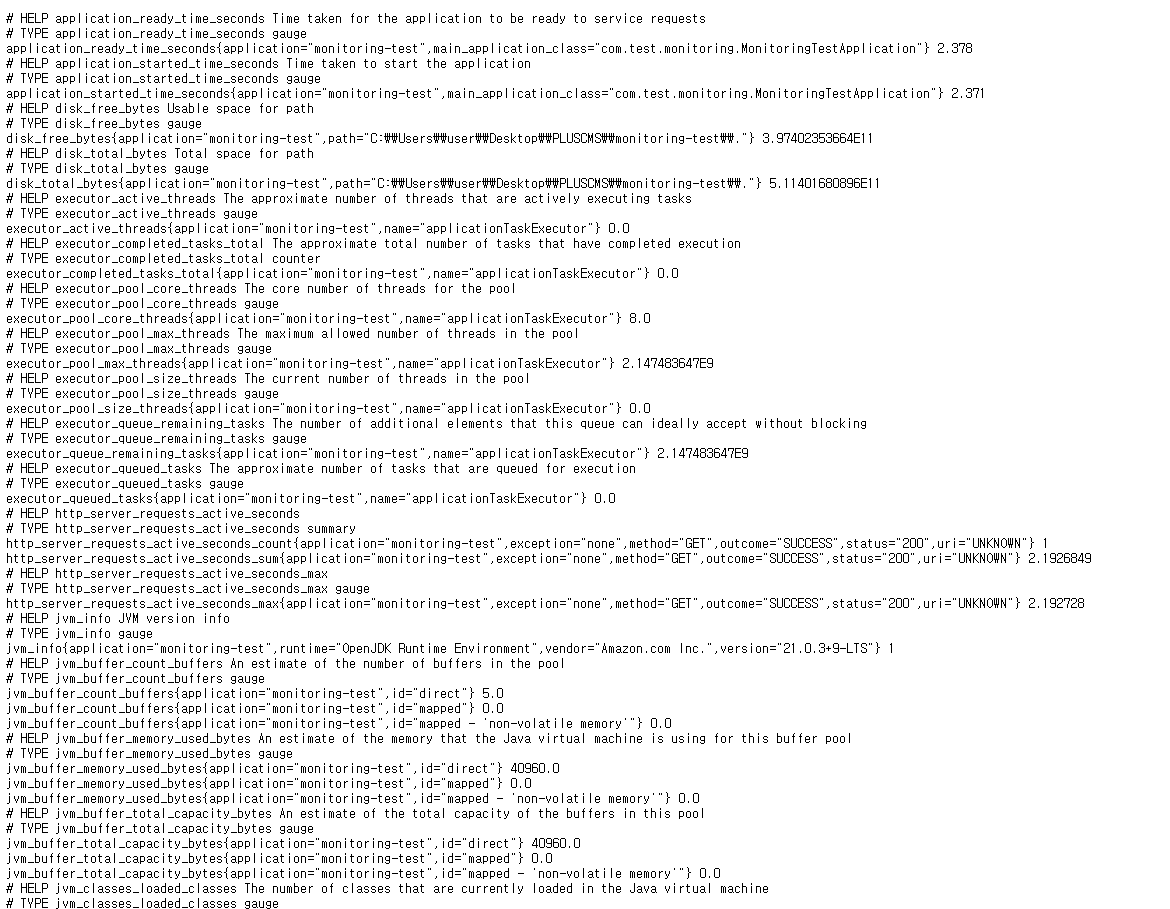
위와 같이 /actuator/prometheus에 대해 접속 확인한다.
2. Prometheus 설치 및 설정
2-1) Prometheus 설치
- https://prometheus.io/download/ 해당 링크에서 각 환경에 맞는 설치 파일을 다운 받는다. (이 글에서는 prometheus-2.45.5.windows-amd64를 다운) 다운받은 zip파일의 압축을 풀어준다.
2-2) Prometheus 설정
- 압축을 푼 폴더에서 prometheus.yml 파일을 설정해 준다.
# my global config
global:
  scrape_interval: 10s # Set the scrape interval to every 15 seconds. Default is every 1 minute.
  evaluation_interval: 10s # Evaluate rules every 15 seconds. The default is every 1 minute.
  # scrape_timeout is set to the global default (10s).

# Alertmanager configuration
alerting:
  alertmanagers:
    - static_configs:
        - targets:
          # - alertmanager:9093

# Load rules once and periodically evaluate them according to the global 'evaluation_interval'.
rule_files:
  # - "first_rules.yml"
  # - "second_rules.yml"

# A scrape configuration containing exactly one endpoint to scrape:
# Here it's Prometheus itself.
scrape_configs:
  # The job name is added as a label `job=<job_name>` to any timeseries scraped from this config.
  - job_name: "prometheus"
    metrics_path: "/actuator/prometheus"

    # metrics_path defaults to '/metrics'
    # scheme defaults to 'http'.

    static_configs:
      - targets: ["localhost:8080"]
static_configs의 target을 현재 로컬에서 띄운 Spring Boot port에 맞게 작성 후 저장해준다.
- prometheus.exe를 실행시킨다.
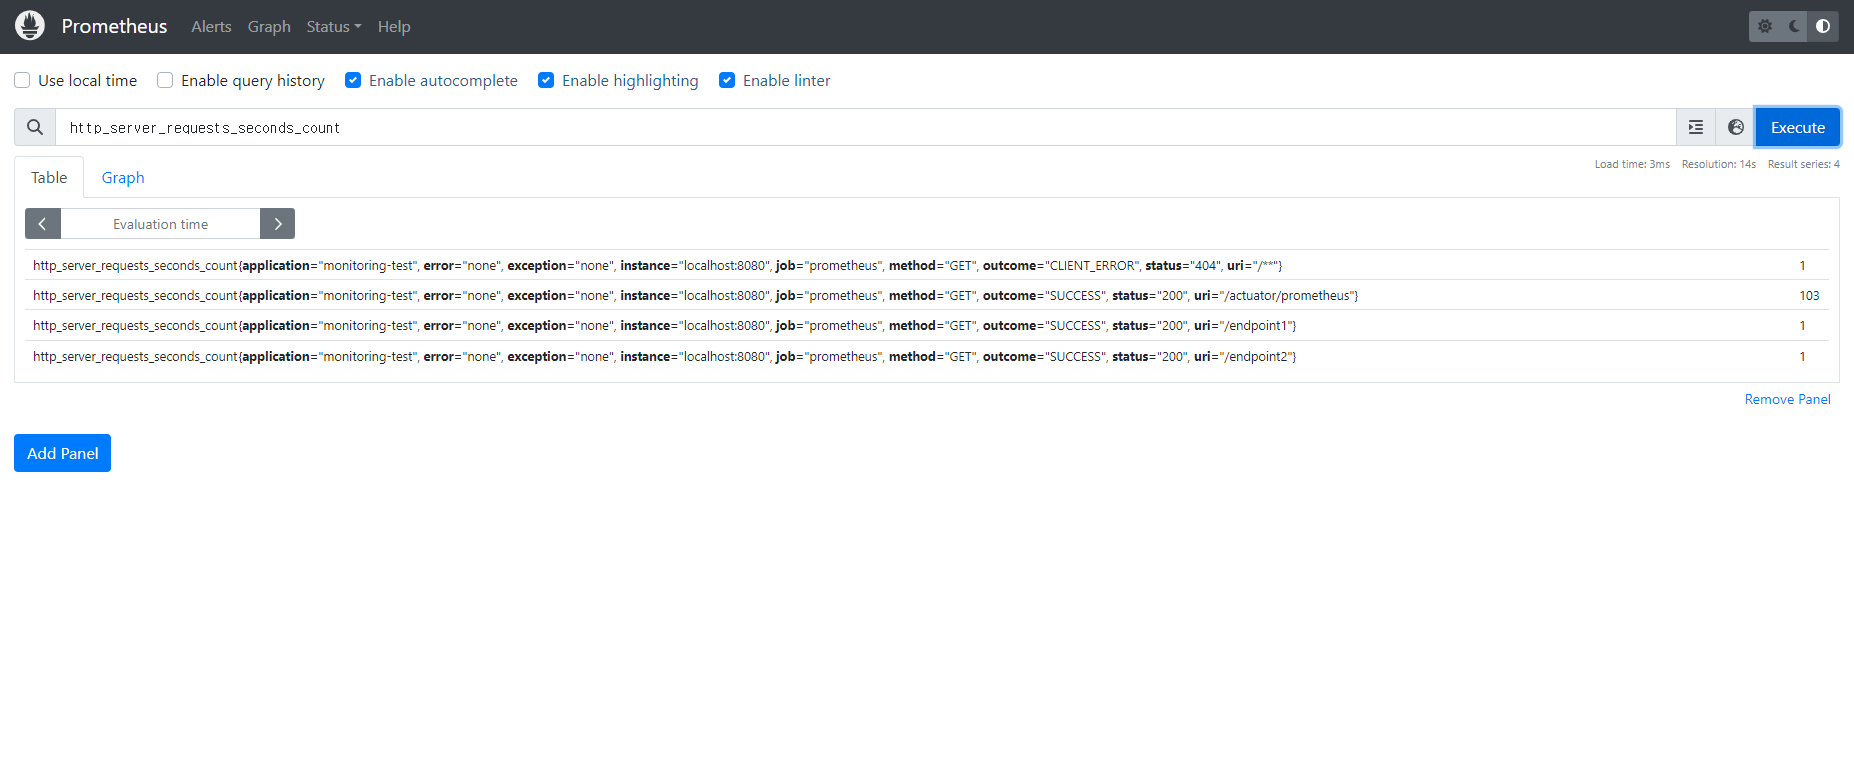
- localhost:9090에 접속하여 현재 띄운 spring boot와 잘 연결 되었는지 확인한다.(http_server_requests_seconds_count를 통해 확인)
3. Grafana 설정
3-1) Grafana 설치
- https://grafana.com/grafana/download 해당 링크에서 각 환경에 맞는 설치 파일을 다운 받은 후 설치를 해준다. (이 글에서는 grafana-enterprise-11.0.0.windows-amd64를 다운)
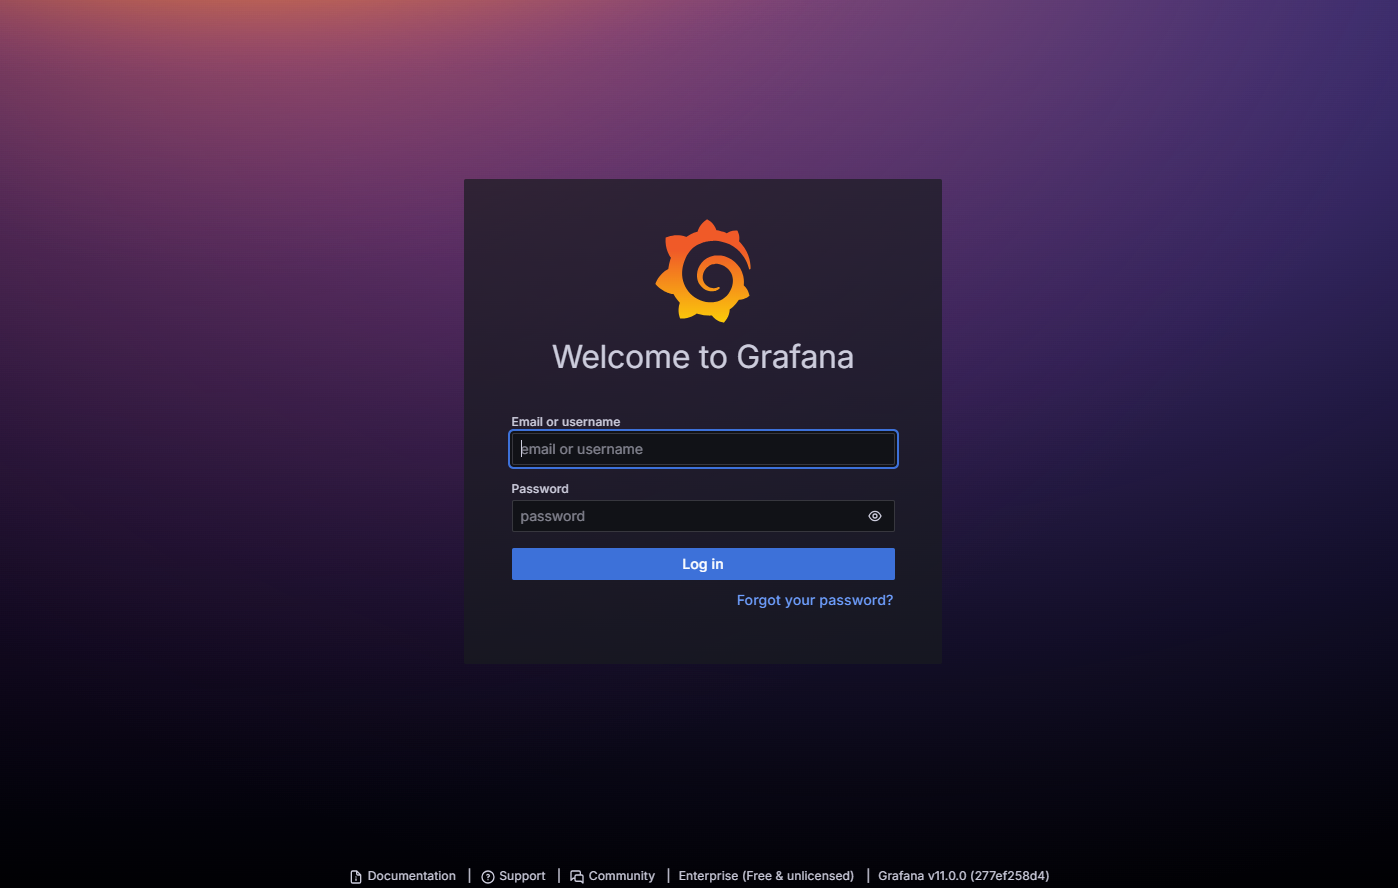
- http://localhost:3000 접속시 아래와 같은 화면이 나오고 admin / admin으로 로그인 한다.
3-2) Grafana 설정
1) Data sources > Add new data source 버튼 클릭
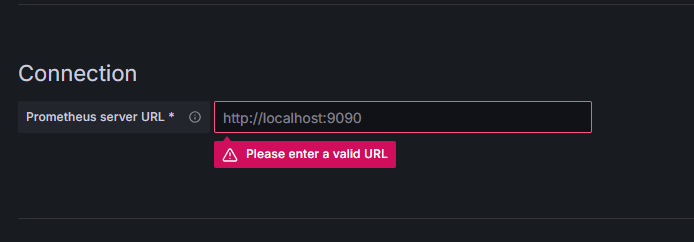
2) Prometheus 선택 후 Connection 정보에 http://localhost:9090 입력 후 Save&test 클릭 -> complete시 대시보드 접속
3) Add visualization 클릭 후 Metric에 테스트로 http_server_requests_seconds_count 선택 > apply
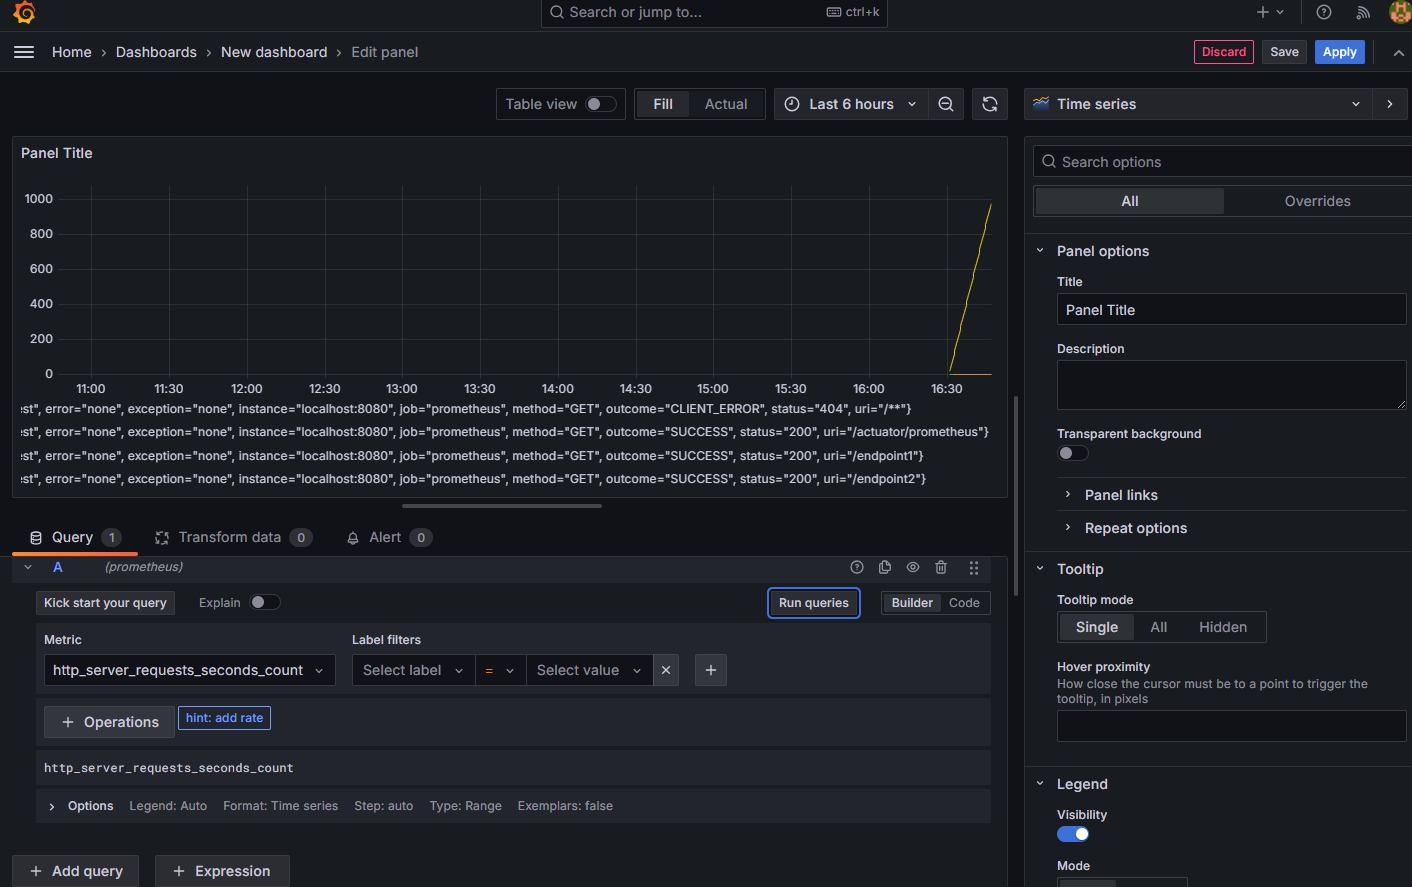
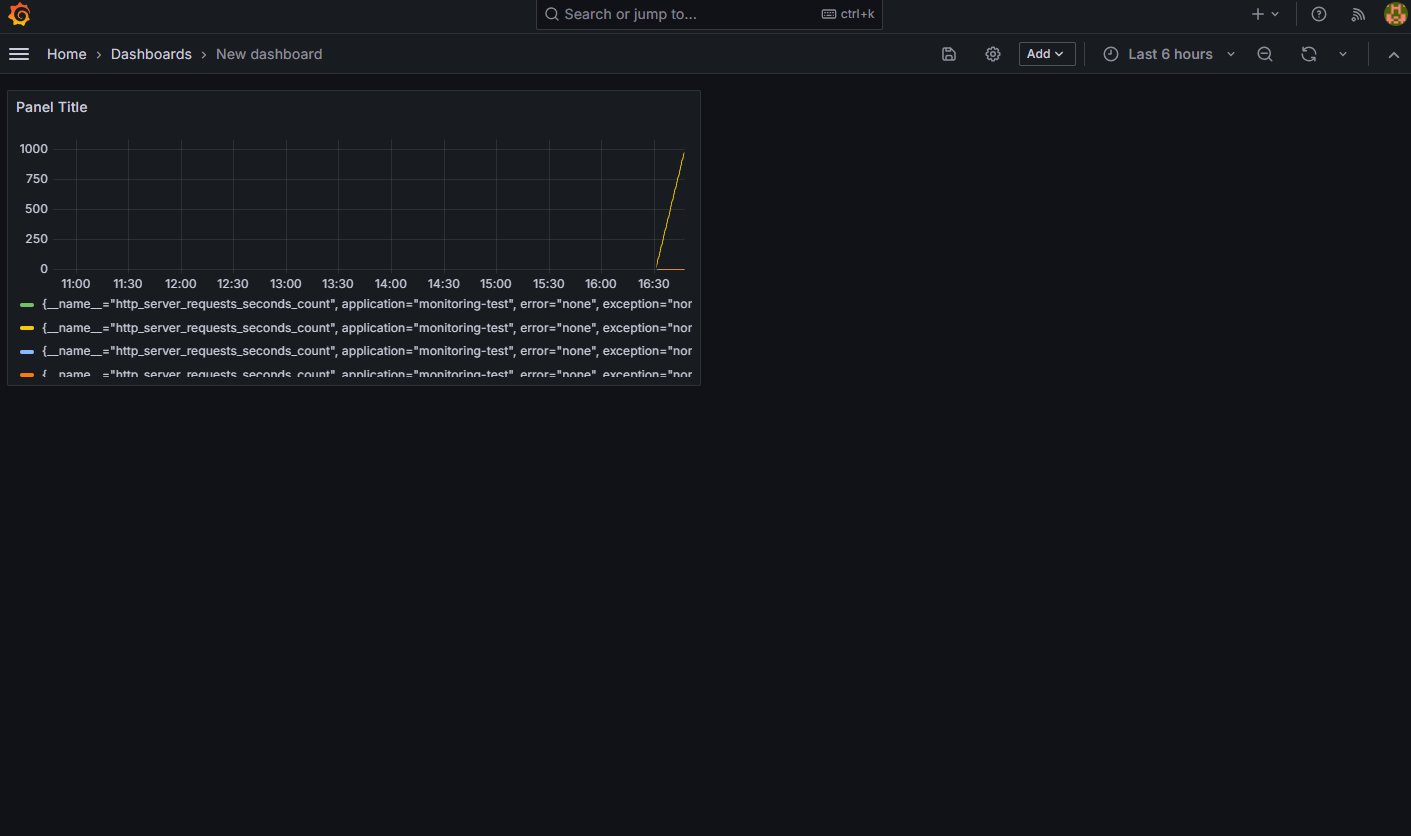
- 추가적으로 보고싶은 데이터들을 추가 및 설정하여 시각화 하면 된다.
참조
https://blog.bespinglobal.com/post/springboot-prometheus-grafana%EC%9D%84-%EC%9D%B4%EC%9A%A9%ED%95%9C-monitoring-%EA%B5%AC%EC%B6%95/
https://junuuu.tistory.com/968

예전에 Spring Boot에 Prometheus를 붙이려다가 말았는데, 다시 하게 된다면 이 글을 참고하면 좋을 것 같네요! 유용한 지식 전달 감사합니다!