pd.crosstab
document : https://pandas.pydata.org/docs/reference/api/pandas.crosstab.html
pd.crosstab(
    [train.Embarked, train.Pclass],
    [train.Sex, train.Survived],
    margins=True
    ).style.background_gradient(cmap='summer_r')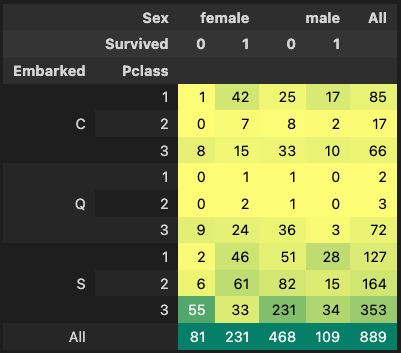
두 개 이상의 피쳐를 엮어서 볼 수 있는 method다.
사용법은 간단하다.
먼서 적은 피쳐가 x축으로 두 번째 적은 피쳐가 y축으로 해서 두 피쳐의 관계를 그려준다.
이 때, x,y축에 두 번 이상의 세분화를 하고 싶다면 []list 형태로 묶어서 작성하면 위 figure 처럼 세분화가 된다.
margins는 all 부분을 만들지 말지 선택하는 parameter이다.
style.background_gradient ~~ 부분은 표에서 hitmap을 만들어준다.

머신러닝 엔지니어 김태종입니다. anomaly detection, recommendation system에 관심있습니다.