Topic 1 – Formatting Commands
▪ fields
: 검색 결과에서 특정 필드를 포함시키거나 제거할 경우 사용한다.
index=web sourcetype=access_combined product_name=*
| fields product_name price
→ product_name과 price 필드만 검색된다.
index=web sourcetype=access_combined product_name=*
| fields - product_name price
→ product_name과 price가 제외된 필드만 검색된다.
index=web sourcetype=access_combined product_name=*
| fields -product_name price
→ price 필드만 검색된다.
▪ table
: 필드명과 결합해 검색 결과를 테이블 형식으로 보여준다.
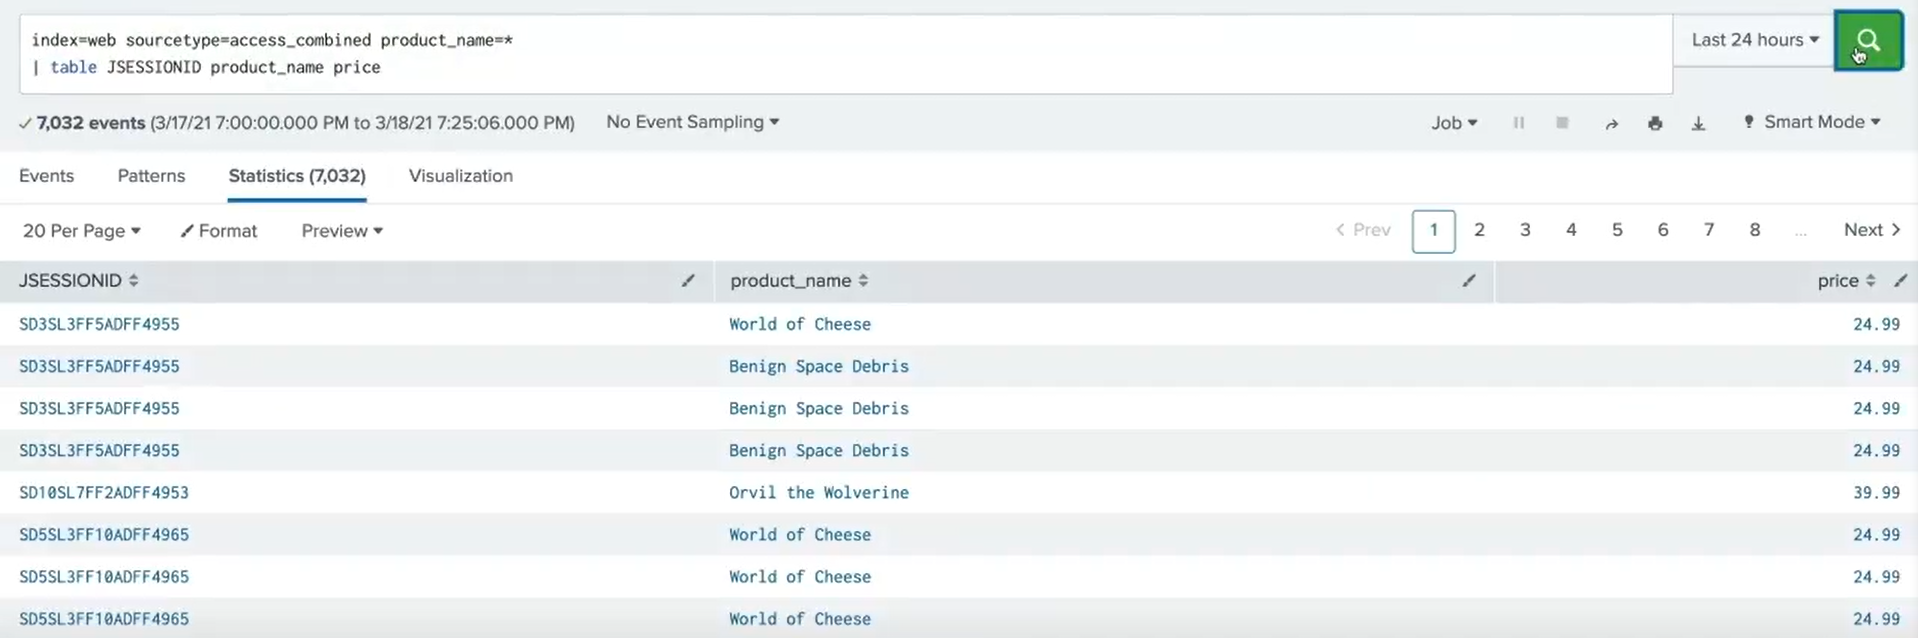
index=web sourcetype=access_combined product_name=*
| table JESSIONID product_name price
JESSIONID, product_name, price 순으로 보여짐.
▪ dedup
: 중복제거
index=web sourcetype=access_combined product_name=*
| dedup JESSIONID price
→ JESSIONID의 중복 값이 제거된 결과 값이 나온다.
▪ addtotals
: 각 검색 결과에 대한 모든 숫자 필드의 산술 합계 결과를 통계탭에 보여준다.
합계를 구하려는 필드 목록을 지정할 수 있다.
index=sales sourcetype=vender_sales product_name=* VendorCountry="United States" OR VendorCountry="Canada"
| chart sum(price) over product_name by VendorCountry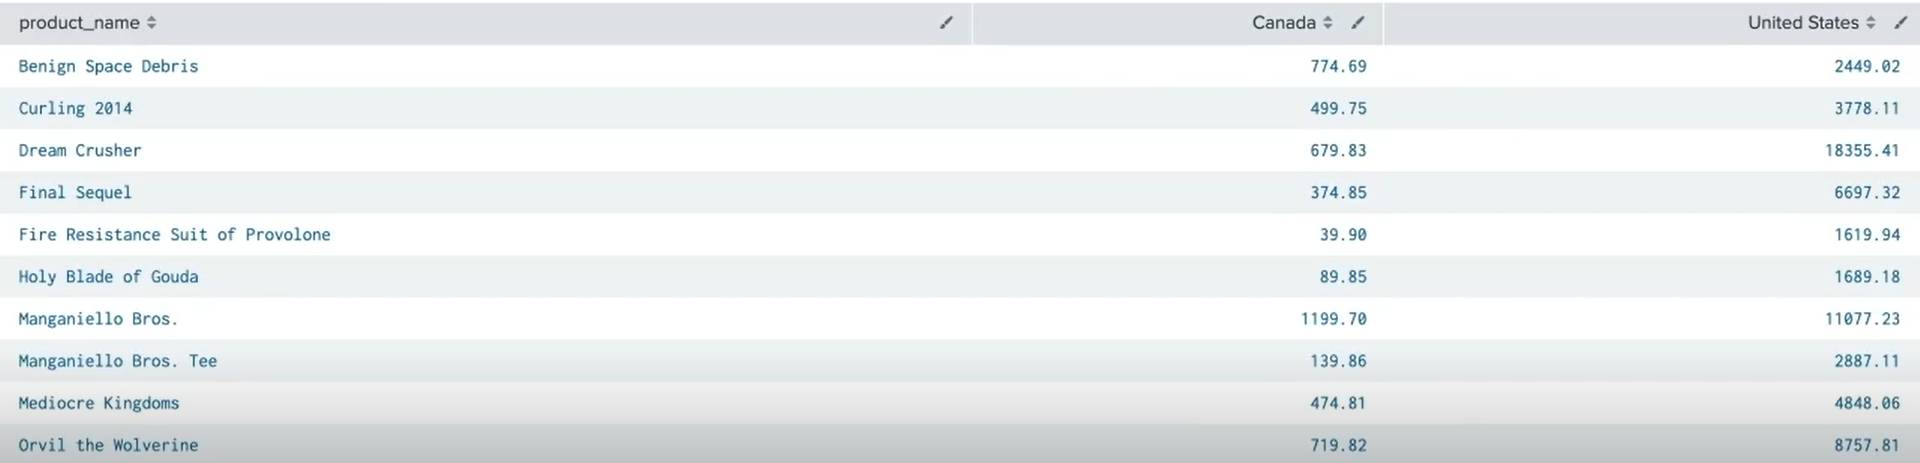
index=sales sourcetype=vender_sales product_name=* VendorCountry="United States" OR VendorCountry="Canada"
| chart sum(price) over product_name by VendorCountry
| addtotals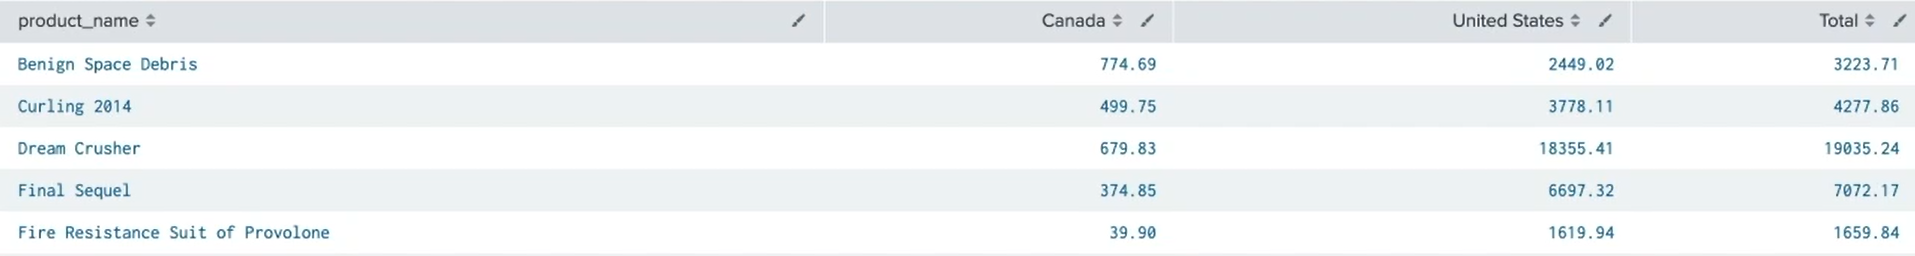
col=true
: 열 합계를 계산하여 맨 밑에 각 필드의 합계를 나타내는 새 결과를 추가한다.
index=sales sourcetype=vender_sales product_name=* VendorCountry="United States" OR VendorCountry="Canada"
| chart sum(price) over product_name by VendorCountry
| addtotals col=true label="Total Sales" labelfield="product_name" fieldname="Total By Product"
▪ The fieldformat command
: 필드 값의 형식을 변경할 수 있다.
index=sales sourcetype=vendor_sales product_name=*
| stats sum(price) as Total by product_name
| addtotal col=t label="Total Sales" labelfield="product_name"
| fieldformat Total = "$" + tostring(Total, "commas")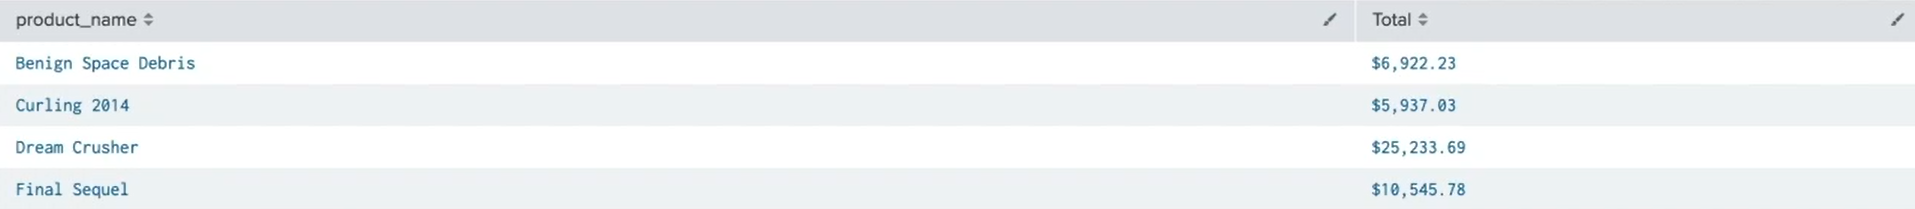
Topic 2 – Visualizing Data
▪ Explore visualization types
index=sales sourcetype=vendor_sales
| stats count(linecount) as "Units Sold" by product_name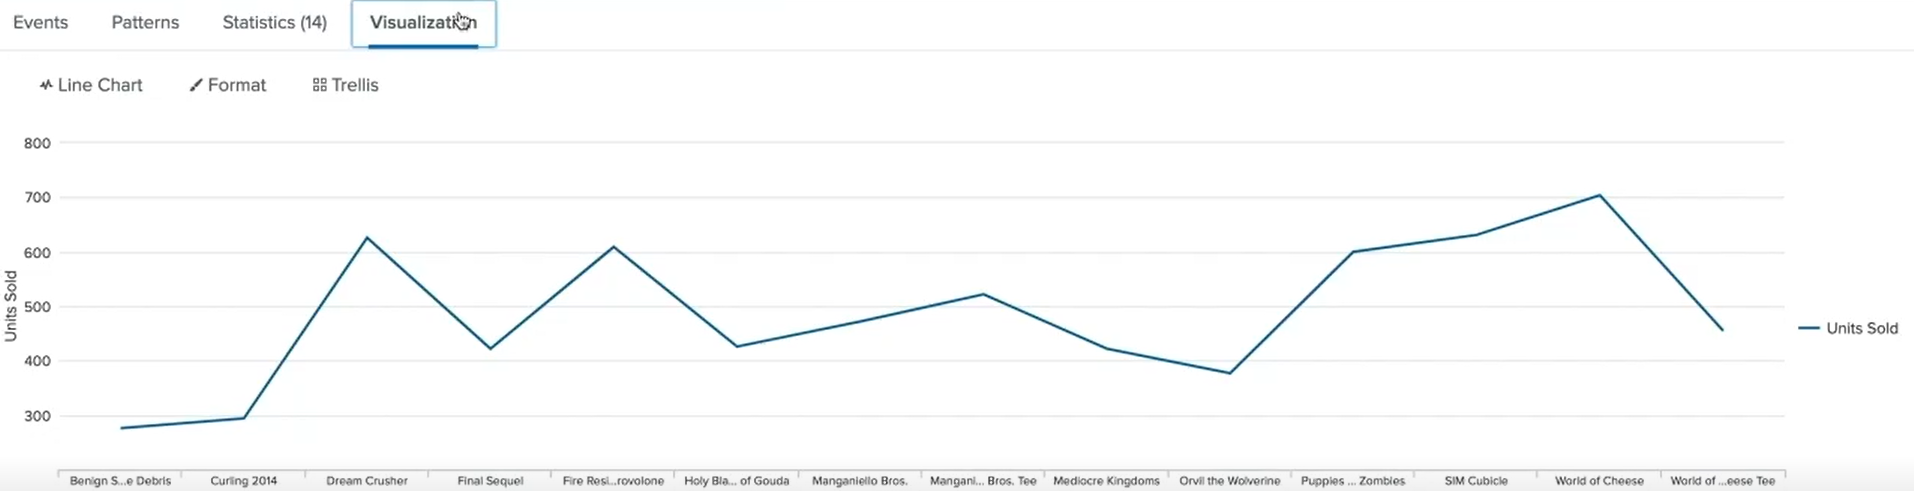
▪ Use transforming commands to order results into a data table:
o | top
index=sales sourcetype=vendor_sales
| top Vendor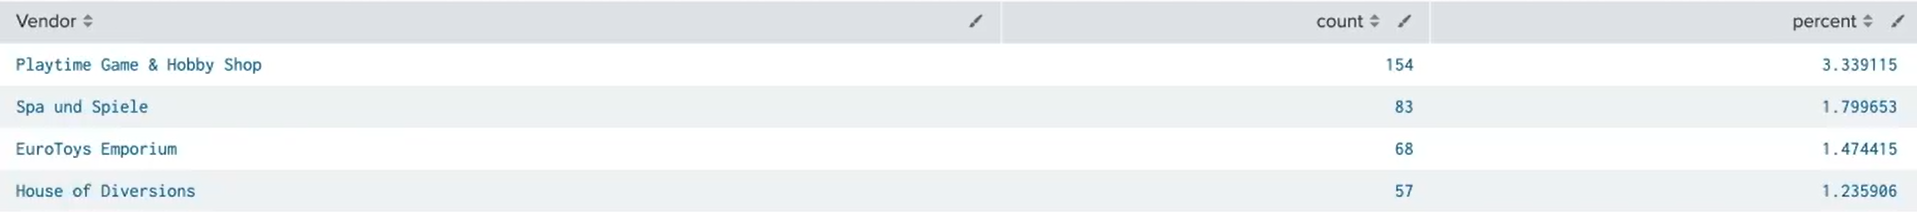
- Top Command Clauses
limit = int
countfield = string
percentfield = string
showcount = True/False
showperc = True/False
otherstr = string
index=sales sourcetype=vendor_sales
| top product_name by Vendor limit=3 countfield="Number of Sales" showperc=false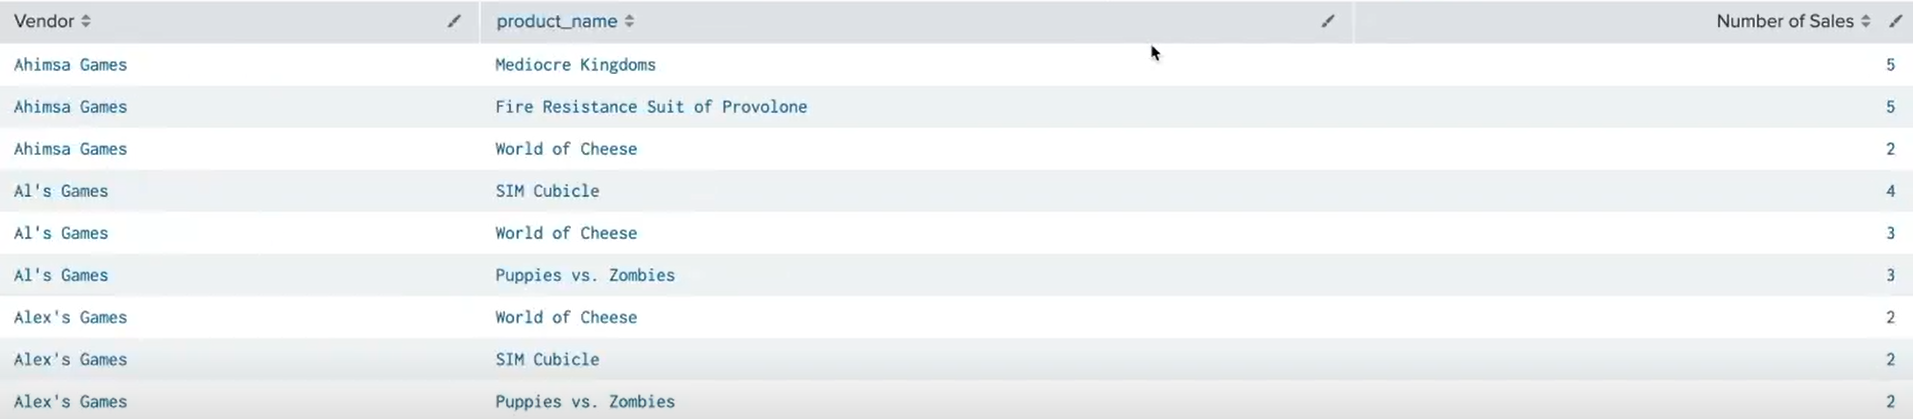
o | rare
index=sales sourcetype=vendor_sales
| rare product_name by Vendor limit=3 showperc=false countfield="Number of Sales" useother=true
o | stats
- Common Stats Functions
count
distinct count
sum
average
min
max
list
values
index=sales sourcetype=vendor_sales
| stats count as "Total Sales by Vendors" by product_name, categoryId, sale_price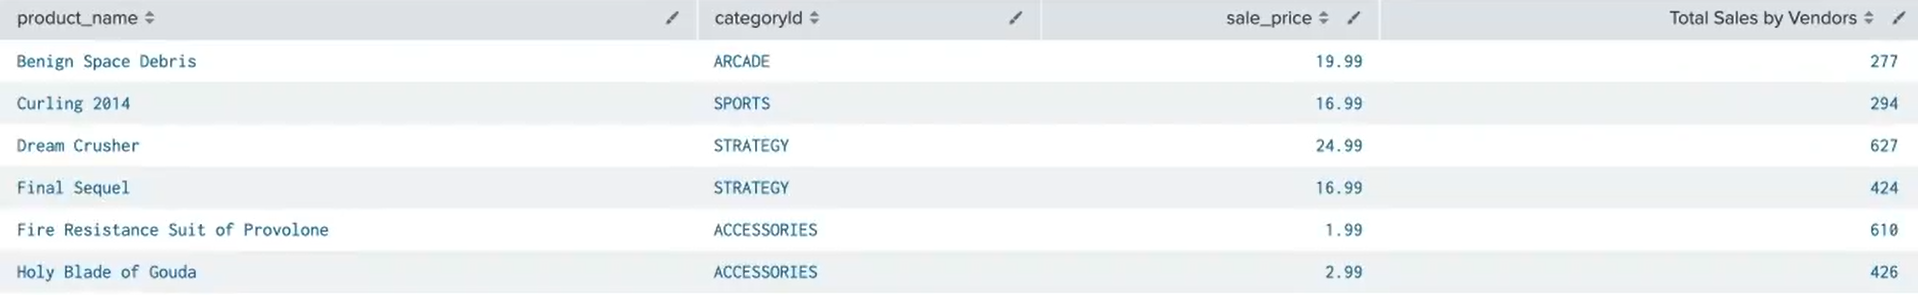
o | chart
index=web soucetype=access_combined status>299
| chart count over status by host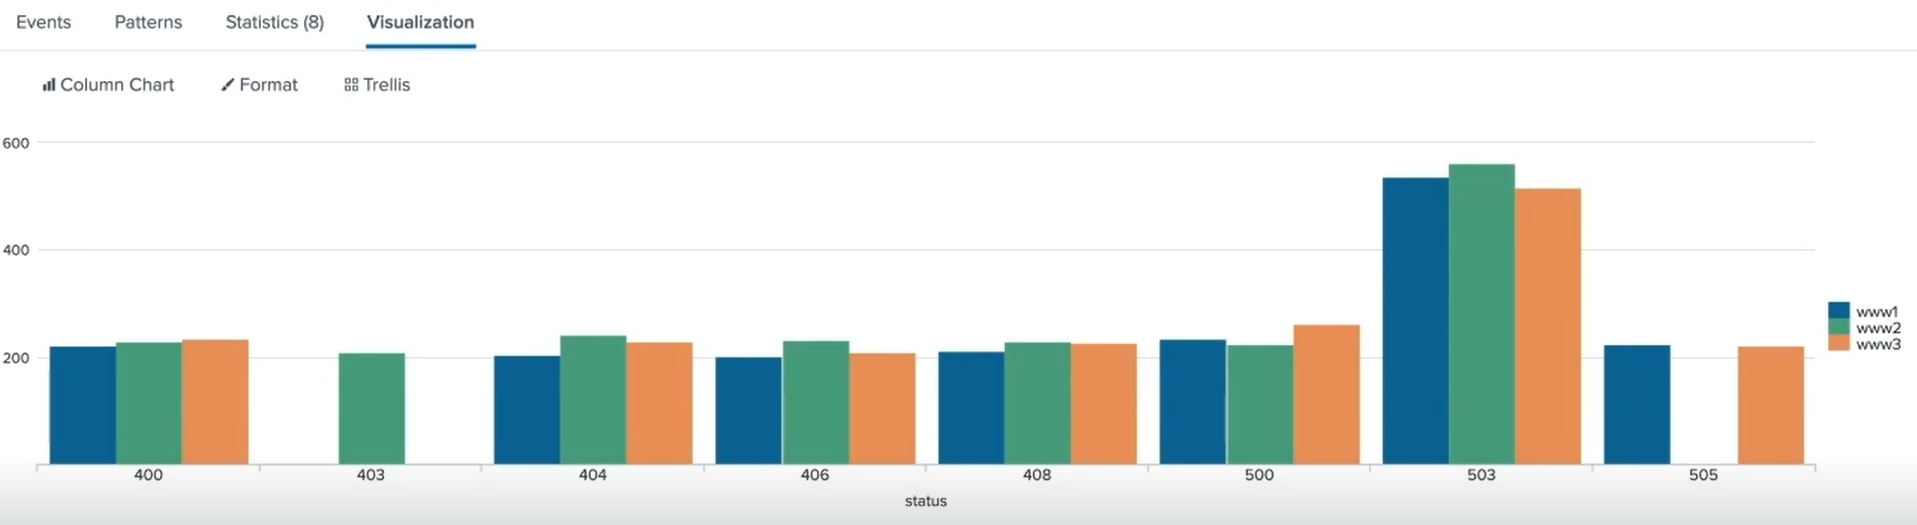
index=web soucetype=access_combined status>299 product_name=*
| chart count over host by product_name useother=f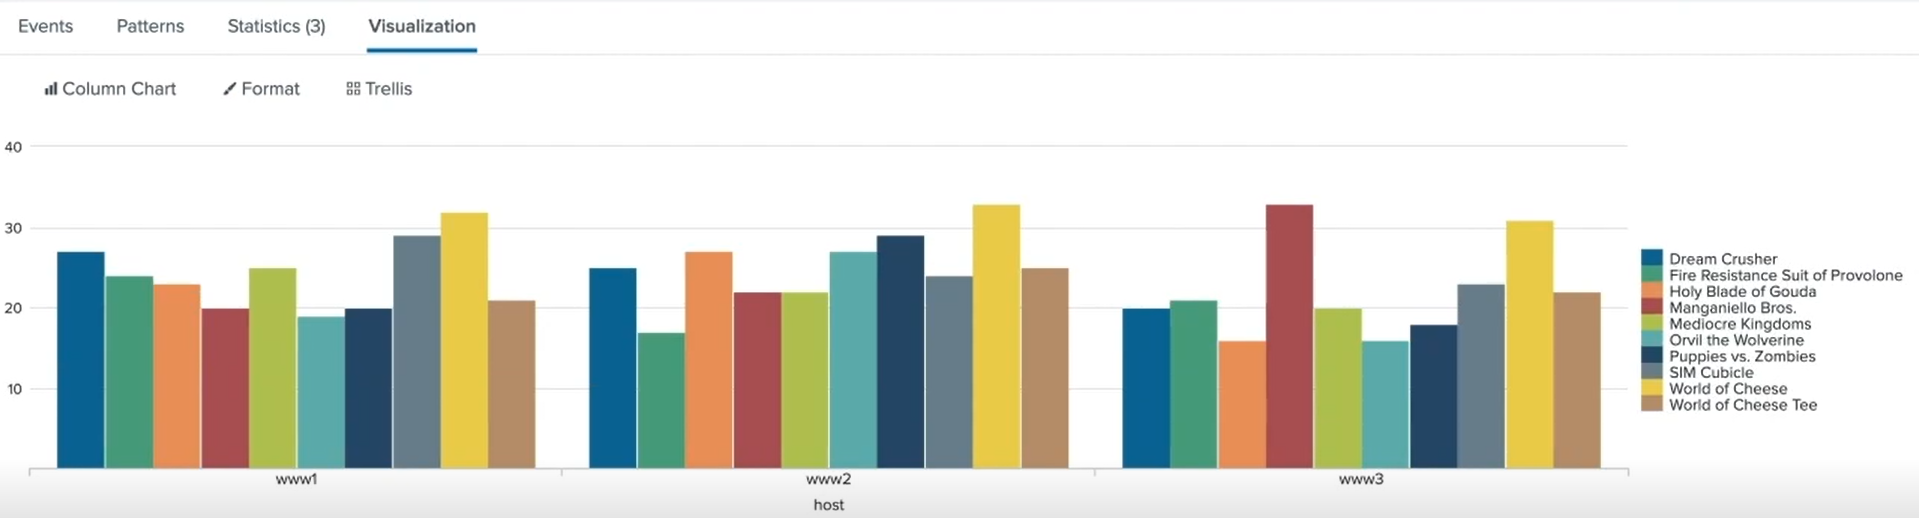
o | timechart
index=sales sourcetype=vendor_sales
| timechart span=12hr sum(price) by product_name 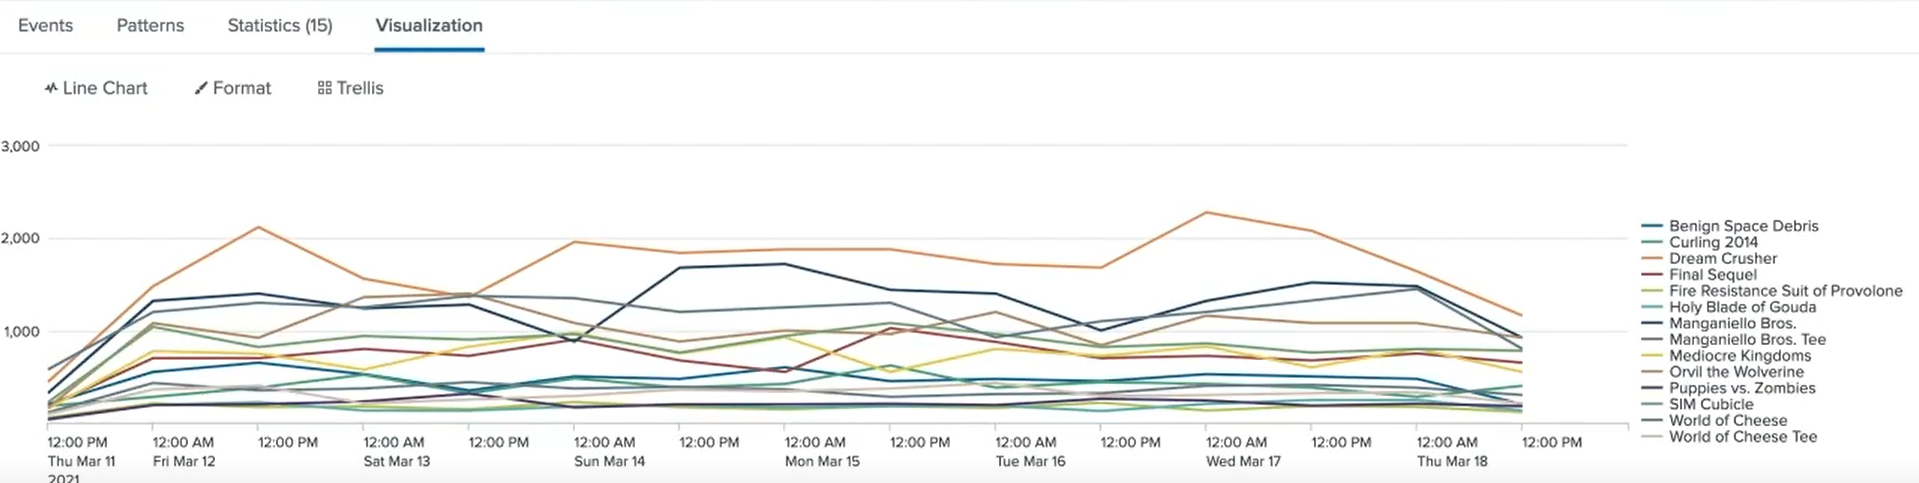
o | trendline
index=web sourcetype=access_combined action=purchase status=200
| timechart sum(price) as sales
| trendline wma2(sales) as trend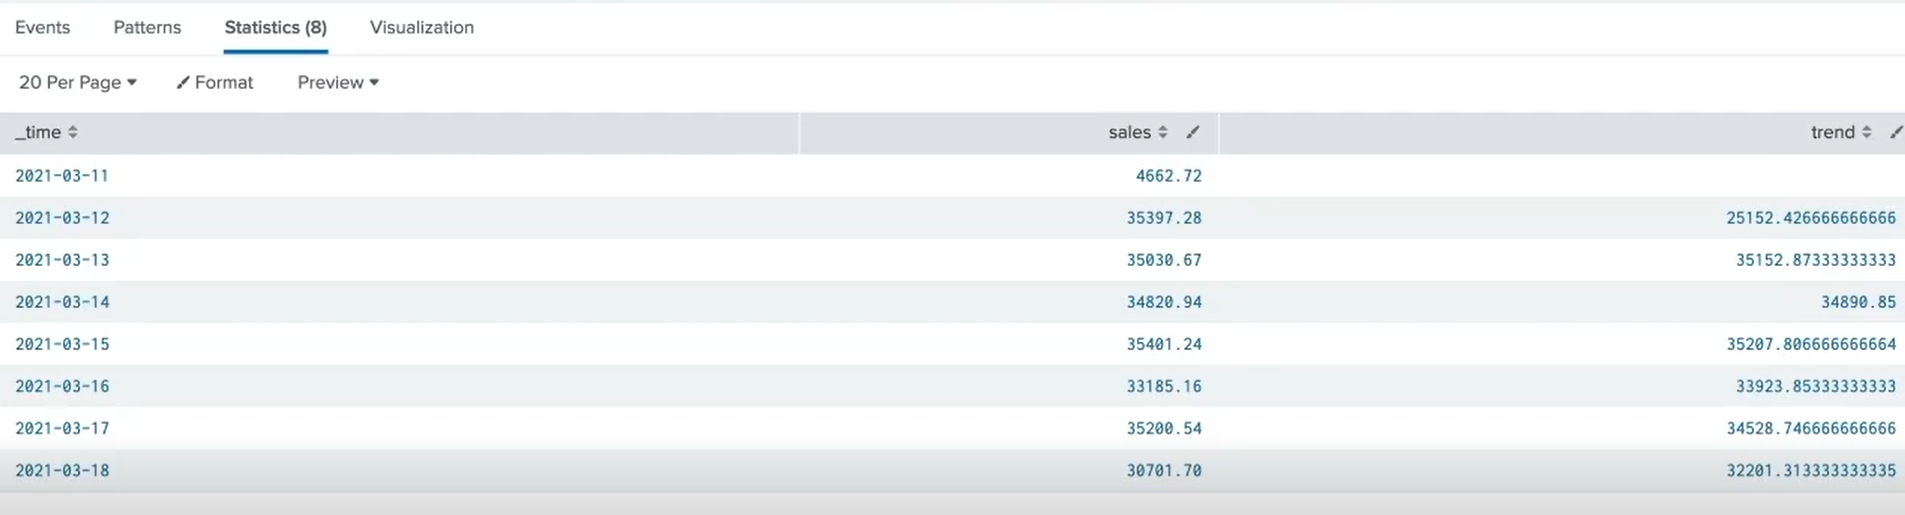
- Trendtype :
simple moving average (sma)
exponential moving average (ema)
weighted moving average (wma)
▪ Understand when to use different transforming commands
Topic 3 – Generating Maps
▪ Explore geographic visualization types
▪ Use commands specific to geographic data
o | iplocation
index=security sourcetype=linux_secure action=success src_ip!=10.*
| iplocation src_ip
o | geostats
index=sales sourcetype=vendor_sales
| geostats latfield=VendorLatitude longfield=VendorLongitude count by product_name globallimit=4
index=security sourcetype=linux_secure action=success src=ip!=10.*
| iplocation src_ip
| geostats latfield=lat longfield=lon counto geom
index=sales sourcetype=vendor_sales VendorID>=5000 AND VendorID<=5055
| stats count as Sales by VendorCountry
| geom geo_countries teatureIdField=VendorCountry
▪ Prepare data for use in a choropleth map
Topic 4 – Single Value Visualizations
▪ Use visual formatting options for single value visualizations
index=web sourcetype=access_combined action=purchase status=200
| stats sum(price) as Total
▪ Add a sparkline to a single value visualization
▪ Use the Trellis layout to split visualizations
▪ Use the gauge command
▪ Use the radial, filler, and marker gauge visualization types
Topic 5 – Visual Formatting
▪ Explore formatting options for statistical tables
index=web sourcetype=access_combined file=*
| chart sum(bytes) over host by file
▪ Create a chart overlay
▪ Explore formatting options for different types of visualizations
index=web sourcetype=access_combined action=purchase status=200
| timechart sum(price) as sales
| trendline wma2(sales) as trend
splunk