import pandas as pd

df = pd.read_csv('K-digital.csv')| name | local | title | period | |
|---|---|---|---|---|
| 0 | 주식회사코드스테이츠 | 서울 서초구 | 클라우드 서비스 운영과 개발을 한번에! DevOps 부트캠프 | 2022-04-15 ~ 2022-08-19 (2회차) |
| 1 | 대한상공회의소 충남인력개발원 | 충남 공주시 | 제조혁신 스마트팩토리 통합제어설계 실무 | 2022-04-19 ~ 2022-11-29 (2회차) |
1. 워드클라우드 (지역)
# 워드클라우드 IMPORT
from konlpy.tag import Okt # 형태소분석기 : Openkoreatext
from collections import Counter # 빈도 수 세기
from wordcloud import WordCloud, STOPWORDS # wordcloud 만들기
import matplotlib.pyplot as plt # 시각화
local = df['local']
local.to_csv('word.txt', encoding='utf-8-sig')text = open('word.txt', encoding='utf-8-sig').read()
# 형태소 분석기를 통해 명사만 추출하는 함수
def token_konlpy(text):
okt=Okt()
return [word for word in okt.nouns(text) if len(word)>1] # 1글자 명사는 제외
noun = token_konlpy(text)
len(noun)
noun_set = set(noun) # 중복값 제거
# stopwords 변수 만들어서, 차집합으로 빼기
len(noun_set)
# 텍스트 파일로 저장
f = open('noun_set.txt','w', encoding='utf-8')
f.write(str(noun_set))
f.close()
count = Counter(noun)
count.pop('서울') # 계속 중복되는 서울 제외
# 빈도수 상위 15개 까지 딕셔너리 형태로 자료 변환 {'noun':'key'}
word = dict(count.most_common(20))
#wordcloud 만들기
wc = WordCloud(max_font_size=200, font_path = 'C:\Windows\Fonts\malgun.ttf',background_color="white",width=2000, height=500).generate_from_frequencies(word) # font 경로 개별적으로 설정해야함
plt.figure(figsize = (40,40))
plt.imshow(wc)
plt.tight_layout(pad=0)
plt.axis('off')
plt.show()
word{'서초구': 15,
'동구': 10,
'대구': 9,
'강남구': 9,
'경기': 8,
'종로구': 8,
'광주': 6,
'인천': 6,
'중구': 5,
'부산': 4,
'관악구': 4,
'금천구': 4,
'성남시': 4,
'중원구': 4,
'미추홀': 4,
'부산진구': 3,
'서대문구': 3,
'구로구': 3,
'서구': 3,
'충남': 2}3. 지역 bar 차트
import matplotlib as mpl
# bar 차트 그리기

def showGraph(wordInfo):

    # font_location = 'C:\Windows\Fonts\HANDotumB.ttf' # font 경로 설정
    # font_name = font_manager.FontProperties(fname=font_location).get_name()

    plt.xlabel('주요 단어',fontsize=70)
    plt.ylabel('빈도수', fontsize=70)
    plt.grid(True)

    Sorted_Dict_Values = sorted(wordInfo.values(), reverse=True)
    Sorted_Dict_Keys = sorted(wordInfo, key=wordInfo.get, reverse=True)

    plt.bar(range(len(wordInfo)), Sorted_Dict_Values, align='center')
    plt.xticks(range(len(wordInfo)), list(Sorted_Dict_Keys), rotation='70')
    plt.rcParams["figure.figsize"] = (50,30)
    mpl.rcParams["font.size"] = 50

    plt.show()

word2= dict(count.most_common(20)) # 빈도 수 상위 20개로 word2 생성

showGraph(word2)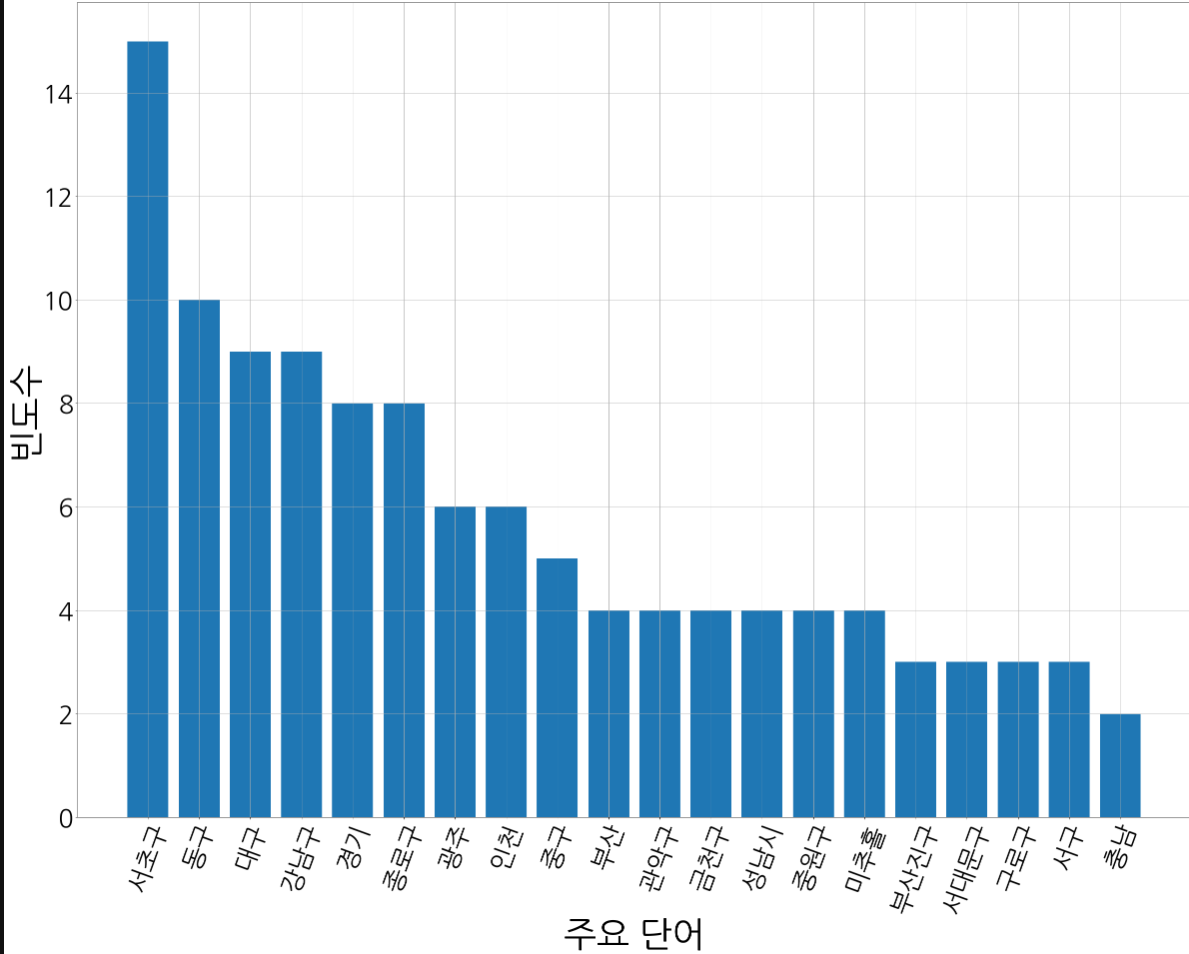

나무를 심는 사람