End-to-End ML project example
주제 : 주택값 예측 문제
문제 정의
지도학습 / 비지도학습 / 강화학습 : label이 있기 때문이다
분류 문제 / 회귀문제 :
배치학습 / 온라인 학습
성능측정지표 선택
평균 제곱근 오차(root mean square error, RSME)
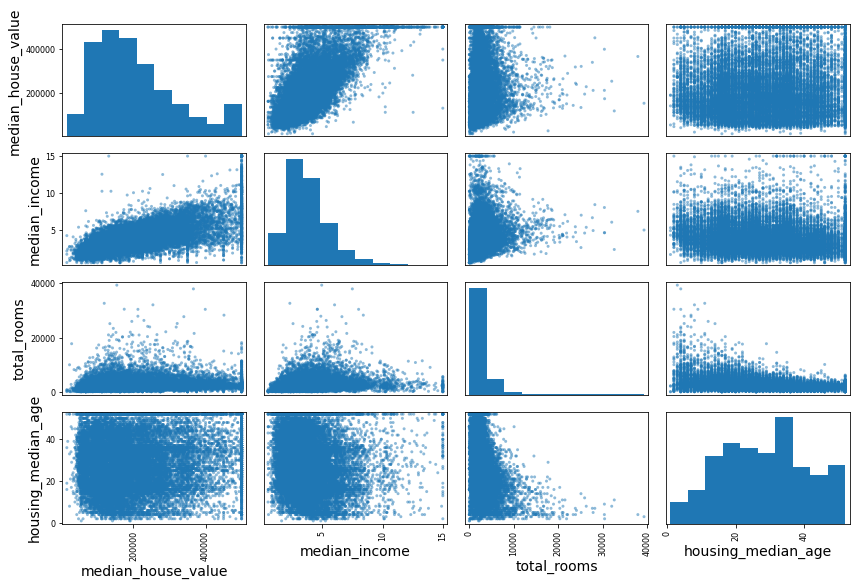
데이터 살펴보기
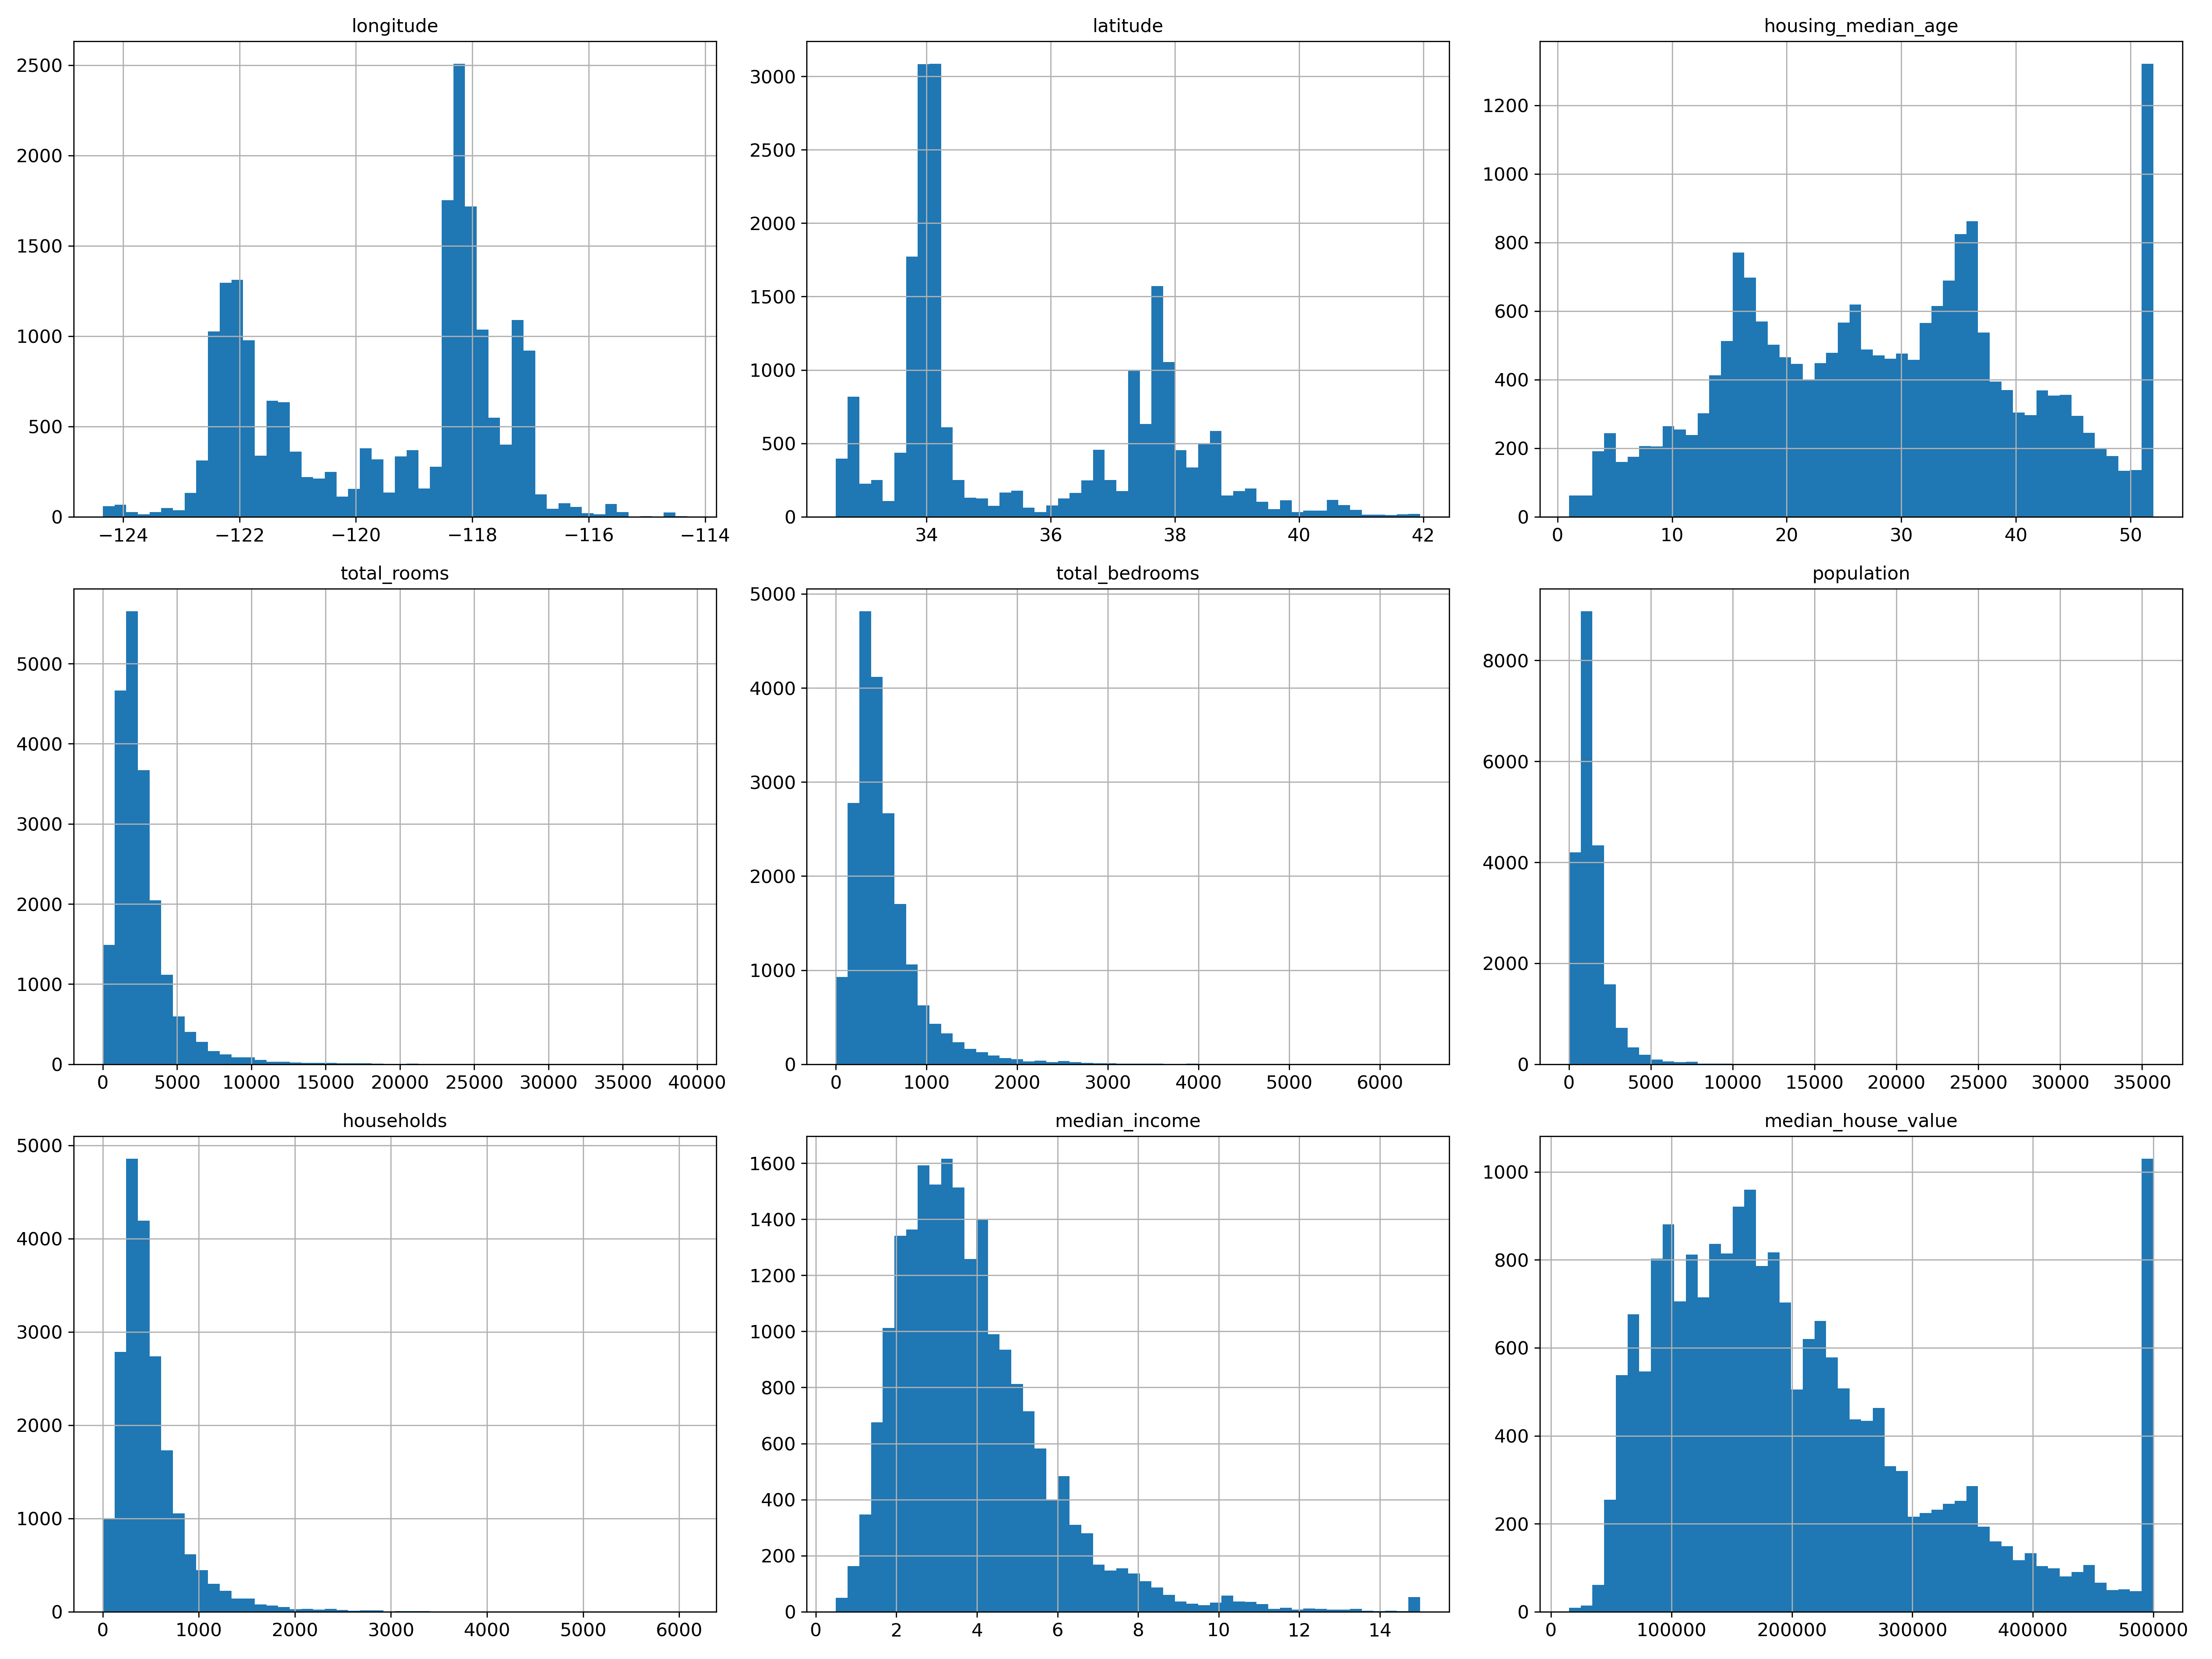
median_house_value, housing_median_age가 x축 50 이상에서 갑자기 이상치를 보이는데,
현업일 경우에는 해당 데이터 업무 수행자에게 문의가 필요하다.
예를 들어 50이상(60, 70 등)을 50으로 묶었을 수도 있고, 오류일 수도 있고, 확인이 필요한 부분이다.
이상하다고 판단되면, 제외하는 등의 조치가 필요할 수 있다.
test data 만들기
데이터를 train & test 데이터로 분리한다.
이 때, index가 있는 데이터인 경우 섞을 때 index 또한 섞이므로 다시 부여해줄 필요가 있다.
data sampling
집값이 수입과 관련이 있을 것이라는 가정하에 다음 과정을 살펴본다.
housing["median_income"].hist()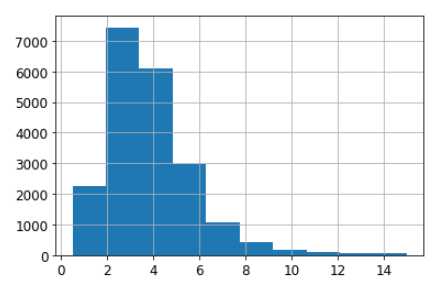
pandas의 기능 중 데이터를 구간 별로 묶을 수 있다.
housing["income_cat"] = pd.cut(housing["median_income"],
                              bins=[0., 1.5, 3.0, 4.5, 6., np.inf],
                              labels = [1, 2, 3, 4, 5])

housing["income_cat"].hist()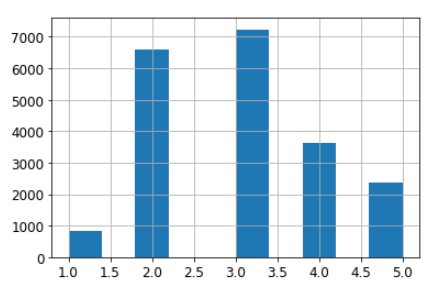
그리고 이렇게 그룹을 묶어낸 것을 바탕으로 train & test set을 분리할 수 있다.
from sklearn.model_selection import StratifiedShuffleSplit

split = StratifiedShuffleSplit(n_splits=1, test_size=0.2, random_state=50)
for train_index, test_index in split.split(housing, housing["income_cat"]):
    strat_train_set = housing.loc[train_index]
    strat_test_set = housing.loc[test_index]
housing["income_cat"].value_counts() / len(housing)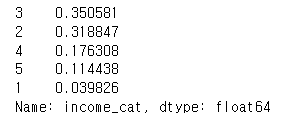
strat_test_set["income_cat"].value_counts() / len(strat_test_set)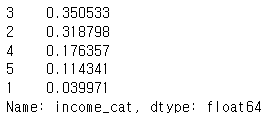
얼추 미리 sampling 한 것과 비슷한 비율을 유지하는 것을 알 수 있다.
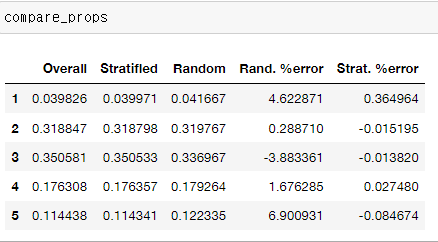
이 과정을 왜 수행하냐면, 이렇게 진행했을 때 다음과 같은 결과를 얻을 수 있기 때문이다.
from sklearn.model_selection import train_test_split

def income_cat_proportions(data):
    return data["income_cat"].value_counts() / len(data)

train_set, test_set = train_test_split(housing, test_size=0.2, random_state=50)

compare_props = pd.DataFrame({
    "Overall" : income_cat_proportions(housing),
    "Stratified": income_cat_proportions(strat_test_set),
    "Random": income_cat_proportions(test_set),
}).sort_index()
compare_props["Rand. %error"] = 100 * compare_props["Random"] / compare_props["Overall"]- 100
compare_props["Strat. %error"] = 100 * compare_props["Stratified"] / compare_props["Overall"] - 100- 오차가 더 적은 모습
상관관계 분석
corr_matrix = housing.corr()

corr_matrix["median_house_value"].sort_values(ascending=False)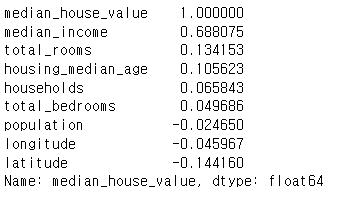
특성과 특성을 조합해서 다른 유의미한 특성을 만들어낼 수 있다는 것도 유의해야한다.
데이터 정제
누락된 특성을 다루는 방법으로는
- 해당 구역을 제거(행)
- 해당 특성을 제거(열)
- 어떤 값으로 채움(0, 평균, 중간값 등)
이 있다.
sample_incomplete_rows = housing[housing.isnull().any(axis=1)].head() # True if there is a null feature
sample_incomplete_rows
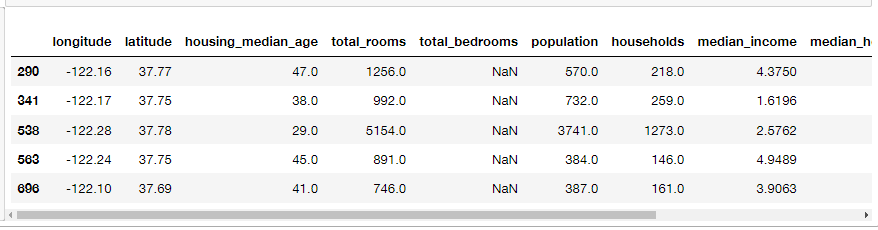
total_bedrooms에 누락값이 있다.

오래 공부하는 사람