Text Mining & Data Visualization
VS model in practice
- Documen & query are represented by term vectors
- Terms are not necessarily orthogonal to each other
- Synonymy : car vs automobile
- Polysemy : fly (action vs insect)
- Terms are not necessarily orthogonal to each other
How to build such a space
- Automatic temr expansion
- Construction of thesaurus
- Clustering of words
- Word sense disambiguation
- Dictionary-based
- Relation between a pair of words should be similar as in text and dictionary's description
- Explore word usage context
- Dictionary-based
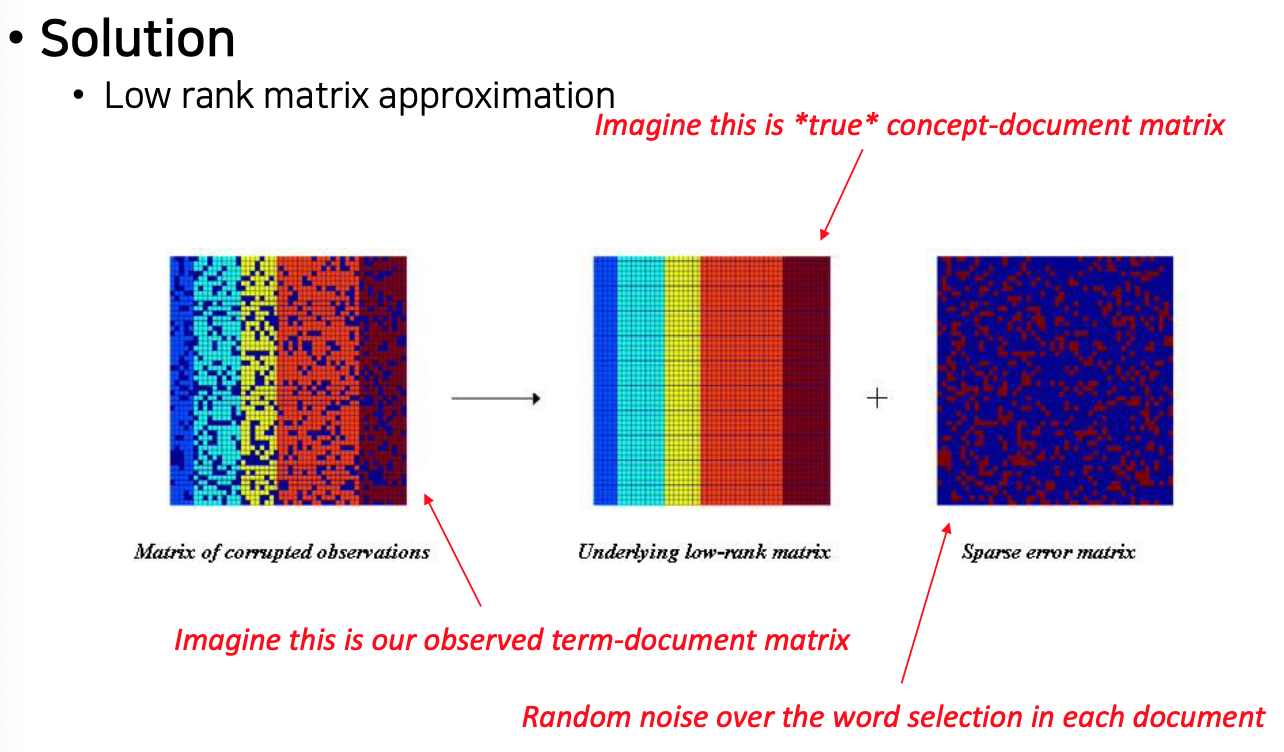
- Latent Semantic Analysis (LSA)
- Assumption : there is some underlying latent semantic structure in the data that is partially obscured by the randomness of word choice with recpect to text generation
- It means : the observed term-document association data is contaminated by random noise
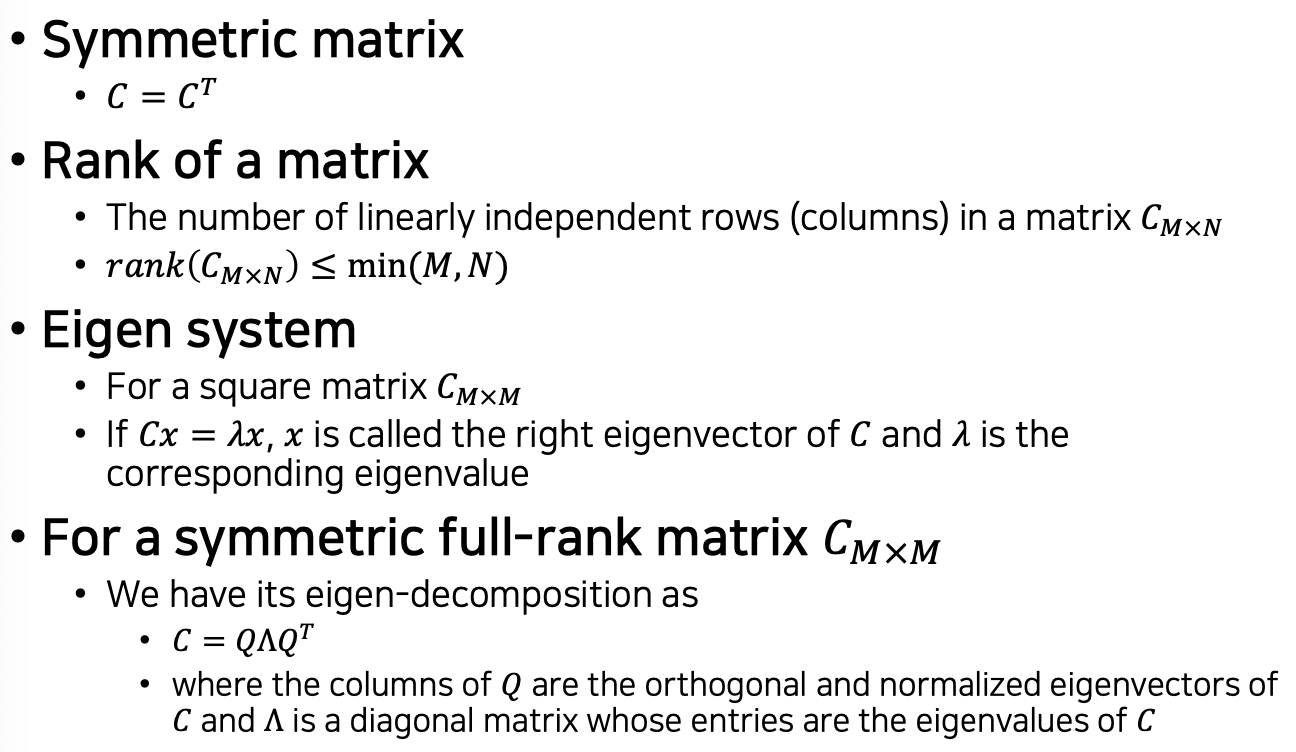
Basic concepts in linear algebra
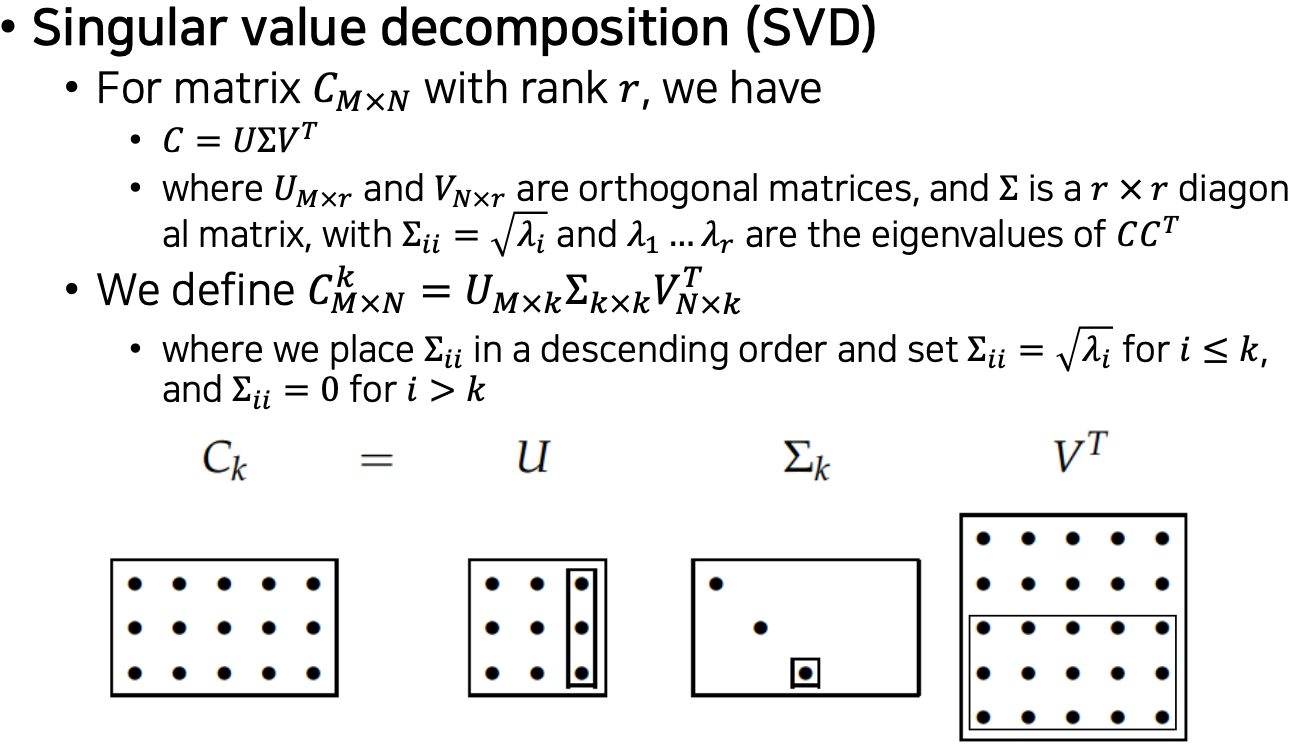
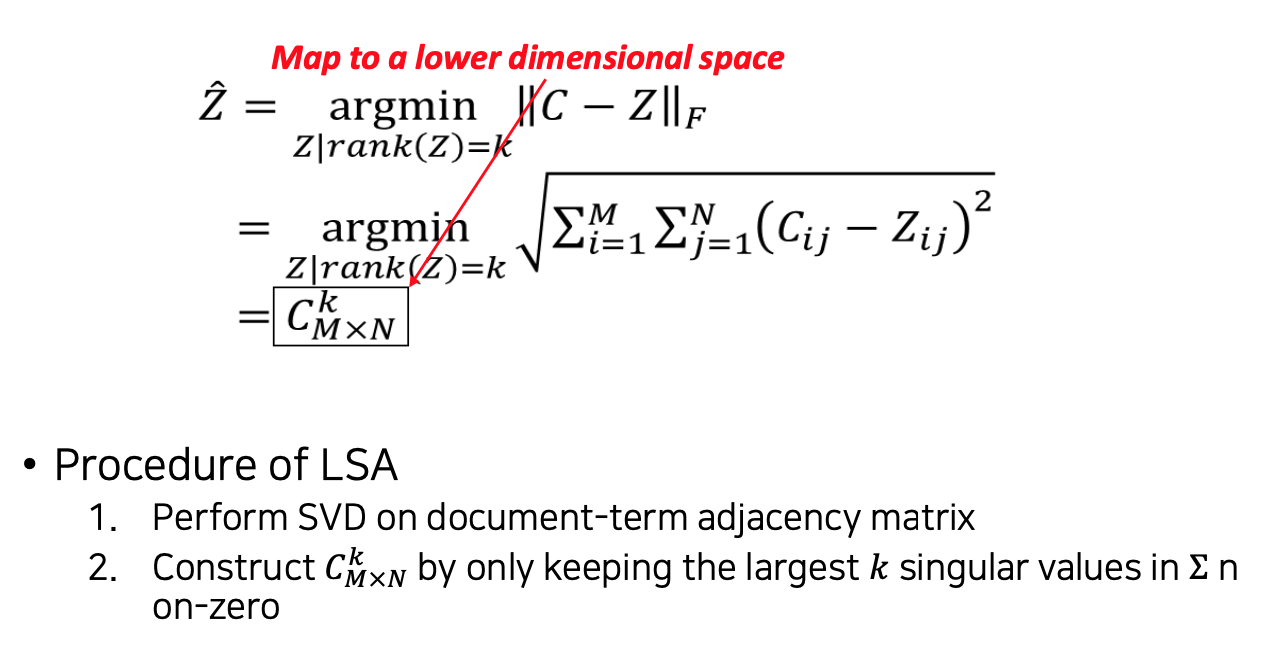
LSA
- Solve LSA by SVD
What are those dimensions in LSA
- Principle component analysis (PCA)
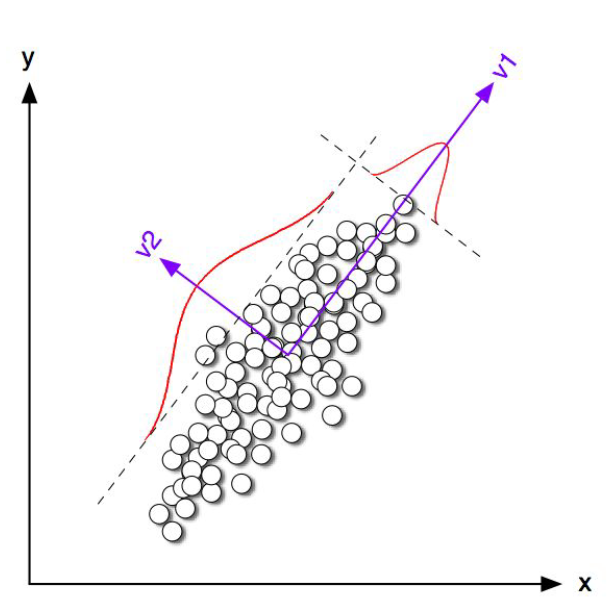
v1, v2와 같은핵심 축들을 확인할 수 있다.
LSA beyond text
- Collaborative filtering
- User item matrix stores for each user the rating for the item
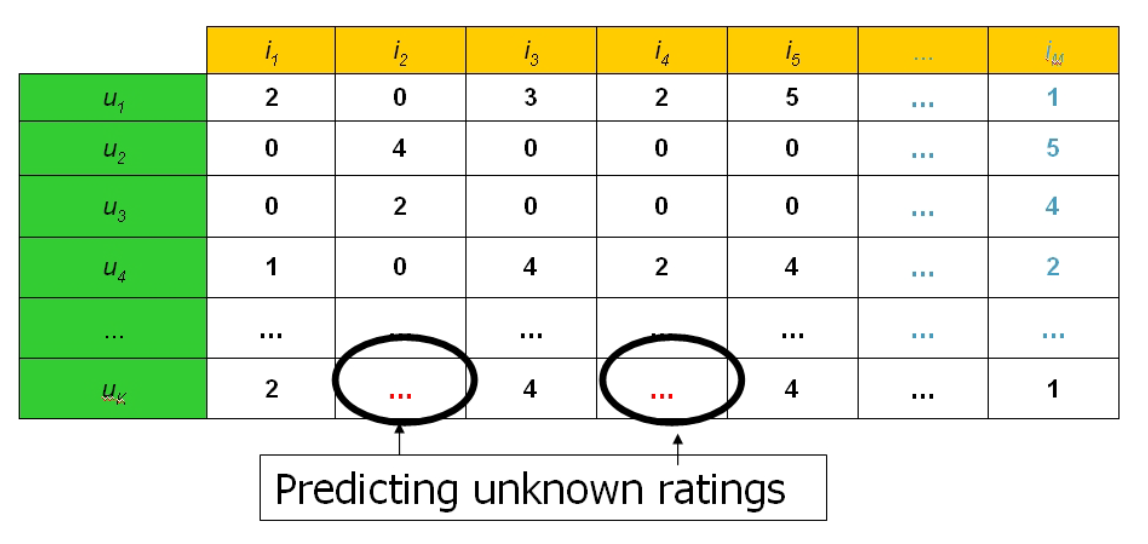
uk의 유저가 i2, i4에 대해서 구매를 했는지의 여부를 모르기 때문에 i1, i3, i5등 과 같은 알 수 있는 정보를 다른 u4와 같은 유사하게 구매한 인원의 값을 보고 유추할 수 있다.
Data Visualization
Overview
- Definiiton : To represent the data (or result) for better understanding
- How can I represent what my dadat (or result) show?
- Why visualize?
- giving better, clear understanding to audiences (including you as well)
- Can get perceptual motivations!
Principles on Visualization
- Be true to your research
- Design your display to illustrate a particular point
- Maximize information, minimize ink
- Use the simplest possible representation for the bits you want to convey
- Organize hierarchically
- What should a viewer see first? what if they look deeper?
인위적인 조작 이외에 결과에 대해서 검증을 해라. 그렇지 않다면 의도하지 않는 조작이 될 수 있다.
청중에게 보여줄 가장 핵심적인 것 몇개만 나열하라.
가장 우선적인 것을 보여주고 서브를 포함시켜라
Data Types & Aesthetics
- Data Types
- Nominal-values ex) color, profession
- Ordinal-values ex) military or academic rank
- Numeric-real numbers ex) integer or real numbers
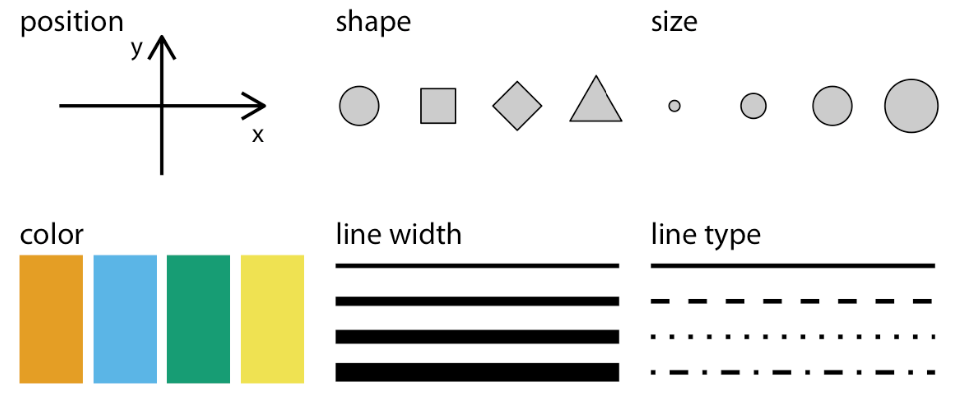
- Aesthetics
- Shape
- Color
- Size
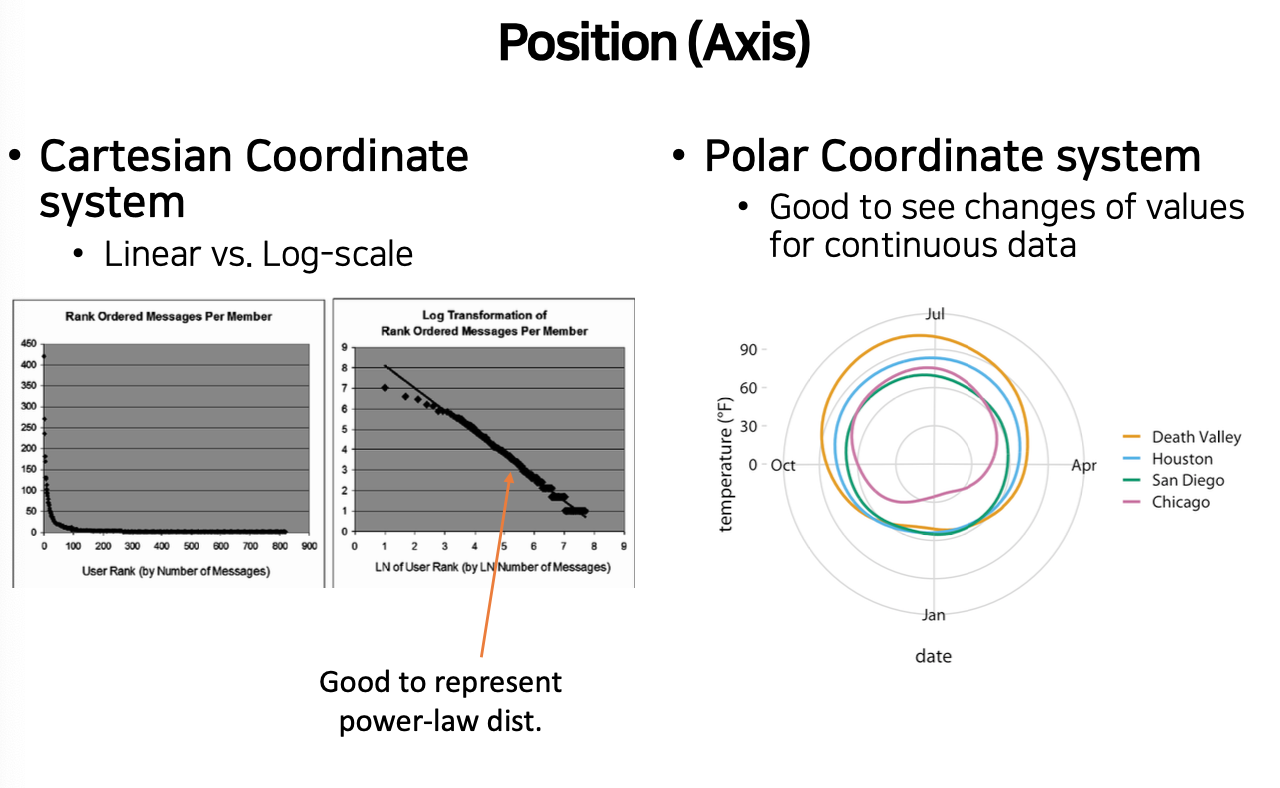
- Position (Axis)
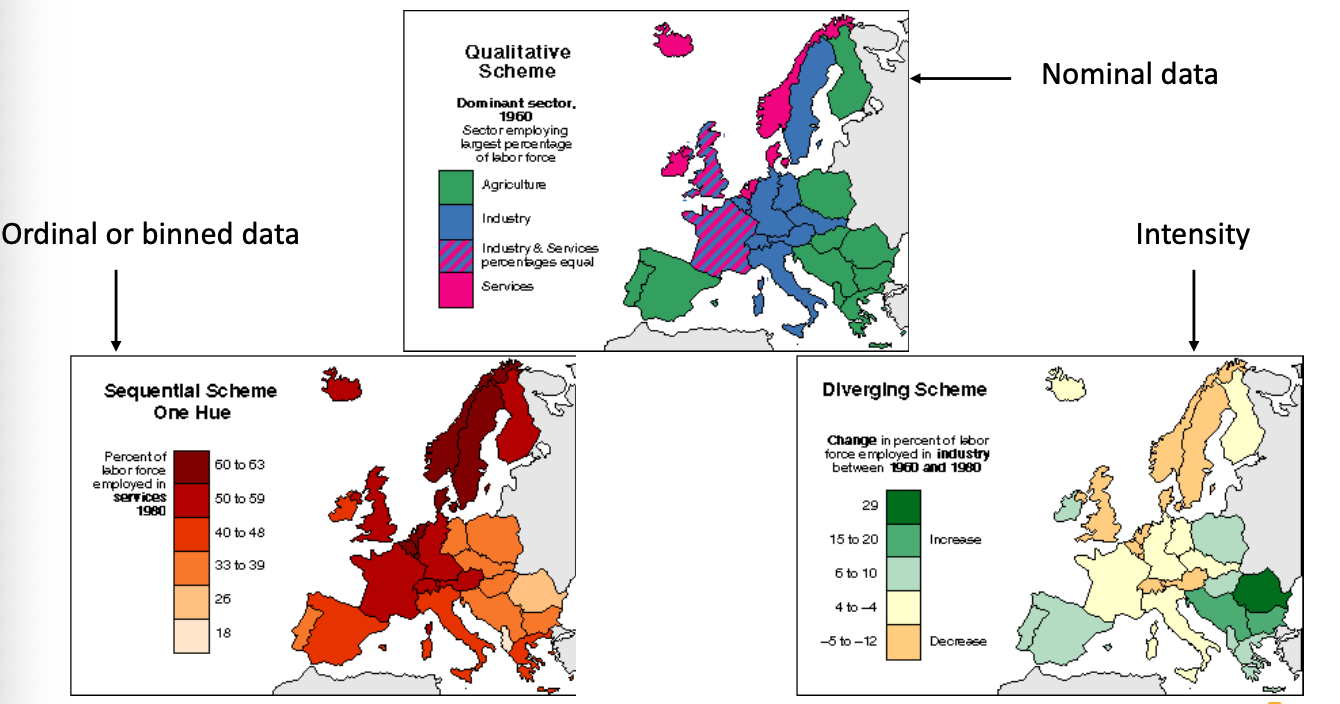
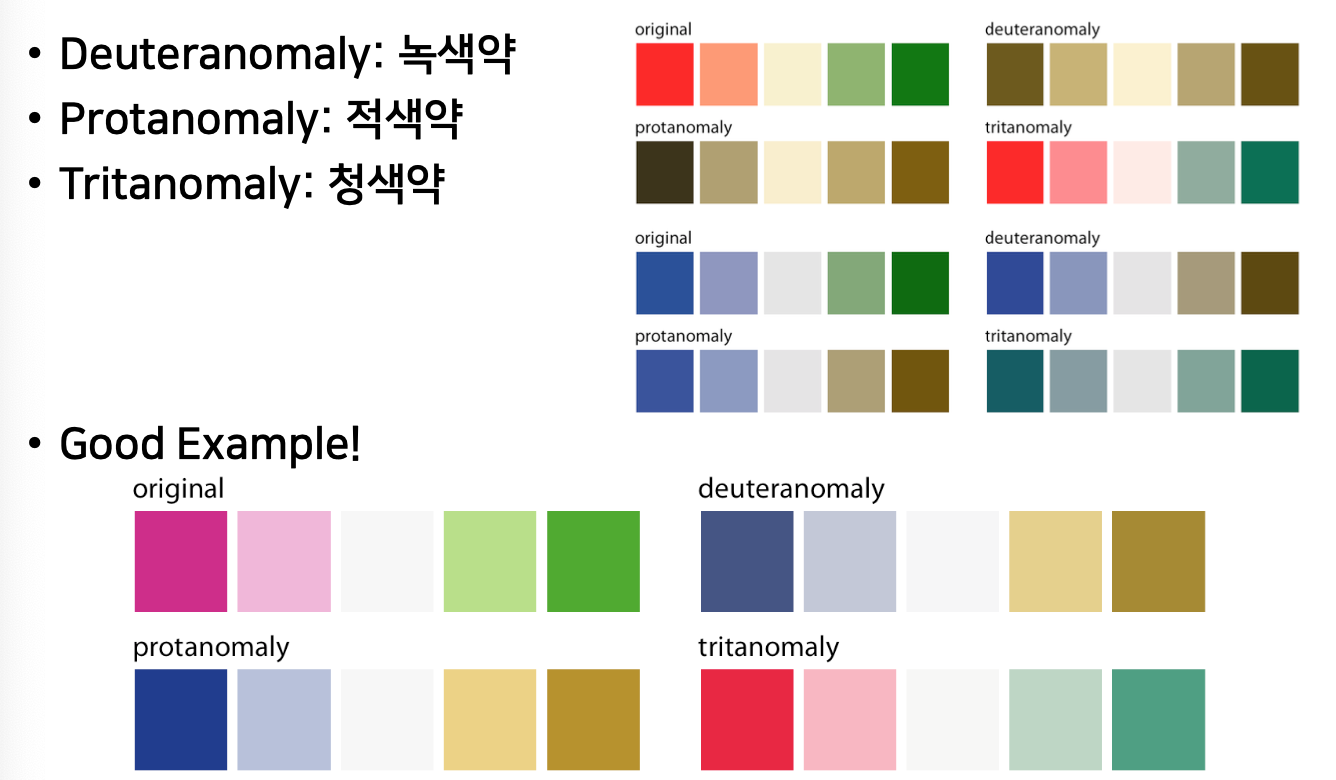
How to Choose Colors?
- Qualitative, Sequential, Diverging colors
- 가장 두드러지게 색이 구분, 같은 색과 명도의 차이, 양 끝 단의 차이
- 가장 두드러지게 색이 구분, 같은 색과 명도의 차이, 양 끝 단의 차이
Popular Plots for Visualization
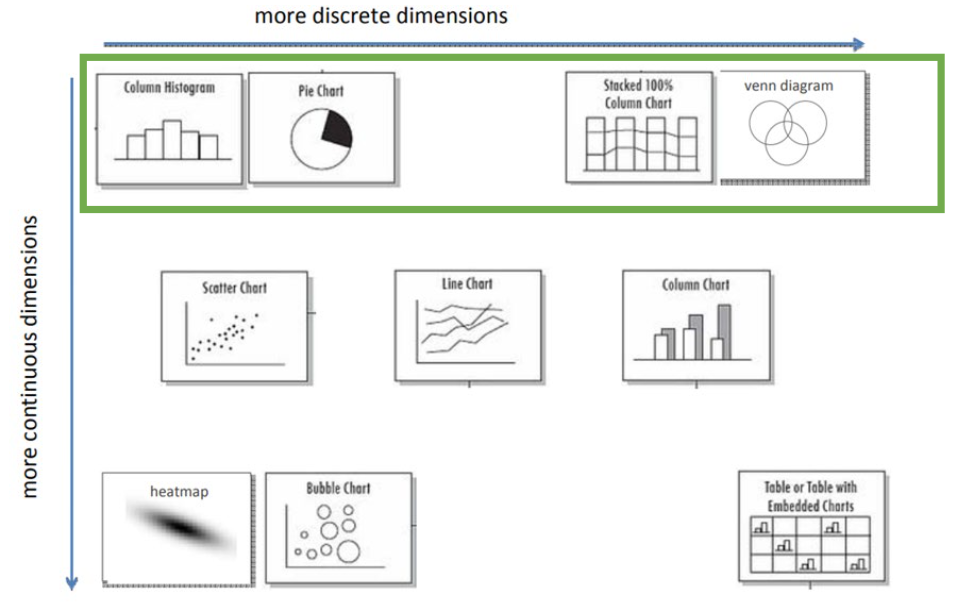
Histograms
- One dimentional
- Shows shape by binning a continuous distribution
- Grouped histogram can indicate multiple discrete categories -> Good for comparison
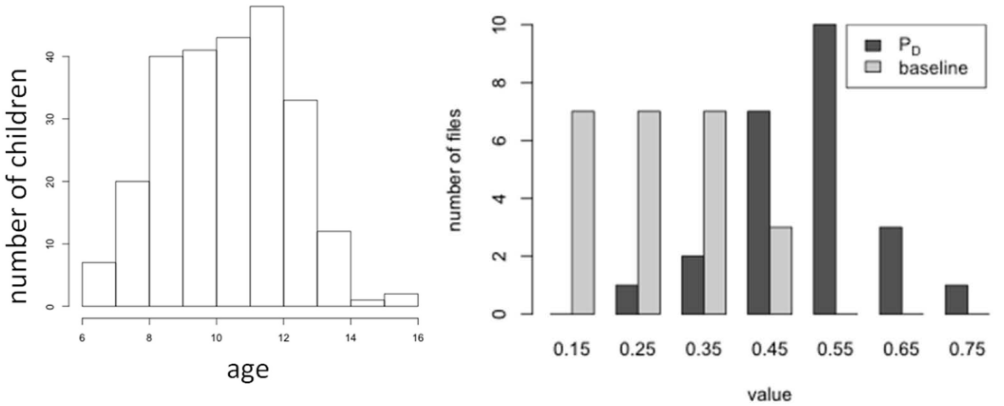
하나의 데이터 종류에 대한 분포를 보기 위해 주로 사용한다.
Pie Chart
- A whole split into parts
- Emphasizes that all parts sum to a constant
- Single dimension with discrete categories
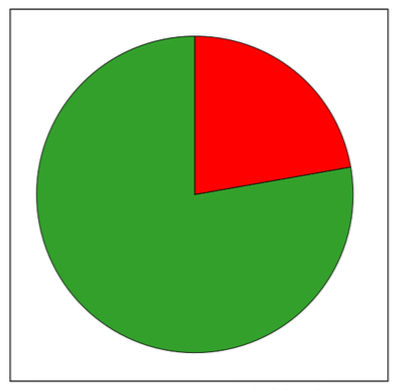
전체 대비 제일 많은 것, 적은 것 상대적인 비율을 보기 위해 주로 사용한다.
Stacked Bar Plot
- Whole split into parts
- Easy to compare
- Often beter than pie chart
- Can have multiple discrete dimensions
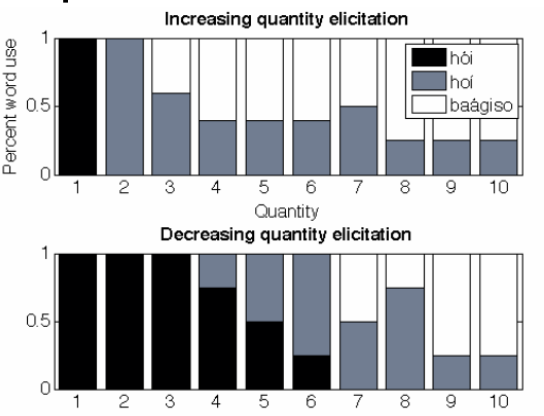
비율이 시간이 지남에 따라 어떻게 변하는지 보기 위해 주로 사용한다.
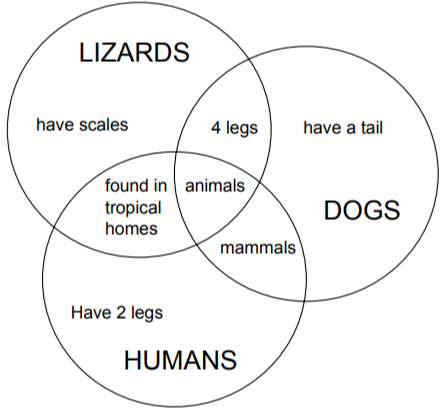
Venn diagram
- Shows overlpa between discrete groups
- Sometimes the only way to display overlapping sets
- No overlapping ratio
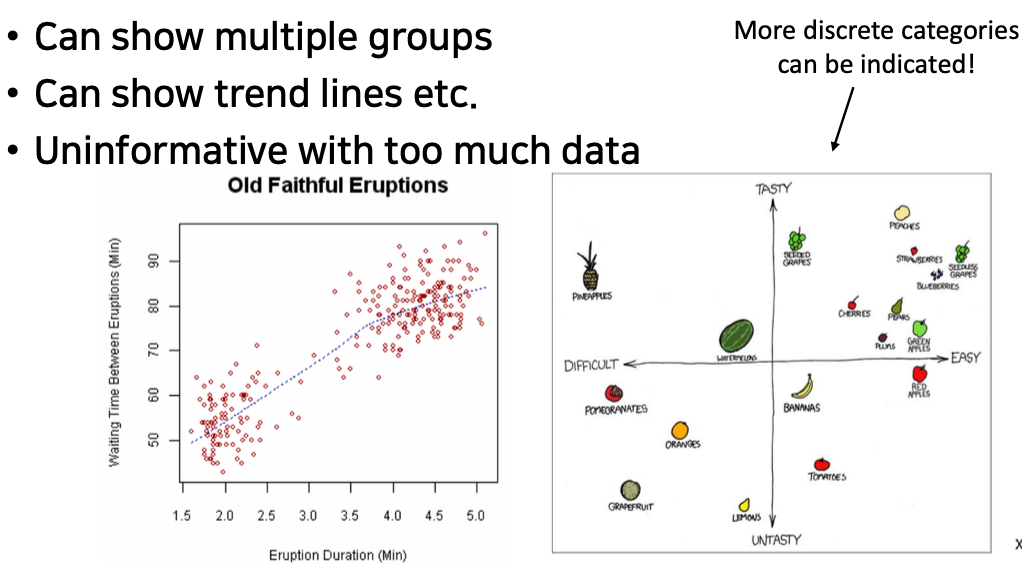
Scatter Plots
- Relationship between observations on two continous dimentions
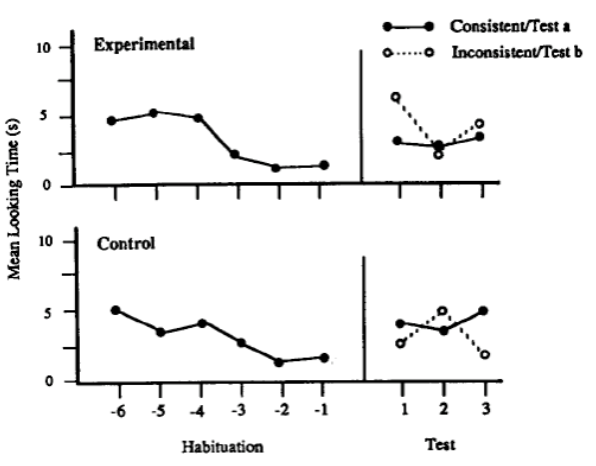
Line Plot
- Good for showing one variable (ex, time) as continuous even though you have discrete measures
- Can compare several discrete groups
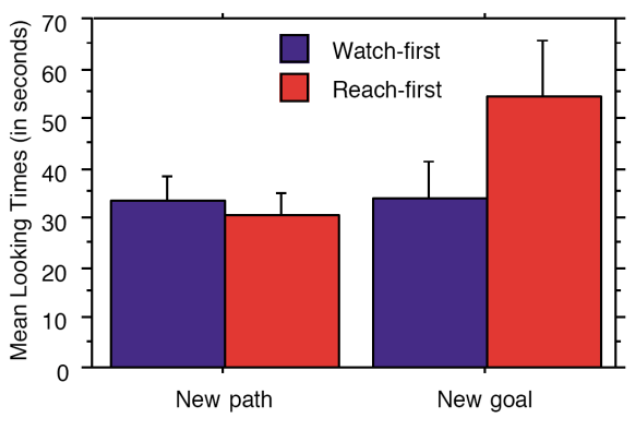
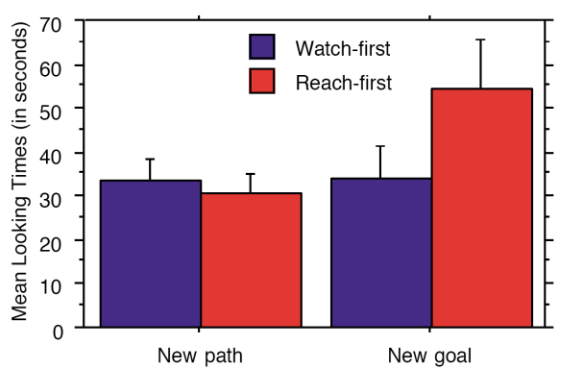
Bar Plots
- Can be used for lots of discrete grouping factors
- Natural semantics of grouping
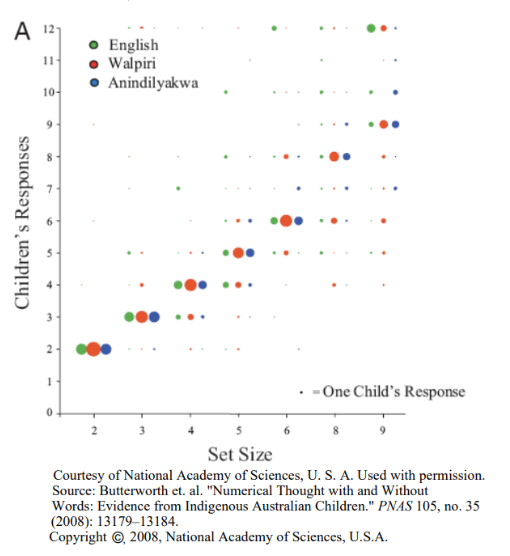
- Conceals data distribution (Less information)
(CF) Issues on bar chart
- Even same data sets, It's different to recognize information as shape.
ex) 첫번째, 나이대에 따라 인컴이 더 잘 들어오는구나. 두번째, Asian이 돈을 많이 버는구나.
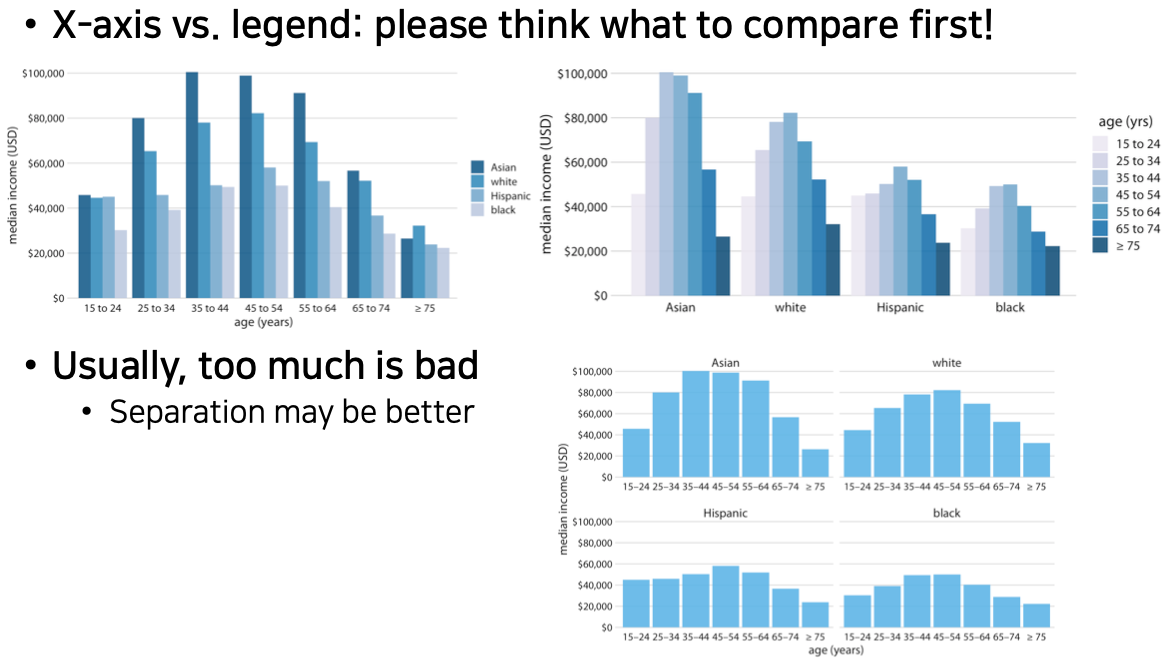
가장 전달하고 싶은 메세지를 선정하여 잘 보일 수 있게 해야한다.
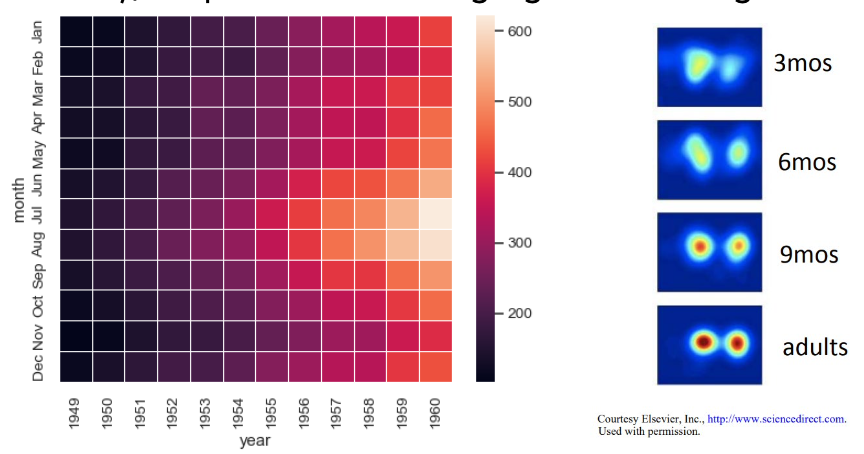
Heatmap
- Works very well when there are natural semantics or comparing intensity of data
- Color mapping can be problematic
- Usually, sequential or diverging colors are good
Bubble Plot
- Extension of scatter plot (+ one dimension)
- Size is not perfectly quantitative
Visualizing Distributions
- The first step to observe "how data is shaped" without any manipulation
- Power-law, normal
- How?
- Using error bars
- Histogram after binning -> kernel density estimation
- Bos, violin, strip, sina, ridgeline
- CDF & QQ-plots
Using Error Bars for Distribution
- Mean + standard deviation
- Can be used for lots of discrete grouping factors
- Good to compare
- Conceals data distribution (Less information)
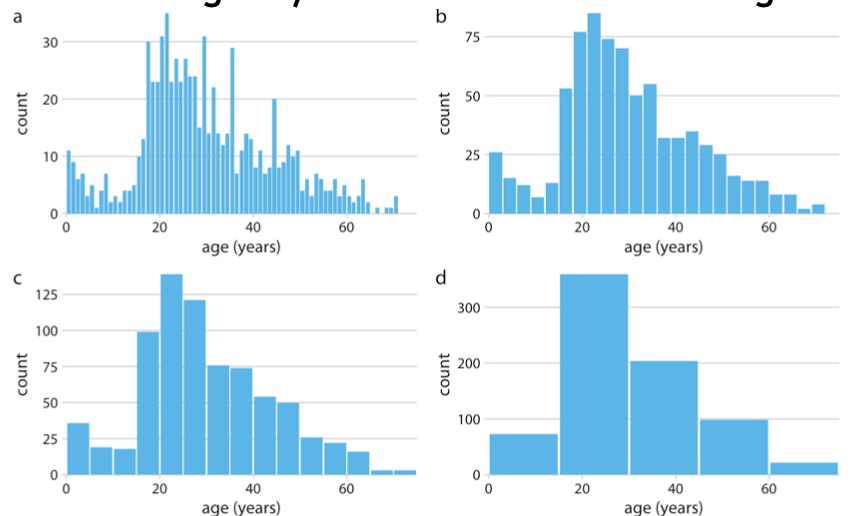
Histogram for Distribution
- Binning is essential process
- Good to see distribution of one variable
- Different binning may result in different messages
Histogram to Kernel Density Estimation
- Discrete variable -> Continuous trends!
- 함수로 그래프를 그리기 때문에, 실제 범위가 아닌 부분을 cut을 해주어야 한다. (ex, 나이는 0부터)
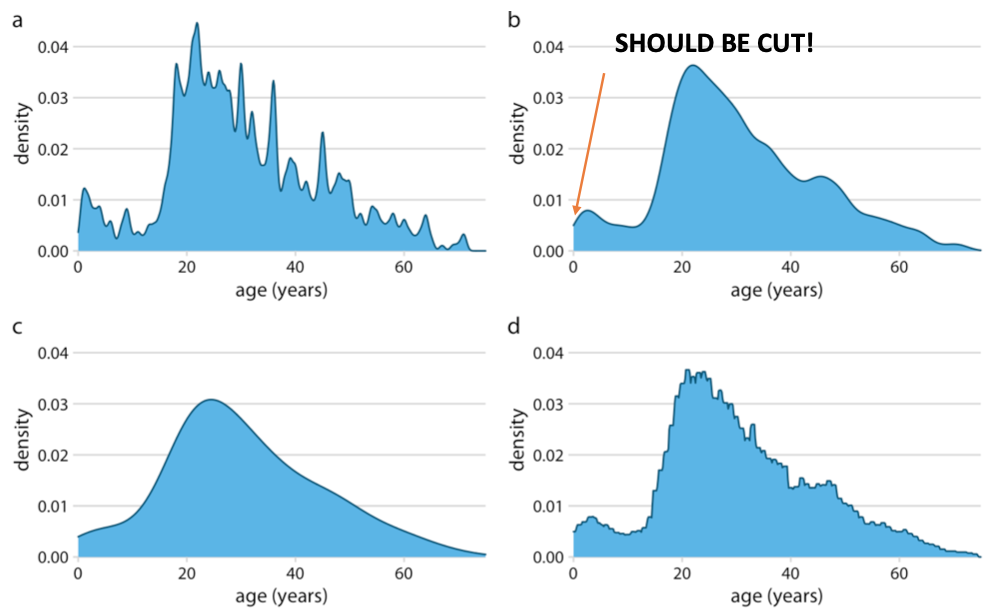
수식으로 변환이 된다는 것은 다른 데이터에 적용할 수도 있다는 뜻. 수학적 모델 제시
Comparing Distributions
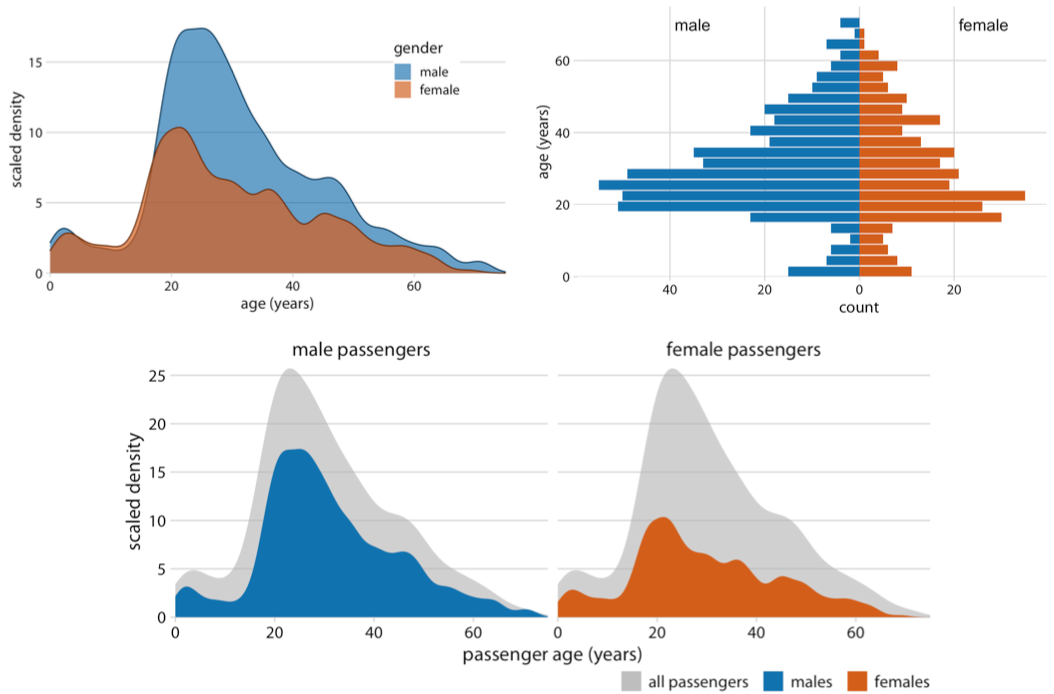
How about 3 or more distributions?
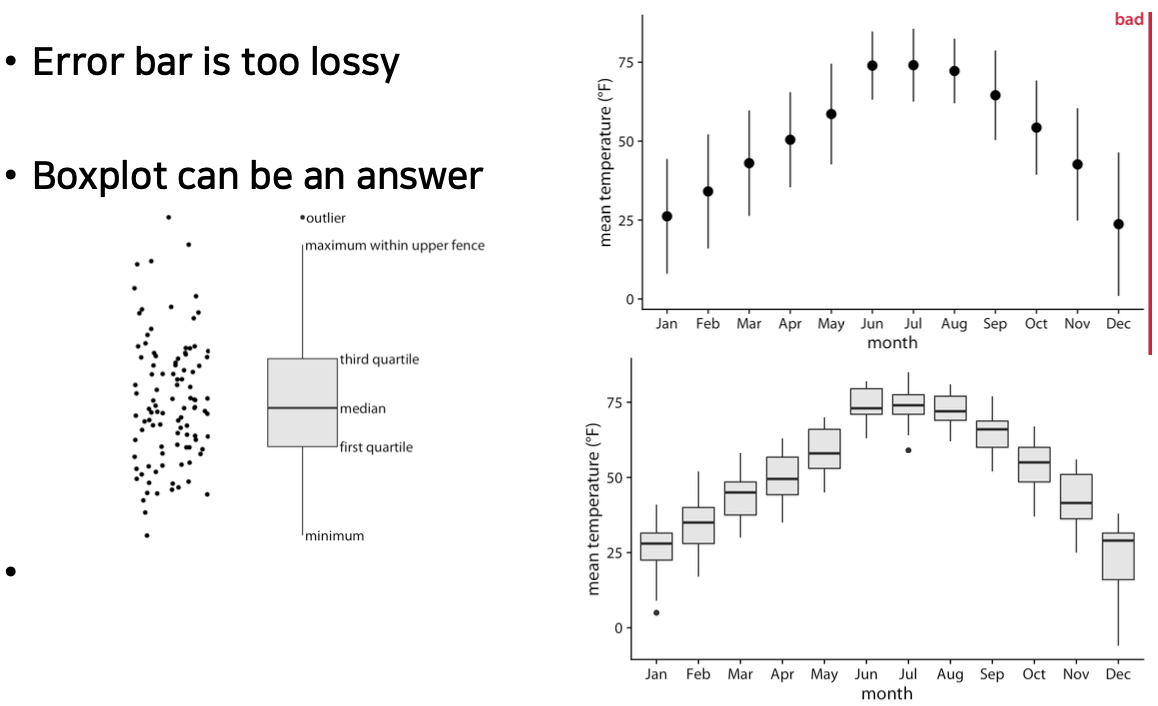
범위에서 한개의 컬럼을 가지고 min, quater, max의 값의 위치를 박스 형태로 구성
Violin plot is a super set of boxplot
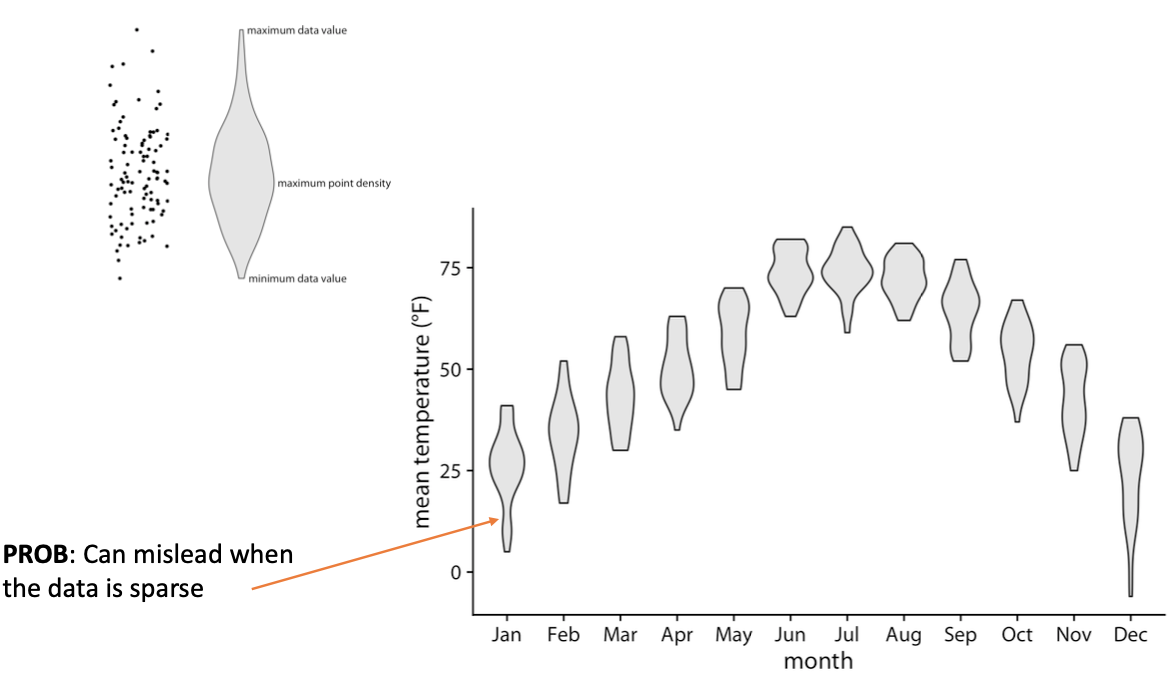
데이터가 연결되어야하기 때문에 값이 없는 부분이 있더라도 연결된다.
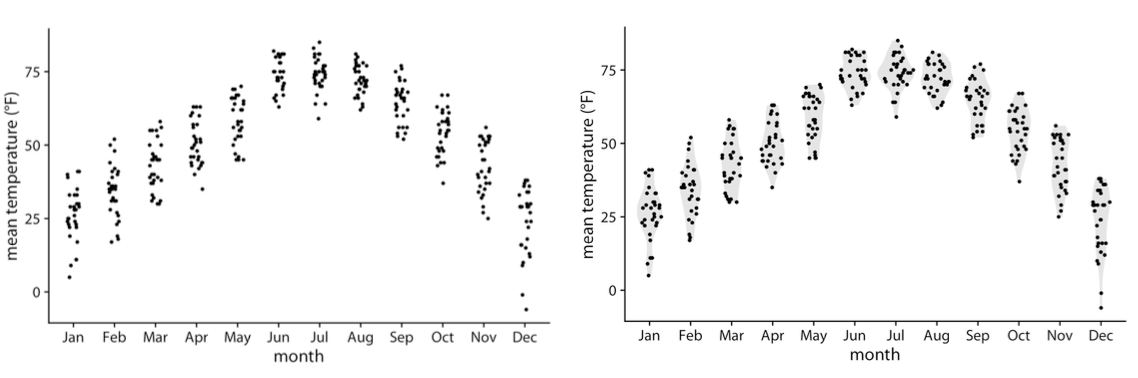
Strip or Sina plot May Be Better
- Strip : Using jitter to represent density
- Sina : Violin + Strip
If You Have More Distributions...
- Ridgeline Plots can be a solution
-WARNING : you should be enough number of data
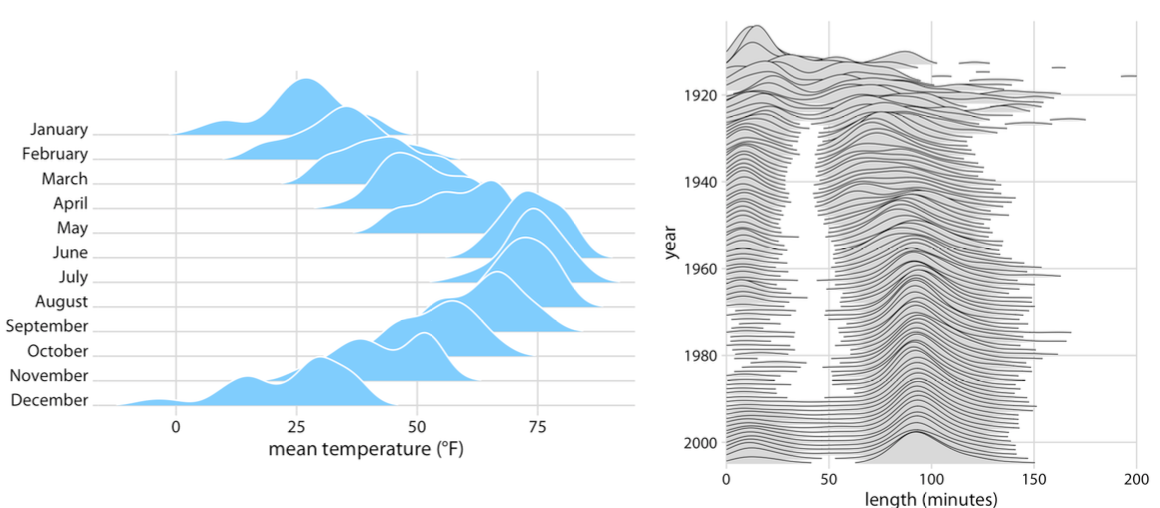
많은 Distribution을 보려고 할 때는 값이 중요한게 아닌 추세, 트렌드를 보려고 하는 것이다.
For raw (empirical) data, CDF is usually best
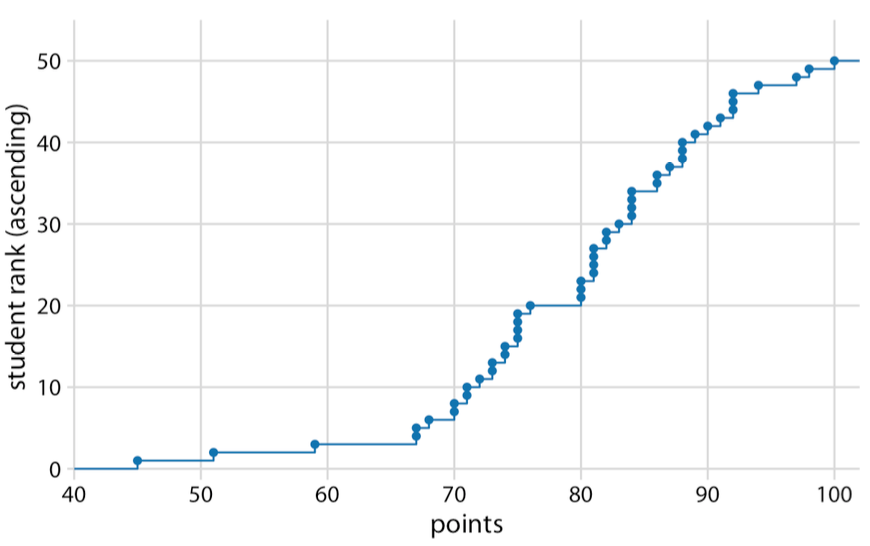
ex) 80점 70점 사이의 학생들의 비율을 알고 싶으면 80점 값에 70점 값을 빼면 비율이 나온다. (중첩된 값이기 때문에)
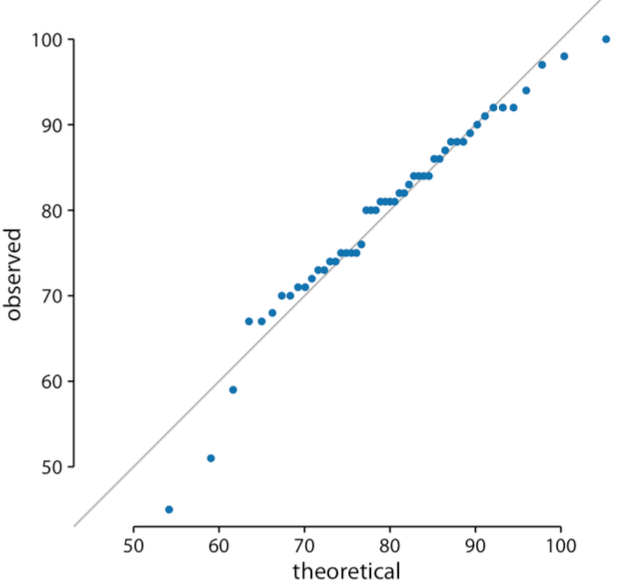
Empirical data with Theoretical fits
- Quantile-Quantile (QQ) plots
Summary and conclusions
- Mapping data to a visual representation
- What dimensions matter
- What Aesthetics elements (color, shape, position, size...) will map to those dimensions
- Three principles
- Be true to your research
- Maximize information, minimize link
- Organize hierarchically

남을 위해(나를 위해) 글을 쓰는 Velog