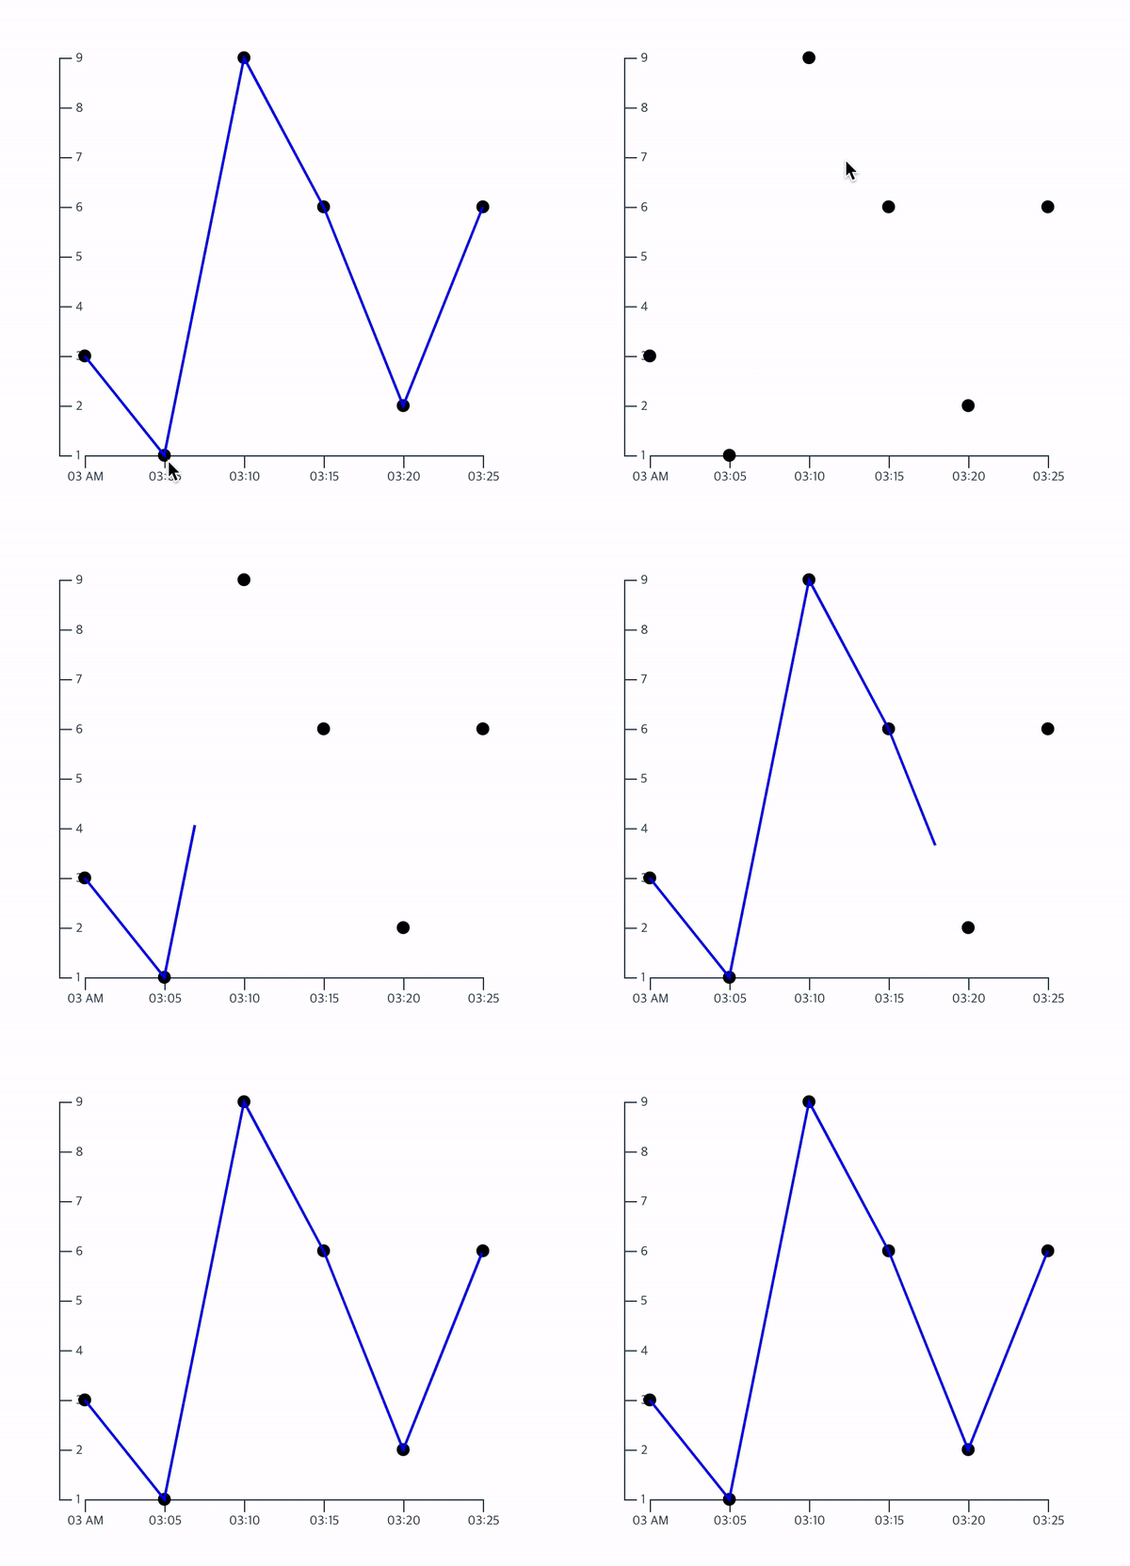
지난 글에 이어 사용했던 코드를 그대로 들고와 선이 생성되면서 움직이는 애니메이션을 넣어보도록 하자!!
1. 어떤 원리...??
animation 효과를 얻기 위해 svg의 stroke-dashoffset과 stroke-dasharray를 이용할 것이다. This is Trick!!
아래를 살펴보자.

순서대로 코드로 표기하면
<svg viewBox="0 0 30 10">
   <line x1="0" y1="1" x2="30" y2="1" stroke="black" />

   <line x1="0" y1="3" x2="30" y2="3" stroke="red" stroke-dasharray="3"/>

   <line x1="0" y1="6" x2="30" y2="6" stroke="green" stroke-dasharray="3" stroke-dashoffset="3"/>
</svg> - stroke-dasharray: line을 지정 값만큼의 dash크기로 만들어준다.
- stroke-dashoffset: dash의 시작점을 설정한다.
그래서 stroke-dasharray를 line의 총 길이만큼 지정하면 dash가 아닌 일자선 형태로 보여지게 된다. 또한 stroke-dashoffset을 line의 총 길이만큼 지정하면 시작점이 마지막점이 되므로 보이지 않게 된다.
2. 이전 코드에 적용해보자!
이전에 generateAxis()함수에 포함시키면 된다.
const path = d3
        .select("svg")
        .append("path")
        .attr("d", linearGenerator(this.data))
        .attr("fill", "none")
        .attr("stroke-width", 2)
        .attr("stroke", "blue");

//path의 총길이를 구한다.
const pathLength = path.node().getTotalLength();

//d3에서 제공하는 transition 함수
const transitionPath = d3
    .transition()
    .ease(d3.easeSin)
    .duration(2500);

path
   .attr("stroke-dashoffset", pathLength)
   .attr("stroke-dasharray", pathLength)
   .transition(transitionPath)
   .attr("stroke-dashoffset", 0); //시작점을 0으로 만들어줘서 마치 선이 생성되는 애니메이션을 얻을 수 있다.
결과!!!

