[IBM data analyst] - Using Data Analysis for Detecting Credit Card Fraud
코세라 - IBM 데이터 분석가 과정
Using Data Analysis for Detecting Credit Card Fraud
Before you can analyze the data for patterns and anomalies, you need to:
Identify and gather all data points that can be of relevance to your use case. For example, the card holder’s details, transaction details, delivery details, location, and network are some of the data points that could be explored.
Clean the data. You need to identify and fix issues in the data that can lead to false or incomplete findings, such as missing data values and incorrect data. You may also need to standardize data formats in some cases, for example, the date fields.
Finally, when you arrive at the findings, you will create appropriate visualizations that communicate your findings to your audience. The graph below samples one such visualization that you would use to capture a trend hidden in the sample data set shared earlier on in the case study.
- List at least 5 (five) data points that are required for the analysis and detection of a credit card fraud. (3 marks)
1. Card holder / Customer Id
2. Transaction date
3. Transaction time
4. Transaction value
5. Shipping address
6. IP address
7. Device model
8. Location
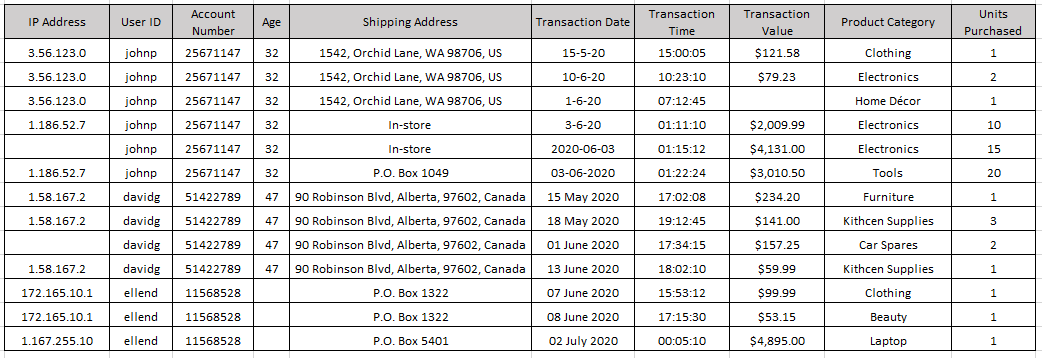
- Refer to the data table below and identify 3 (three) errors/issues that could impact the accuracy of your findings. (3 marks)
Missing transaction value
Missing IP Address
Date format inconsistency
- Refer to the data table below and identify 2 (two) anomalies or unexpected behaviors, that would lead you to believe the transaction may be suspect. (2 marks)
Significantly higher Transaction Value where Shipping Address has been changed from home/office address to P.O. Box.
Higher Transaction Value and increased frequency of transactions.
IP Address change and significantly higher Transaction Value.
IP Address change and Shipping Address change
- Briefly explain your key take-away from the provided data visualization chart. (1 mark)
The visualization depicts the transaction values per transaction for all three users. The key take-away from this visualization is the sharp rise in the transaction values for users johnp and ellend, which may be indicative of an anomaly.
- dentify the type of analysis that you are performing when you are analyzing historical credit card data to understand what a fraudulent transaction looks like.
Descriptive Analytics

4개의 댓글

You're right, and people can struggle with fraud almost everywhere. After I learned about various types of fraud, such as black money scam and something like that, I was shocked because I couldn't even imagine that people could come up with such schemes, it's insane. And it's better to learn more about that in order to avoid being fooled.

In conclusion, buying a budget rangefinder requires careful consideration of several factors, including range, magnification, size, accuracy, battery life, price, and durability. navigate here

Data analysis is not a silver bullet, but it's a critical tool for combating credit card fraud. As technology continues to evolve, so too will our ability to identify and prevent fraudulent activity. Use real estate investor line of credit and you will see the visible results.
I believe that it can actually be beneficial when you're looking for a fraudulent transaction because the field of scammers nowadays is blooming, unfortunately.