- Filtering data in Excel
You can use filters to temporarily hide some of the data in a table, so you can focus on the data you want to see. When filtering, you can specify exact matches or comparisons (‘more than’, ‘less than’) or data that doesn’t match specific criteria. The following comparison operators are available in Excel. You can compare two values by using the following operators. When you use these operators to compare two values, the result is a logical value—it’s either TRUE or FALSE.
To create a filter in Excel:
- Select the data you want to work with.
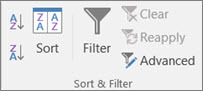
- Select Data > Filter from the ribbon menu.
- At the top of your selection, select the column header arrow (grey box with downwards arrow).
- Select Text Filters or Number Filters, and then select a comparison
- Enter the filter criteria and select OK
You can access the Advanced Filter dialog box under Data > Advanced.
Pivot tables
Pivot tables are built into Excel. They allow you to group and summarise large quantities of data quickly and easily. If you have an input table with tens, hundreds, or even thousands of rows, pivot tables allow you to extract answers to a series of basic questions about your data with minimal effort.
If you have typical sales data, you can use a pivot table to:
- find the sum of total sales per customer
- count the total number of orders by customer
- find the sum total of sales by item type
- create a summary of sales by customer and item type
- find the average amount of sales to a particular customer in a quarter
- create a summary showing the maximum order value by customer and month
- create a breakout summary of orders by customer, month, and item type.
Arranging Pivot Tables with Filters and Recommended Tables:
You use the Pivot Table Fields pane to add and arrange data fields in your pivot table.
Recommended Pivot Tables are a list of suggested different combinations of data that could be used when creating a Pivot Table, based on the data selected in the worksheet.
Filters and Slicers:
Slicers are on-screen graphical filter objects that enable you to filter your data using buttons, which makes it easier to perform quick filtering of your pivot table data.
Timelines are another type of filter tool that enable you to filter specifically on date-related data in your pivot table. This is a much quicker and more effective way of dynamically filtering by date, rather than having to create and adjust filters on your date columns.
질문 1
According to the video checklist, what should you remove before making a Pivot Table?
- Blank rows, columns, and cells
질문 2
What is automatically added after formatting data as a table?
- Filter drop-downs at top of columns
질문 3
After creating a pivot table and selecting it, what pane appears to the right of the pivot table?
- Additional pivot table examples
질문 4
What do Timelines provide in pivot tables?
- Lets you filter specifically on date-related data
질문 5
What is one way to remove a slicer or timeline?
- Right-click it and select cut