chart.js
canvas를 이용한 차트 생성
<div>
  <canvas id="myChart"></canvas>
</div>

<script src="https://cdn.jsdelivr.net/npm/chart.js"></script>

<script>
  const ctx = document.getElementById('myChart');

  new Chart(ctx, {
    type: 'bar',
    data: {
      labels: ['Red', 'Blue', 'Yellow', 'Green', 'Purple', 'Orange'],
      datasets: [{
        label: '# of Votes',
        data: [12, 19, 3, 5, 2, 3],
        borderWidth: 1
      }]
    },
    options: {
      scales: {
        y: {
          beginAtZero: true
        }
      }
    }
  });
</script>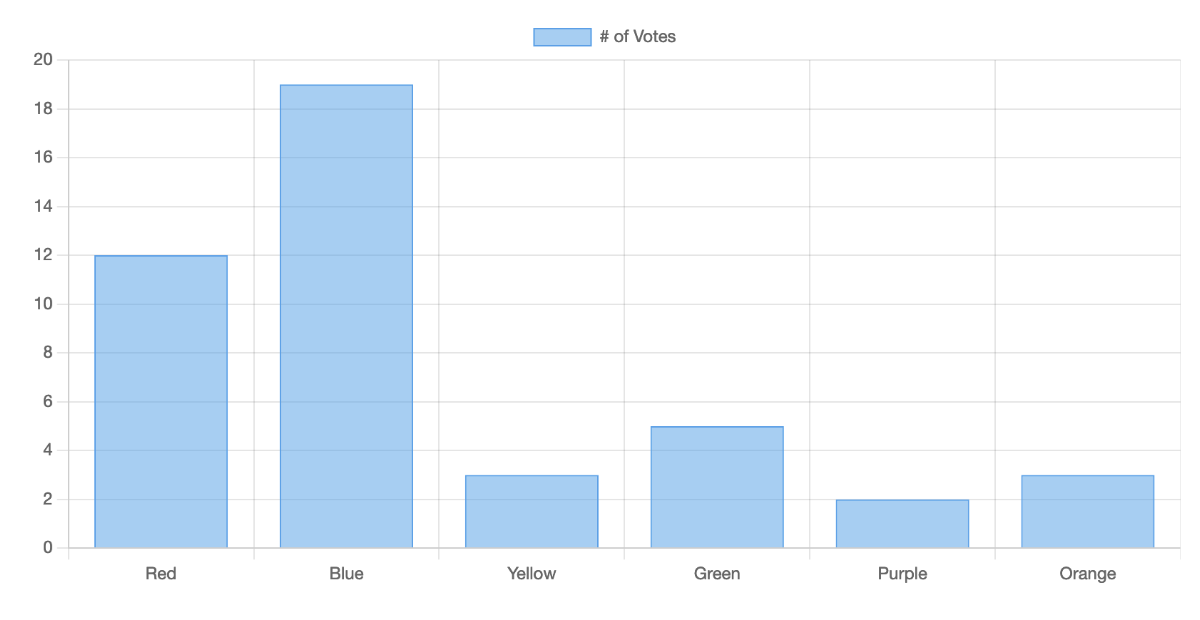
#option
데이터를 사용하여 옵션을 추가 할 경우
const ctx = document.getElementById('myChart');
new Chart(ctx, config);
const data = result.data; //데이터
let config = {
	type : 'bar',
    data : {
    	labels: result.labels,
        datasets: [{
          label: '# of Votes',
          data: result.data,
          borderWidth: 1
        }]
    },
    options : {
    	animation : {} //애니메이션
        plugins : {} // 플러그인 (데이터라벨, 툴팁 등)
    }
}