머신러닝2 EDA3
📝 강의안에서 사용한 distplot이 'distplot' is a deprecated function and will be removed in a future version.으로 떠서 hisplot을 이용해 시각화를 해 보았다.
fig, axes = plt.subplots(nrows=1, ncols=2, figsize=(14,6))

women = titanic[titanic['sex']=='female']
men = titanic[titanic['sex']=='male']

ax = sns.histplot(data=women, x='age', bins=20, hue='survived', ax=axes[0])
ax.set_title('Female');

# bins=40은 20보다 더 잘게 썰어서 히스토그램
ax = sns.histplot(data=men, x='age', bins=40, hue='survived', ax=axes[1])
ax.set_title('Male');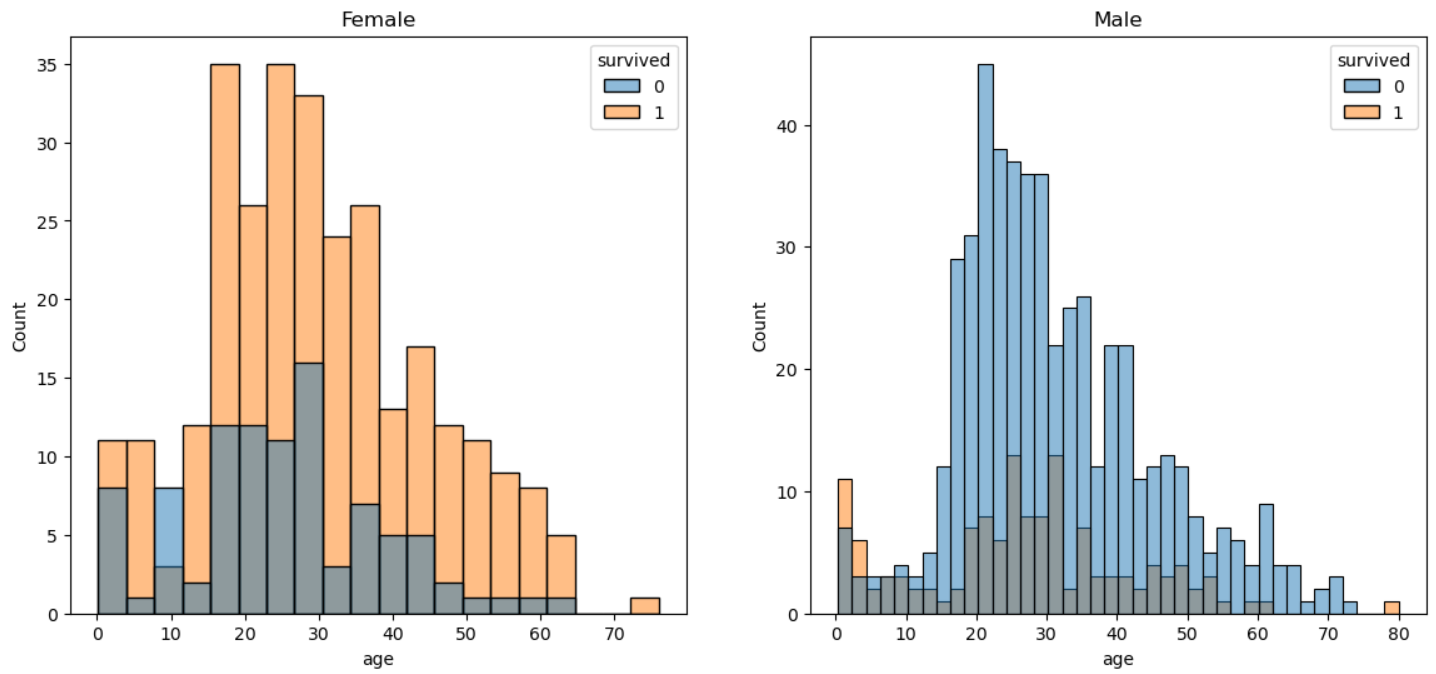

learning Data Science