https://prometheus.io/docs/prometheus/latest/getting_started/
이곳에서 대부분 참조
사전구성
| Node | OS | CPU | Memory | IP Address |
|---|---|---|---|---|
| Master | Centos | 4 Core | 4096MB | 192.168.50.11 |
| Node1 | Centos | 2 Core | 2048MB | 192.168.50.54 |
| Node2 | Centos | 2 Core | 2048MB | 192.168.50.143 |
| Prometheus | Centos | 2 Core | 2048MB | 192.168.56.204 |
Proxmox를 VM 환경으로 사용해 구성하였습니다.
개념정리
- Prometheus
Prometheus는 SoundCloud사에서 만든 오픈소스 시스템 모니터링 및 경고 툴킷이다.
지금은 독립형 오픈소스 프로젝트이며 많은 회사들이 사용 하고 있고, 또한 kubernetes에서도 Prometheus를 사용하여 매트릭 수집 및 대시보드 구축하는 방식을 장려하고 있다.
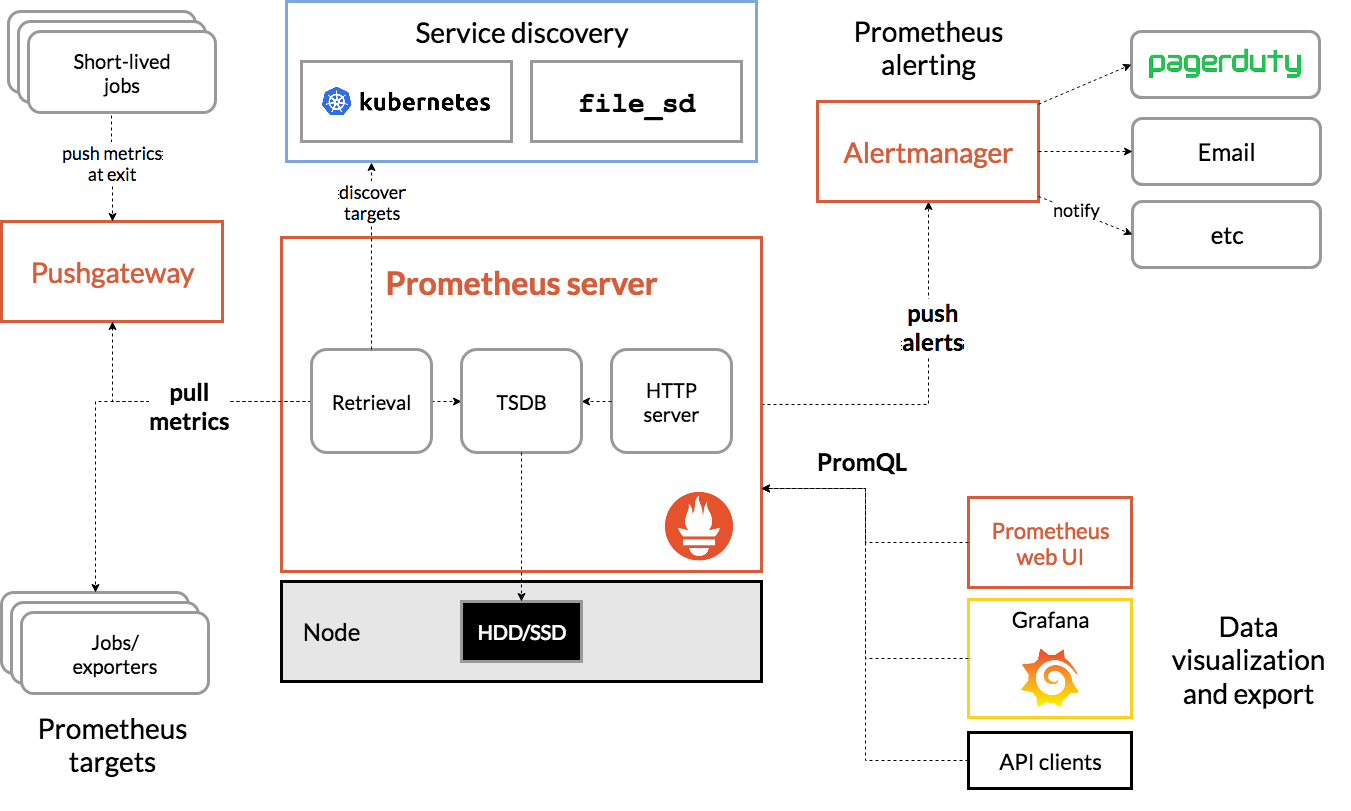
- Node exporter
중앙에 프로메테우스 서버를 두고 다른 서버엔 Node exporter를 설치
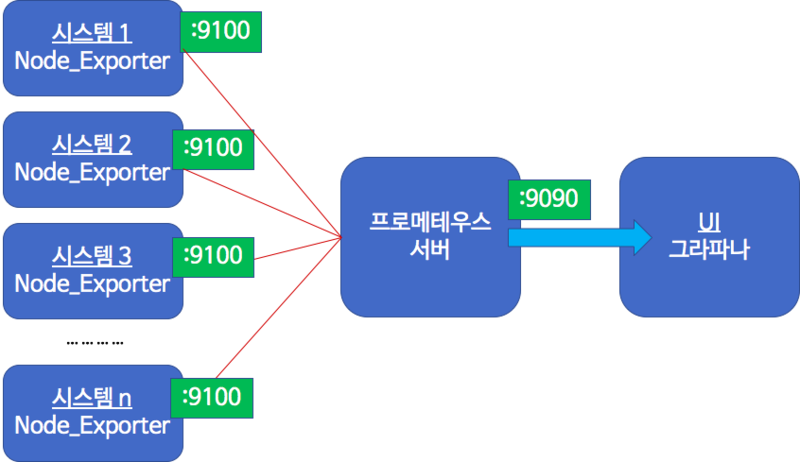
이 구조로 사용.
사전준비
Worker 1과 2에 Node exporter 설치 후 프로메테우스 서버에 연동시키는 방식으로 진행했다.
1. Centos8 저장소 변경
Baremetal 상태에서 쓰려면 yum repository를 변경해주어야 한다.
sed -i 's/^mirrorlist/#mirrorlist/g' /etc/yum.repos.d/CentOS-
sed -i 's|#baseurl=http://mirror.centos.org|baseurl=http://vault.centos.org|g' /etc/yum.repos.d/CentOS-
2. Firewalld service 해제
이 부분을 스킵해서 조인하는데 굉장히 애를 먹었다.
Node_exporter는 9100 port를
Prometheus는 9090 port를 사용하므로 반드시 해제해줘야 노드간 통신이 가능하다.
### Firewall에 Prometheus 서비스 추가 ###
[root@localhost ~]# firewall-cmd --permanent --add-service=prometheus
success


### Firewall에 Node exporter를 신규 서비스로 등록  ###
[root@localhost ~]# firewall-cmd --permanent --new-service=node_exporter
success

### Firewall에 Node exporter의 포트정보 등록  ###
[root@localhost ~]# firewall-cmd --permanent --service=node_exporter --add-port=9100/tcp
success


### Firewall에 Node exporter 서비스 추가 ###
[root@localhost ~]# firewall-cmd --permanent --add-service=node_exporter
success

### Firewall에 적용 ###
[root@localhost ~]# firewall-cmd --reload
success

### Firewall에서 적용상태 확인 ###
[root@localhost ~]# firewall-cmd --list-services
cockpit dhcpv6-client grafana node_exporter prometheus ssh
구성
3. Prometheus 설치
wget https://github.com/prometheus/prometheus/releases/download/v2.36.0/prometheus-2.36.0.linux-amd64.tar.gz

tar xvfz prometheus-*.tar.gz
cd prometheus-*
4. yaml 파일 수정
Worker 1과 Worker 2를 Target 으로 Join 시키는 것이 목적이기에 Node_exporter의 9100포트를 기본으로 부여했다.
[root@prometheus prometheus-2.36.0.linux-amd64]# cat prometheus.yml
# my global config
global:
  scrape_interval: 15s # Set the scrape interval to every 15 seconds. Default is every 1 minute.
  evaluation_interval: 15s # Evaluate rules every 15 seconds. The default is every 1 minute.
  # scrape_timeout is set to the global default (10s).

# Alertmanager configuration
alerting:
  alertmanagers:
    - static_configs:
        - targets:
          # - alertmanager:9093

# Load rules once and periodically evaluate them according to the global 'evaluation_interval'.
rule_files:
  # - "first_rules.yml"
  # - "second_rules.yml"

# A scrape configuration containing exactly one endpoint to scrape:
# Here it's Prometheus itself.

scrape_configs:
  - job_name:       'node'

    # Override the global default and scrape targets from this job every 5 seconds.
    scrape_interval: 5s

    static_configs:
      - targets: ['192.168.50.54:9100', '192.168.50.143:9100']
        labels:
          group: 'production'
5. Node_exporter 설치
wget https://github.com/prometheus/node_exporter/releases/download/v*/node_exporter-*.*-amd64.tar.gz
tar xvfz node_exporter-*.*-amd64.tar.gz
cd node_exporter-*.*-amd64
./node_exporter
curl http://localhost:9100/metrics
curl 명령어로 metrics 가 잘 받아져 오는지 확인할 수 있다.
6. Browser로 확인
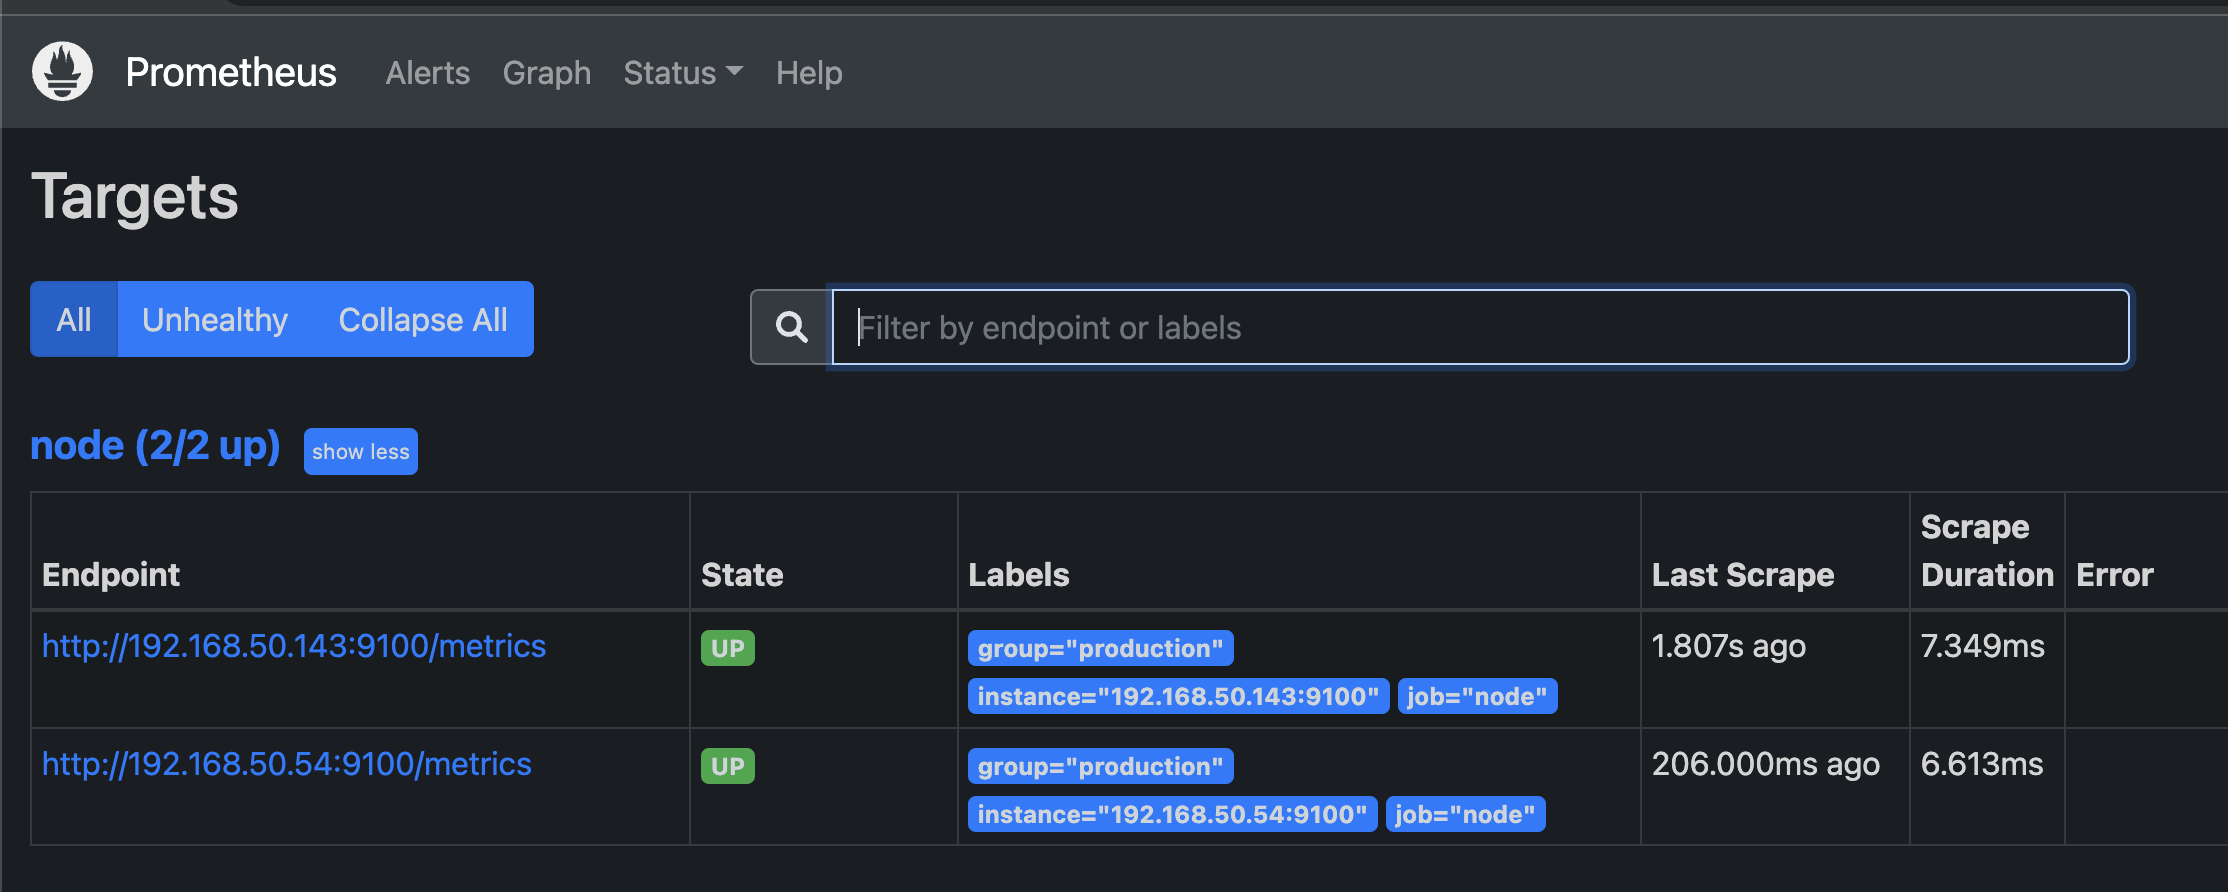
타겟이 잘 붙은것을 확인할 수 있다.
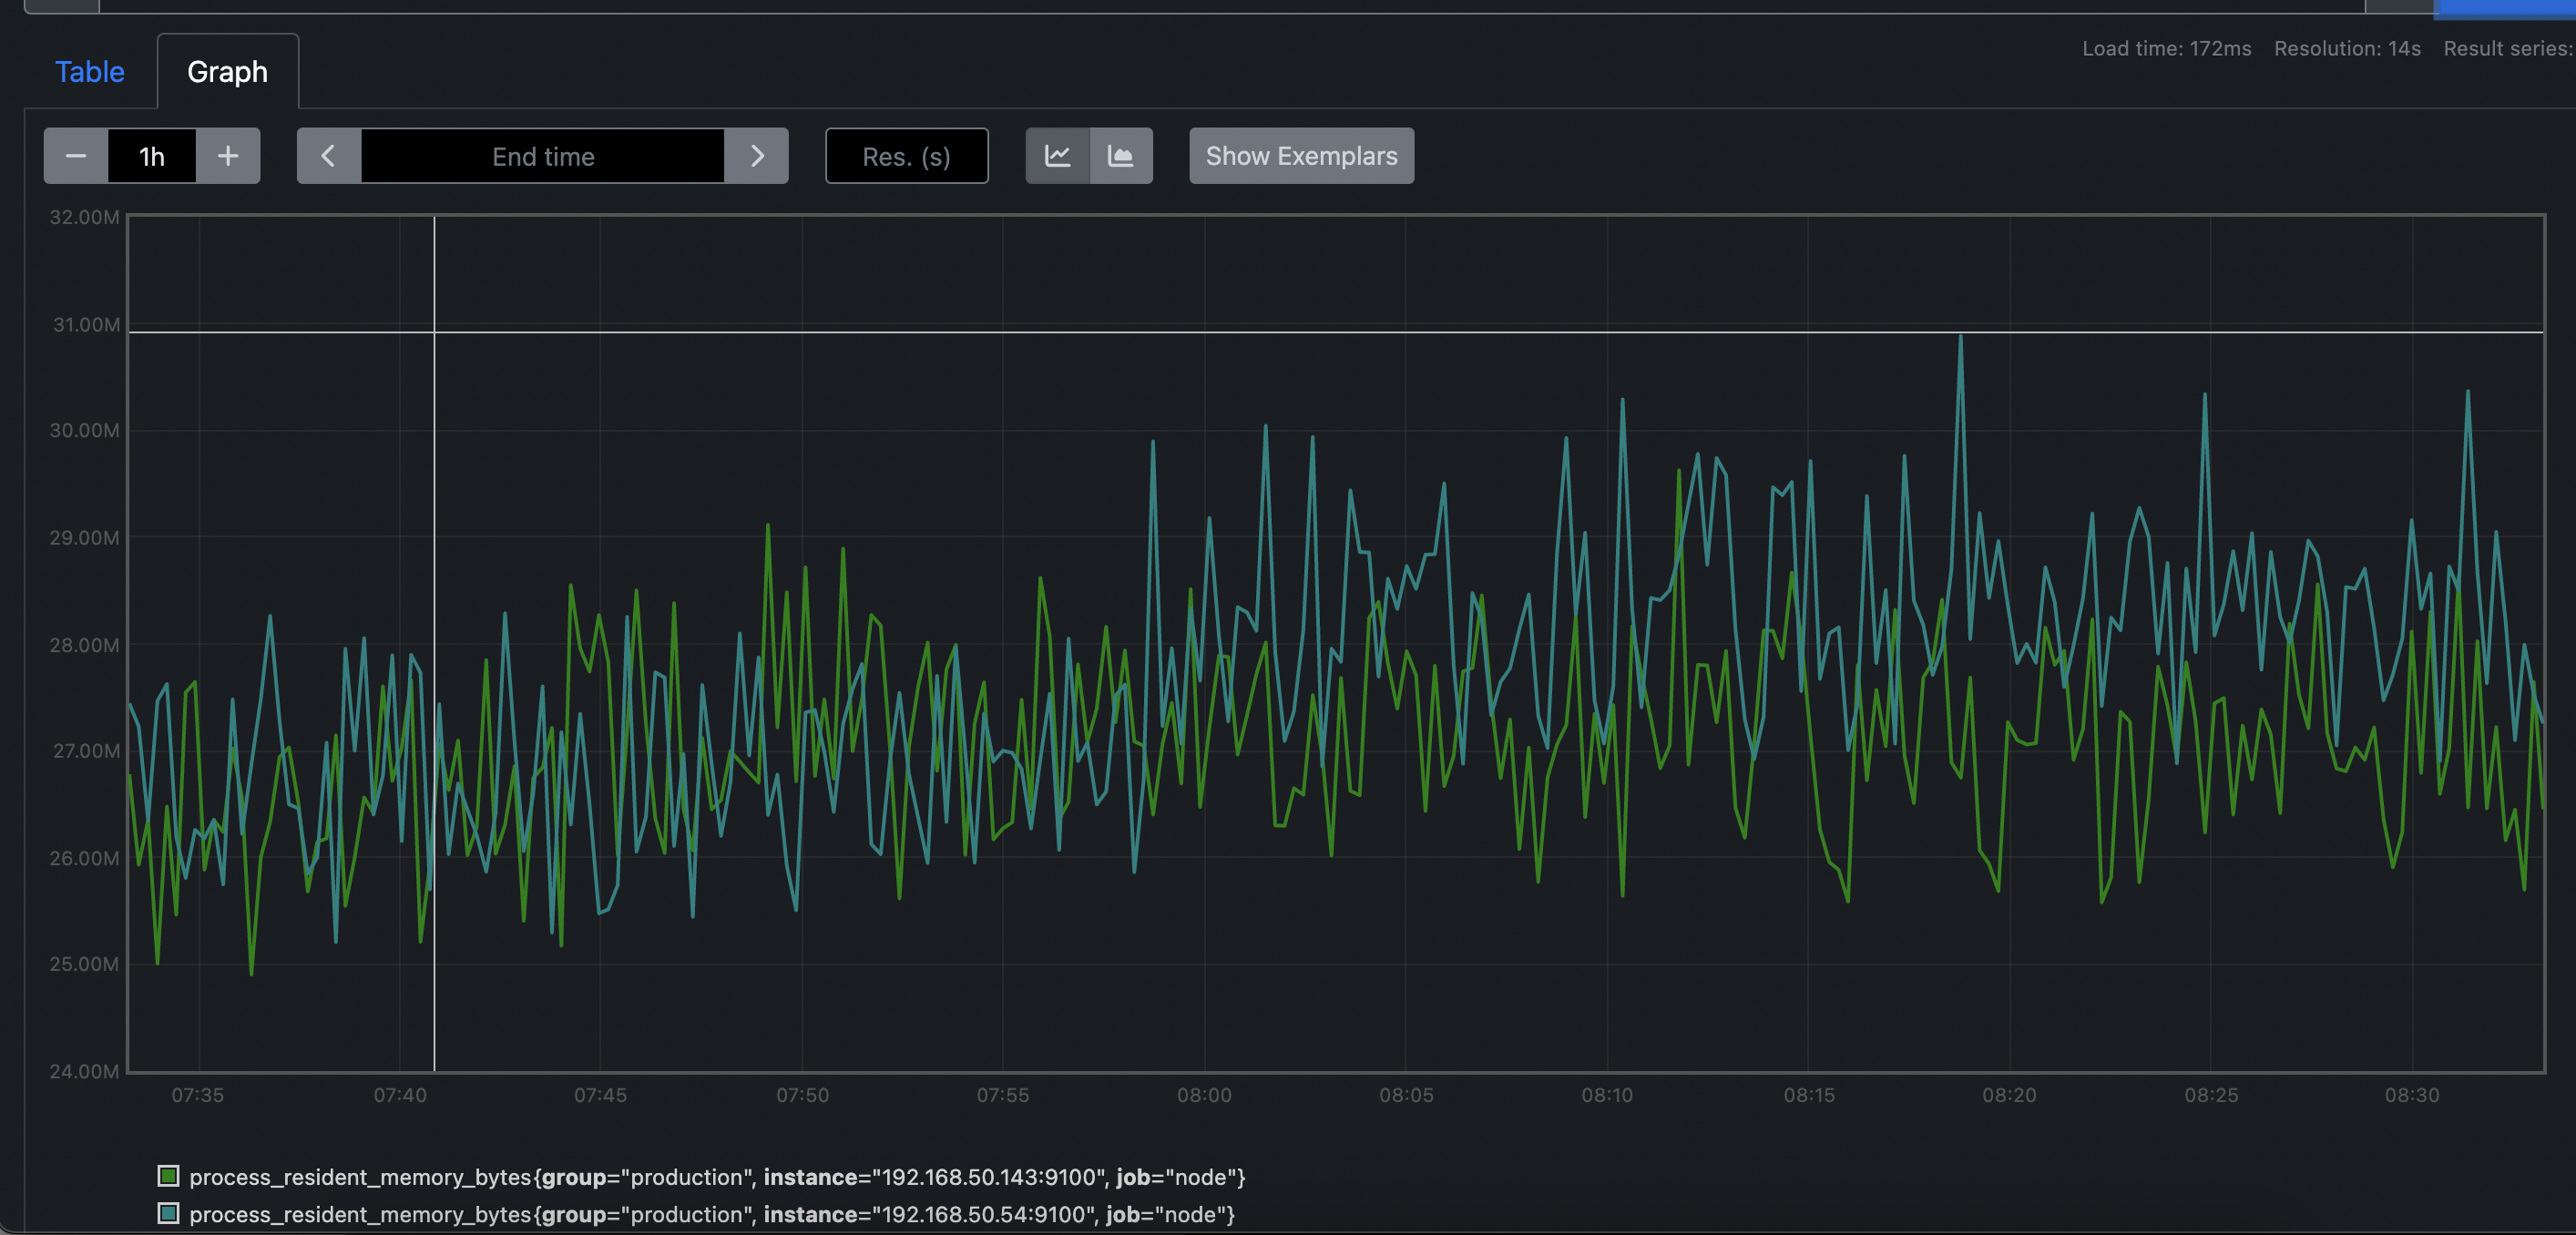
prometheus는 기본적으로 graph를 지원하기에 node들의 사용량을 체크해 볼 수 있다.

계속해서 Blue를 이겨내가는 사람 / System Engineer / Server, OS, Storage, Network, Cloud / 이제 다시 코딩으로!!