0. 로깅이란
- 정보를 제공하는 일련의 기록인 로그(log)를 생성하도록 시스템을 작성하는 활동.
- 프린트 줄 넣기(printlning)는 간단한, 보통은 일시적인, 로그를 생성하기만 한다.
- 시스템 설계자들은 시스템의 복잡성 때문에 로그를 이해하고 사용해야 한다.
- 로그가 제공하는 정보의 양은, 이상적으로는 프로그램이 실행되는 중에도, 설정 가능해야한다.
- 일반적인 로그 기록의 이점
- 로그는 재현하기 힘든 버그에 대한 유용한 정보를 제공할 수 있다.
- 로그는 성능에 관한 통계와 정보를 제공할 수 있다.
- 설정이 가능할 때, 로그는 예기치 못한 특정 문제들을 디버그하기 위해, 그 문제들을 처리하도록 코드를 수정하여 다시 적용(deploy)하지 않아도, 일반적인 정보를 갈무리할 수 있게 한다.
로그 라이브러리 종류
- java.util.logging
- Apache Commons logging
- Log4j
- Logback
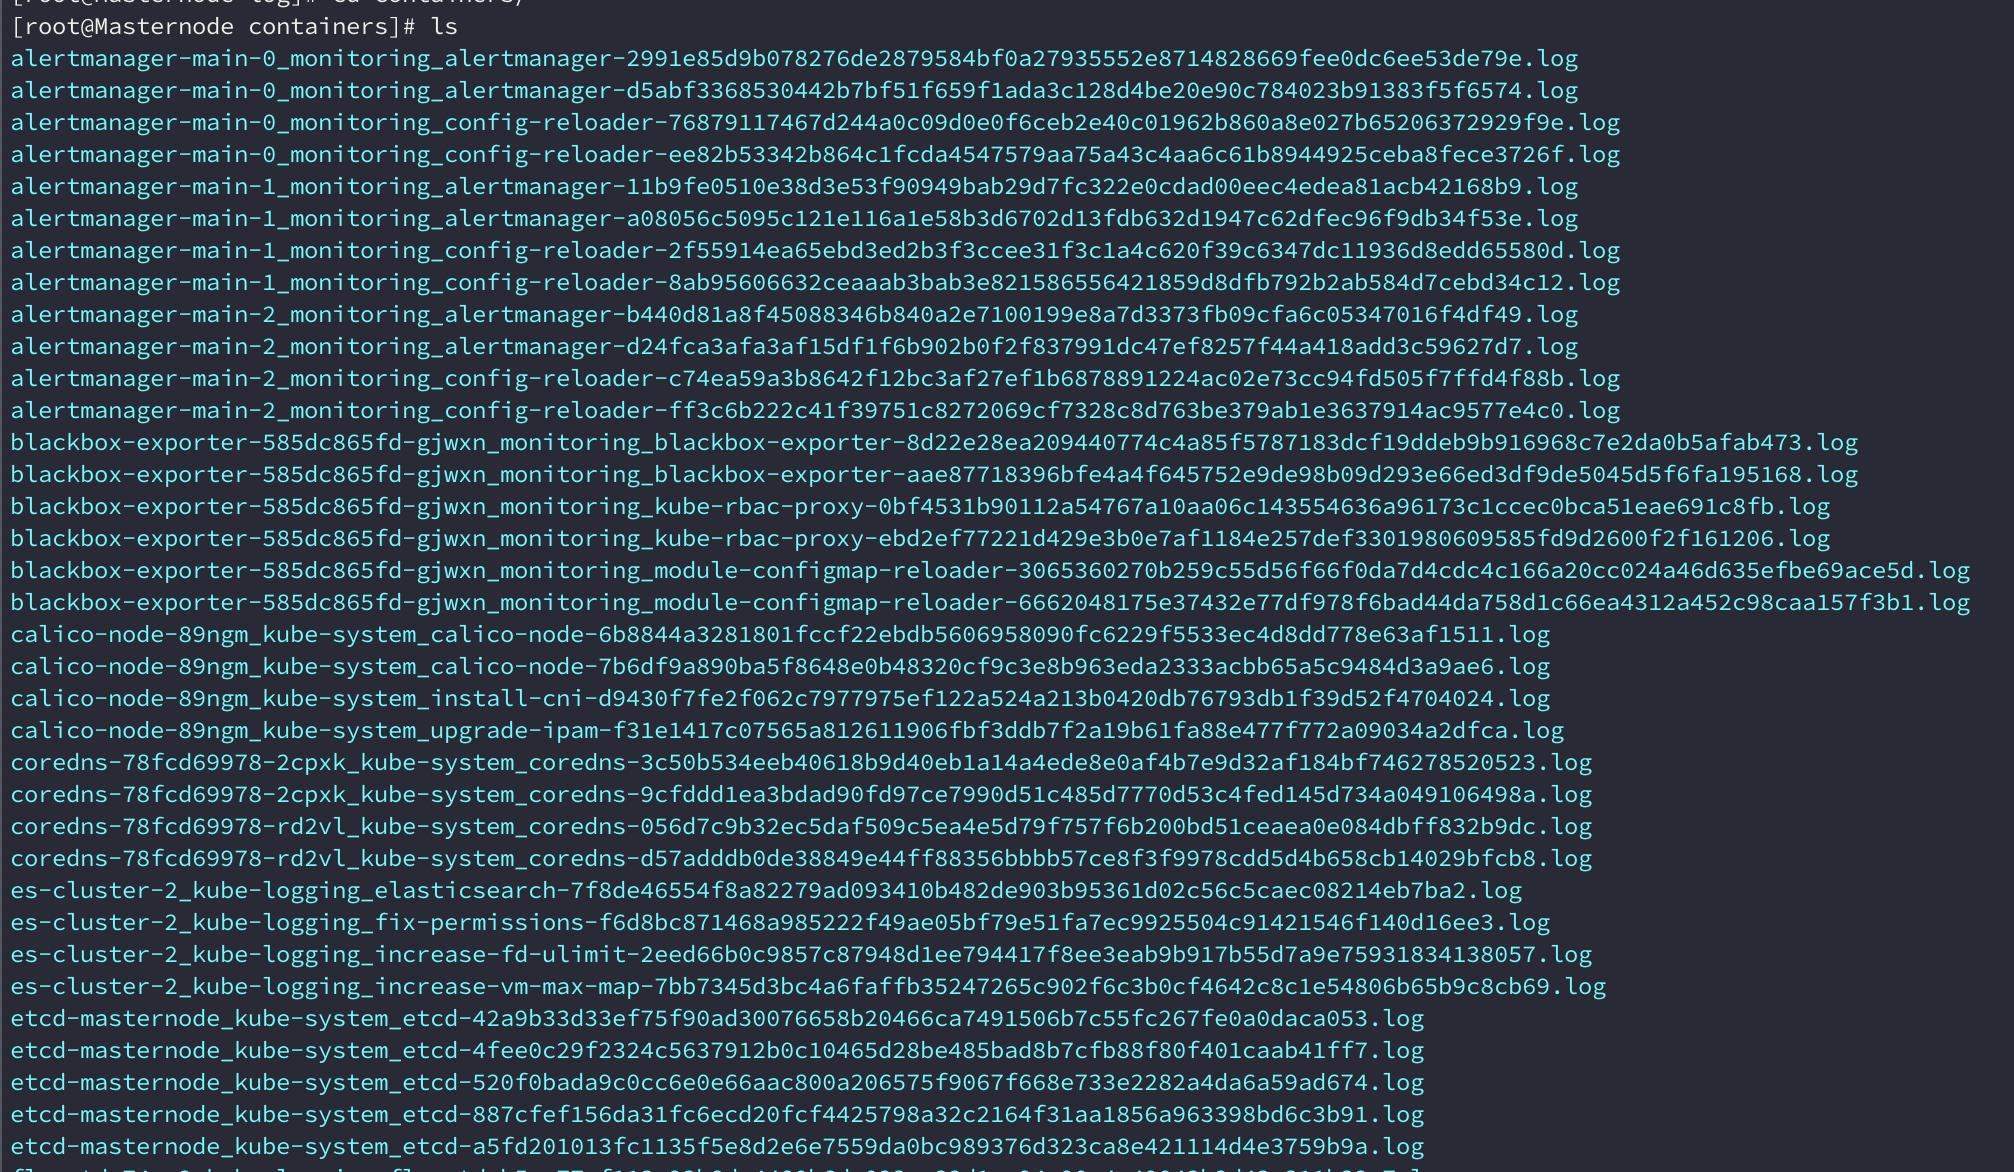
0-1. Kubernetes 로그보기
- 기본적으로 k8s의 로그는 /var/log/containers에서 제공된다
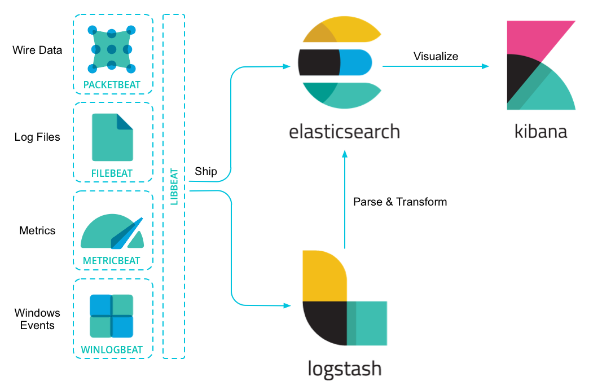
1. ELK/EFK란
- ElasticSearch : 저장을 위한 모듈로 수집한 데이터가 라이프사이클에 의해 저장되는 공간
- Logstash : 다수의 Source에서 다양한 이벤트를 수집
- FluentD : 수집 및 정제를 위한 모듈로 Kubernetes 환경에 DaemonSet으로 구성
- Kibana : 분석을 위한 모듈로 ElasticSearch에 저장된 데이터를 Visualize하는 대시보드
- Beats : 단일 목적의 데이터 수집기 무료 오픈 소스 플랫폼
ELFK를 같이 쓰기도 하며 EL+Kafka+K를 쓰기도 합니다.
1-1. ELK 라이센스
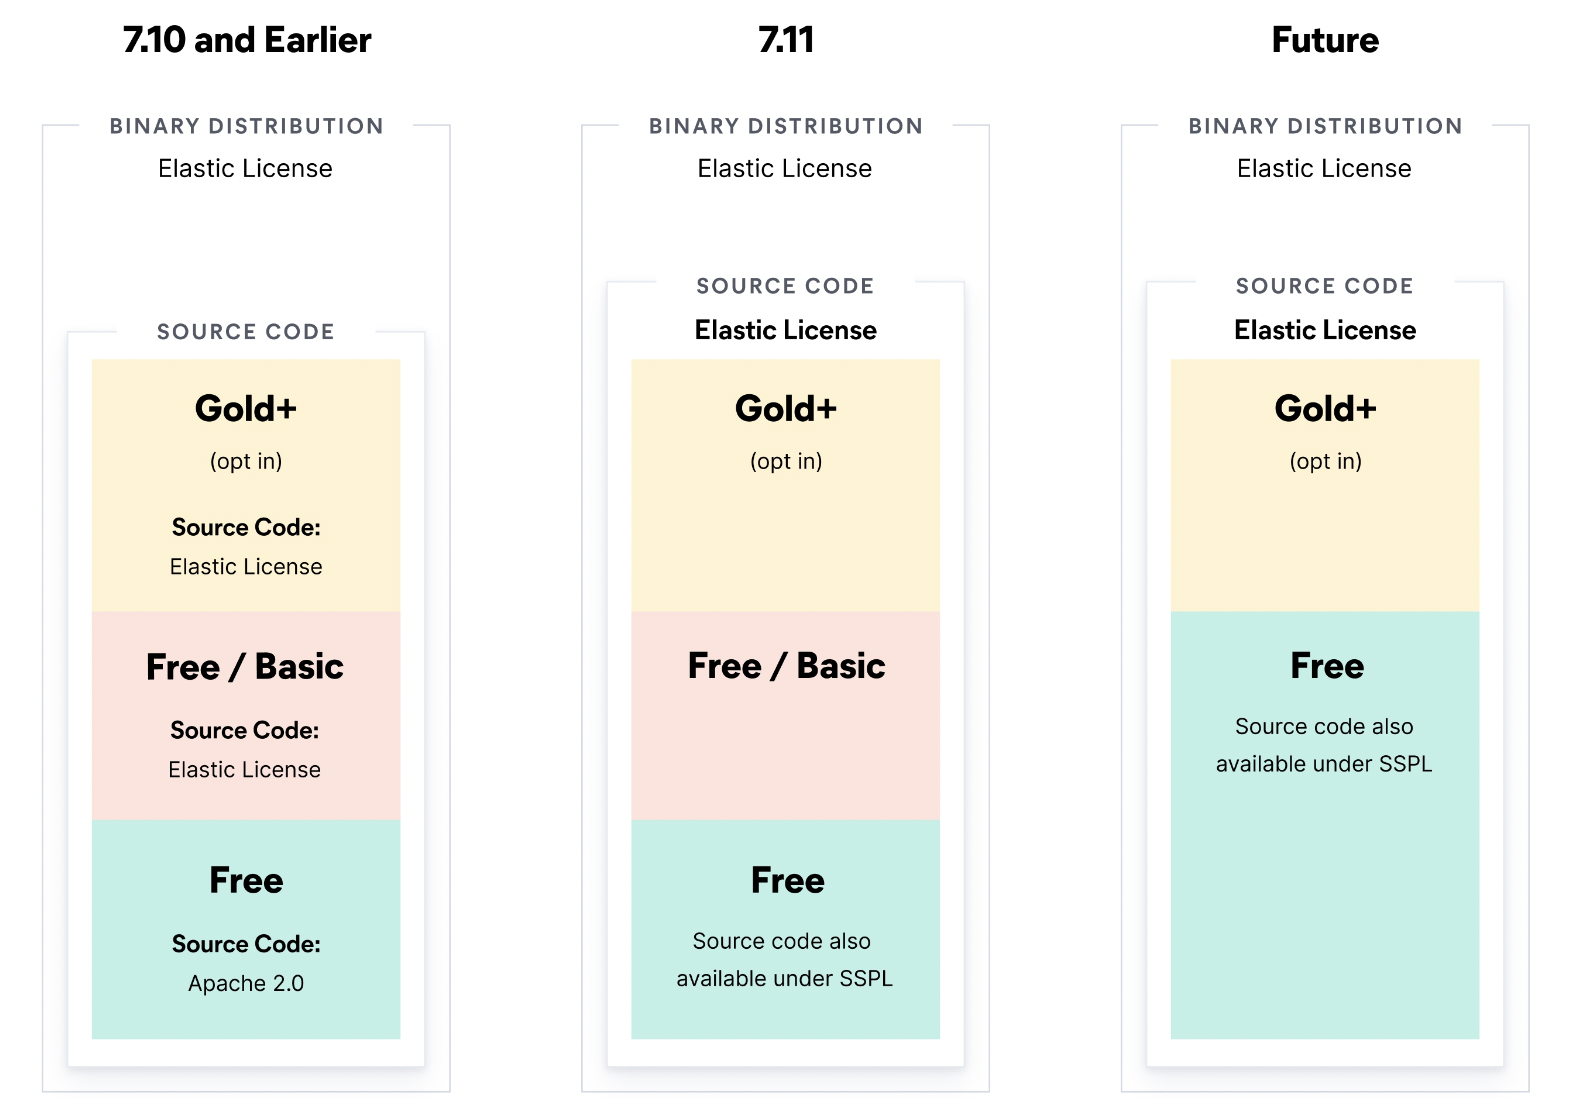
7.10 버젼 이후로는 License 부분에 있어서 SSPL라이센스를 차용.
관계된 소프트웨어에 대한 소스코드 공개가 필요하므로 Elastic Search를 쓰기 위해선 7.10버젼을 사용해야함.
https://www.elastic.co/kr/pricing/faq/licensing
1-2. 장단점
- fluentd는 다양한 플러그인을 통해 다양한 시스템 로그 수집 가능
- Logstash 는 자체 메트릭 수집기능이 없어 beat에 의존해야함
- Logstash는 Elastic 제품. Fluentd는 CNCF 프로젝트
- Logstash는 jruby (JVM)기반, fluentd는 ruby기반. / Logstash가 약간 더 무거운 프로세스를 가진다.
- Logstash는 모놀리식한 시스템의 로깅 파이프라인으로 주로 사용하고, Fluentd는 마이크로 서비스 아키텍처를 사용한 시스템에서 주로 사용하기 용이
- Logstash는 if문을 사용. 구문이 길어질수록 복잡함.
if [type] == "end" {
  elasticsearch {
     hosts => ["es-server"]
     query => "type:start AND operation:%{[opid]}"
     fields => { "@timestamp" => "started" }
  }
  date {
     match => ["[started]", "ISO8601"]
     target => "[started]"
  }
  ruby {
     code => 'event.set("duration_hrs", (event.get("@timestamp") - event.get("started")) / 3600) rescue nil'
 }
}
- fluentd는 매칭형식의 플러그인 타입 로그 분석 구조 / 복잡하지 않은 구조 / 상세한 분석은 어려울 수 있다.
<source>
  @type tail
  tag system.logs
  # ...
</source>

<filter app.**>
  @type record_transformer
  <record>
    hostname "#{Socket.gethostname}"
  </record>
</filter>

<match {app.**,system.logs}>
  @type file
  # ...
</match>
1-3. Kube-ELK / EFK
- ElasticSearch.Yaml
apiVersion: apps/v1
kind: StatefulSet
metadata:
  name: es-cluster
  namespace: kube-logging
spec:
  serviceName: elasticsearch
  replicas: 3
  selector:
    matchLabels:
      app: elasticsearch
  template:
    metadata:
      labels:
        app: elasticsearch
    spec:
      containers:
      - name: elasticsearch
        image: docker.elastic.co/elasticsearch/elasticsearch:7.2.0
        resources:
            limits:
              cpu: 1000m
            requests:
              cpu: 100m
        ports:
        - containerPort: 9200
          name: rest
          protocol: TCP
        - containerPort: 9300
          name: inter-node
          protocol: TCP
        volumeMounts:
        - name: data
          mountPath: /usr/share/elasticsearch/data
        env:
          - name: cluster.name
            value: k8s-logs
          - name: node.name
            valueFrom:
              fieldRef:
                fieldPath: metadata.name
          - name: discovery.seed_hosts
            value: "es-cluster-0.elasticsearch,es-cluster-1.elasticsearch,es-cluster-2.elasticsearch"
          - name: cluster.initial_master_nodes
            value: "es-cluster-0,es-cluster-1,es-cluster-2"
          - name: ES_JAVA_OPTS
            value: "-Xms512m -Xmx512m"
      initContainers:
      - name: fix-permissions
        image: busybox
        command: ["sh", "-c", "chown -R 1000:1000 /usr/share/elasticsearch/data"]
        securityContext:
          privileged: true
        volumeMounts:
        - name: data
          mountPath: /usr/share/elasticsearch/data
      - name: increase-vm-max-map
        image: busybox
        command: ["sysctl", "-w", "vm.max_map_count=262144"]
        securityContext:
          privileged: true
      - name: increase-fd-ulimit
        image: busybox
        command: ["sh", "-c", "ulimit -n 65536"]
        securityContext:
          privileged: true
  volumeClaimTemplates:
  - metadata:
      name: data
      labels:
        app: elasticsearch
    spec:
      accessModes: [ "ReadWriteOnce" ]
      storageClassName: local-storage
      resources:
        requests:
storage: 50Gi- fluentd.yaml
apiVersion: v1
kind: ServiceAccount
metadata:
  name: fluentd
  namespace: kube-logging
  labels:
    app: fluentd
---
apiVersion: rbac.authorization.k8s.io/v1
kind: ClusterRole
metadata:
  name: fluentd
  labels:
    app: fluentd
rules:
- apiGroups:
  - ""
  resources:
  - pods
  - namespaces
  verbs:
  - get
  - list
  - watch
---
kind: ClusterRoleBinding
apiVersion: rbac.authorization.k8s.io/v1
metadata:
  name: fluentd
roleRef:
  kind: ClusterRole
  name: fluentd
  apiGroup: rbac.authorization.k8s.io
subjects:
- kind: ServiceAccount
  name: fluentd
  namespace: kube-logging
---
apiVersion: apps/v1
kind: DaemonSet
metadata:
  name: fluentd
  namespace: kube-logging
  labels:
    app: fluentd
spec:
  selector:
    matchLabels:
      app: fluentd
  template:
    metadata:
      labels:
        app: fluentd
    spec:
      serviceAccount: fluentd
      serviceAccountName: fluentd
      tolerations:
      - key: node-role.kubernetes.io/master
        effect: NoSchedule
      containers:
      - name: fluentd
        image: fluent/fluentd-kubernetes-daemonset:v1.4.2-debian-elasticsearch-1.1
        env:
          - name:  FLUENT_ELASTICSEARCH_HOST
            value: "elasticsearch.kube-logging.svc.cluster.local"
          - name:  FLUENT_ELASTICSEARCH_PORT
            value: "9200"
          - name: FLUENT_ELASTICSEARCH_SCHEME
            value: "http"
          - name: FLUENTD_SYSTEMD_CONF
            value: disable
        resources:
          limits:
            memory: 512Mi
          requests:
            cpu: 100m
            memory: 200Mi
        volumeMounts:
        - name: varlog
          mountPath: /var/log
        - name: varlibdockercontainers
          mountPath: /var/lib/docker/containers
          readOnly: true
      terminationGracePeriodSeconds: 30
      volumes:
      - name: varlog
        hostPath:
          path: /var/log
      - name: varlibdockercontainers
        hostPath:
path: /var/lib/docker/containers- kibana.yaml
  apiVersion: v1
kind: Service
metadata:
  name: kibana
  namespace: kube-logging
  labels:
    kubernetes.io/cluster-service: 'true'
    kubernetes.io/name: kibana
spec:
  ports:
  - port: 5601
    targetPort: 5601
    nodePort: 30050
  type: NodePort
  selector:
    app: kibana
---
apiVersion: apps/v1
kind: Deployment
metadata:
  name: kibana
  namespace: kube-logging
  labels:
    app: kibana
spec:
  replicas: 1
  selector:
    matchLabels:
      app: kibana
  template:
    metadata:
      labels:
        app: kibana
    spec:
      containers:
      - name: kibana
        image: docker.elastic.co/kibana/kibana:7.2.0
        resources:
          limits:
            cpu: 1000m
          requests:
            cpu: 100m
        env:
          - name: ELASTICSEARCH_URL
            value: http://elasticsearch:9200
        ports:
        - containerPort: 5601
2. PLG란
Promtail + Loki + Grafana 스택.
-
Promtail : Collector가 출력하는 로그 데이터를 Loki에게 전달
-
Loki : 시계열 로그(string) 데이터를 저장하는 DB
-
Grafana : Loki의 Data를 시각화
-
Collector : 모니터링 대상 시스템이 생성하는 데이터를 Prometheus와 Promtail이 원하는 형식으로 제공
2-1. PLG license
-
모두 AGPLv3 License
2-2 Kube-Loki
kube-loki-statefulset.yaml
---
apiVersion: apps/v1
kind: StatefulSet
metadata:
  name: loki
  labels:
    app: loki
spec:
  revisionHistoryLimit: 1
  podManagementPolicy: OrderedReady
  replicas: 1
  selector:
    matchLabels:
      app: loki
  serviceName: loki-headless
  updateStrategy:
    type: RollingUpdate
  template:
    metadata:
      labels:
        app: loki
      annotations:
        prometheus.io/port: http-metrics
        prometheus.io/scrape: "true"
    spec:
      automountServiceAccountToken: false
      containers:
        - name: loki
          image: docker.io/grafana/loki:latest
          imagePullPolicy: IfNotPresent
          args:
            - "-config.file=/etc/loki/loki.yaml"
          volumeMounts:
            - name: config
              mountPath: "/etc/loki"
            - name: storage
              mountPath: "/data:z"
              subPath: data
            - name: storage
              mountPath: "/wal:z"
              subPath: wal
          ports:
            - name: http-metrics
              containerPort: 3100
              protocol: TCP
          livenessProbe:
            httpGet:
              path: /ready
              port: http-metrics
            initialDelaySeconds: 45
          readinessProbe:
            httpGet:
              path: /ready
              port: http-metrics
            initialDelaySeconds: 45
          securityContext:
            allowPrivilegeEscalation: false
            privileged: false
            readOnlyRootFilesystem: true
            runAsNonRoot: true
            runAsGroup: 10001
            runAsUser: 10001
            seccompProfile:
              type: RuntimeDefault
            capabilities:
              drop:
                - ALL
              add:
                - NET_BIND_SERVICE
      terminationGracePeriodSeconds: 60
      volumes:
        - name: config
          configMap:
            name: loki
            defaultMode: 0755
        - name: storage
          emptyDir:
            sizeLimit: "2Gi"
2-3 Kube-promtail
---
# Daemonset.yaml
apiVersion: apps/v1
kind: DaemonSet
metadata:
  name: promtail-daemonset
spec:
  selector:
    matchLabels:
      name: promtail
  template:
    metadata:
      labels:
        name: promtail
    spec:
      serviceAccount: promtail-serviceaccount
      containers:
      - name: promtail-container
        image: grafana/promtail
        args:
        - -config.file=/etc/promtail/promtail.yaml
        env:
        - name: 'HOSTNAME' # needed when using kubernetes_sd_configs
          valueFrom:
            fieldRef:
              fieldPath: 'spec.nodeName'
        volumeMounts:
        - name: logs
          mountPath: /var/log
        - name: promtail-config
          mountPath: /etc/promtail
        - mountPath: /var/lib/docker/containers
          name: varlibdockercontainers
          readOnly: true
      volumes:
      - name: logs
        hostPath:
          path: /var/log
      - name: varlibdockercontainers
        hostPath:
          path: /var/lib/docker/containers
      - name: promtail-config
        configMap:
          name: promtail-config
--- # configmap.yaml
apiVersion: v1
kind: ConfigMap
metadata:
  name: promtail-config
data:
  promtail.yaml: |
    server:
      http_listen_port: 9080
      grpc_listen_port: 0

    clients:
    - url: https://{YOUR_LOKI_ENDPOINT}/loki/api/v1/push

    positions:
      filename: /tmp/positions.yaml
    target_config:
      sync_period: 10s
    scrape_configs:
    - job_name: pod-logs
      kubernetes_sd_configs:
        - role: pod
      pipeline_stages:
        - docker: {}
      relabel_configs:
        - source_labels:
            - __meta_kubernetes_pod_node_name
          target_label: __host__
        - action: labelmap
          regex: __meta_kubernetes_pod_label_(.+)
        - action: replace
          replacement: $1
          separator: /
          source_labels:
            - __meta_kubernetes_namespace
            - __meta_kubernetes_pod_name
          target_label: job
        - action: replace
          source_labels:
            - __meta_kubernetes_namespace
          target_label: namespace
        - action: replace
          source_labels:
            - __meta_kubernetes_pod_name
          target_label: pod
        - action: replace
          source_labels:
            - __meta_kubernetes_pod_container_name
          target_label: container
        - replacement: /var/log/pods/*$1/*.log
          separator: /
          source_labels:
            - __meta_kubernetes_pod_uid
            - __meta_kubernetes_pod_container_name
          target_label: __path__

--- # Clusterrole.yaml
apiVersion: rbac.authorization.k8s.io/v1
kind: ClusterRole
metadata:
  name: promtail-clusterrole
rules:
  - apiGroups: [""]
    resources:
    - nodes
    - services
    - pods
    verbs:
    - get
    - watch
    - list

--- # ServiceAccount.yaml
apiVersion: v1
kind: ServiceAccount
metadata:
  name: promtail-serviceaccount

--- # Rolebinding.yaml
apiVersion: rbac.authorization.k8s.io/v1
kind: ClusterRoleBinding
metadata:
  name: promtail-clusterrolebinding
subjects:
    - kind: ServiceAccount
      name: promtail-serviceaccount
      namespace: default
roleRef:
    kind: ClusterRole
    name: promtail-clusterrole
    apiGroup: rbac.authorization.k8s.io
장단점
- Promtail 은 Daemonset, Sidecar의 형식으로 운영가능
- Daemonset 방식은 각 노드마다 promtail pod이 실행되어 해당 노드 장비에서 실행중인 파드의 로그를 추적
- Sidecar 방식은 각 파드에 멀티컨테이너로 추가되어 파드 내부에서 로그파일을 읽어 Loki로 전송 (Daemonset 이 더 편함)
Checklist
ELK EFK PLG
라이센스 문제
연동 대시보드
사용 Query Language
Scalability
Multi-tenancy
Cost
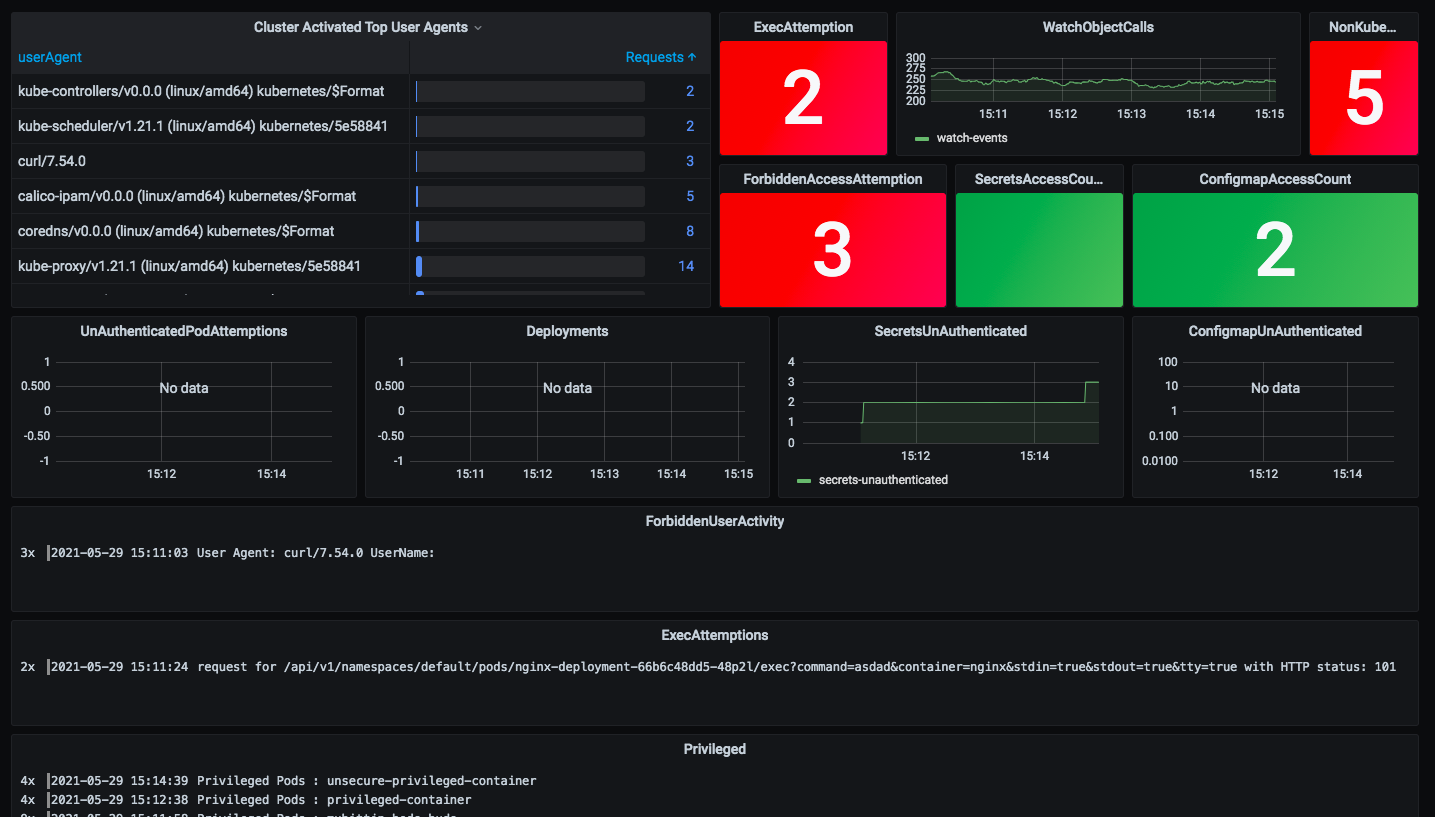
Audit Log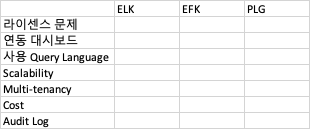
Audit log
https://github.com/developer-guy/kubernetes-audit-logs-collect-with-PLG-stack/blob/main/auditing.md
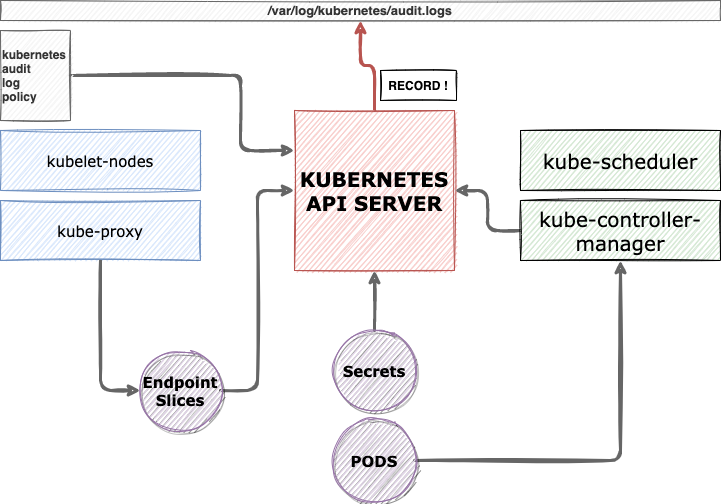
- Audit이란?
k8s에서는 어떤 작업을 하든 반드시 kube-apiserver를 거쳐야한다. 그리고 이 kube-apiserver에 요청을 보낼 때는 HTTP API를 통해 이루어진다. audit이란 kube-apiserver를 오가는 API를 로깅하는 것이다.
기본적으로 auidt 로그는 event라는 객체의 구조로 아래와 같은 정보들을 담을 수 있다.
콜을 날린 클라이언트가 누구인지
언제 날렸는지
어떤 리소스에 대한 것인지
HTTP의 성공 여부
verb는 무엇인지
URI
request body, reponse body
RequestReceived : audit 핸들러가 request를 받자마자
ResponseStarted : response 헤더만 보내지고, reponse body는 아직 안보내졌을 때. long-running request의 경우에만 발생한다 (예: watch)
ResponseComplete : response body까지 전부 보내진 후
Panic : panic이 발생 했을 때
어느정도 수준의 정보를 남길 것인지도 선택할 수 있다.
아래로 갈 수록 더 많은 양의 정보를 담고 있다.
None : 남기지 않는다
Metadata : request의 metadata (request한 유저, timestamp, resource, verb, 등) (body는 포함하지 않음)
Request : Metadata + request body (response body는 포함하지 않음) (non-resource request에는 적용 안 됨)
RequestResponse : Request + response body (non-resource request에는 적용 안 됨)
audit을 저장하는 방식 2가지가 있다.
파일시스템으로 작성
웹훅을 이용해 외부 서버에 HTTP 콜 전송
요약하자면
audit이란 kube-apiserver를 오가는 HTTP 콜을 로깅하는 것이고,
audit을 언제, 얼마만큼의 정보로, 어떤 방식으로 저장할지 커스터마이징 할 수 있다.
3-1 EFK Audit log
https://www.infracloud.io/blogs/kubernetes-auditing/
3-2 Loki Audit Log
https://grafana.com/docs/grafana/latest/setup-grafana/configure-security/audit-grafana/
https://github.com/grafana/loki
Auditing allows you to track important changes to your Grafana instance. By default, audit logs are logged to file but the auditing feature also supports sending logs directly to Loki.
- Loki에서 Grafana instance를 Audit 하는 부분은 Grafana Cloud & Enterprise만 지원
- Promtail -> k8s audit log를 바라보고 바로 Loki로 shipping 하는 스텝으로 생각
Step 1. Configure Kube APIserver
kube-apiserver.yaml
--audit-policy-file=”<AUDIT_POLICY_FILE_PATH>”

--audit-log-path=”<WHERE_TO_WRITE_LOGS>
kube-apiserver-policy.yaml
  - level: Request

    verbs: ["get", "list", "watch"]

    resources:

      - group: "" # core

      - group: "apps"

      - group: "certificates.k8s.io"
step 2. Shipping by promtail (Daemonset)
- Daemonset 방식은 노드마다 Promtail을 deploy하여 Kubernetes API server 정보를 가져온다.
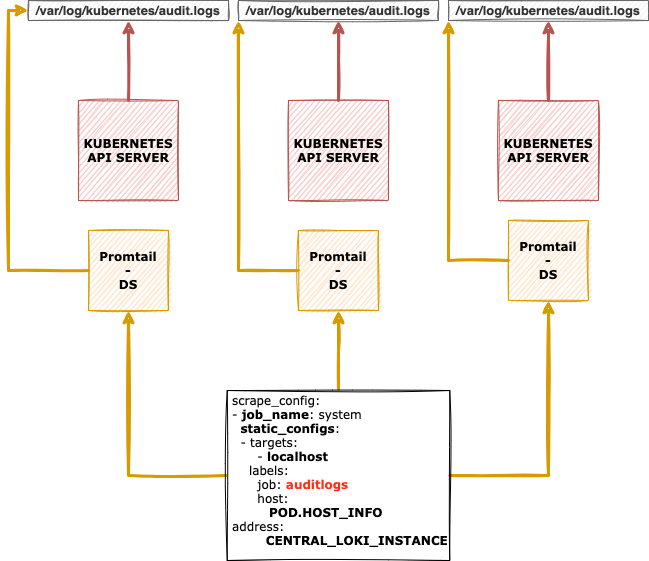
scrape_configs:
- job_name: system
  static_configs:
  - targets:
      - localhost
    labels:
      job: varlogs
      host: MASTER_NODE_ADDR
      agent: promtail
      __path__: /var/log/kubernetes/audit/audit.log
이런식으로 scrape config를 주어서 Promtail이 Kubernetes의 audit을 긁어모으면 된다.
step 3. Integration with promtail & Loki
server:
....
..
..
clients:
 - url: http://LOKI_HOST_ADDR:3100/loki/api/v1/push
step 4. Check in Grafana Loki