Node Exporter - Prometheus - Grafana 모니터링 과정
1편에 이어 NGINX도 모니터링해봅시다. 다시 전체적인 구조를 설명드리겠습니다
Node Exporter는 스파이와 같습니다. 우리가 모니터링을 원하는 서버에 투입하여 관련 정보를 모읍니다.
Prometheus는 국정원과 같습니다. Node Exporter 등 서버의 정보(metrics)를 모은 스파이들에게 주기적으로 pull 요청을 하여 metrics를 수집합니다.
Garafana는 모은 정보를 바탕으로 시각화하는 도구입니다.
이번 글에서는 이전 글에서 설정한 Prometheus - Grafana를 기반으로 NGINX가 설치된 서버에 NGINX Prometheus Exporter 스파이를 추가로 파견해봅시다.
NGINX Prometheus Exporter
NGINX Prometheus Exporter 설치
NGINX Prometheus Exporter github repository
NGINX Prometheus Exporter 공식 repository에서 현재까지 나온 버전을 확인 후 내 서버 환경에 맞는 버전을 찾아봅시다.
저희는 Linux ubuntu 22.04, Arm64 기반 CPU 환경에서 0.10.0 버전으로 진행해보겠습니다. Arm64 기반이 아닌 경우 binary 파일 읽기 오류가 발생합니다. 맞는 버전을 설치하거나 docker 등 가상 환경에서 설치를 진행하면 됩니다.
wget https://github.com/nginxinc/nginx-prometheus-exporter/releases/download/v0.10.0/nginx-prometheus-exporter_0.10.0_linux_arm64.tar.gz다운 받은 뒤 압축을 풀고 압축 파일은 지워줍시다.
tar xvfz nginx-prometheus-exporter_0.10.0_linux_arm64.tar.gzNGINX 설정
NGINX 관련 metrics를 수집하기 위해서는 NGINX에서 ngx_http_stub_status_module이 enable 상태여야 합니다. 다음 명령어를 수행해봅시다.
nginx -V 2>&1 | grep -o with-http_stub_status_modulewith-http-_stub_status_module위 결과가 나온다면 계속 진행하면 되지만 아니라면 Monitoring NGINX 글을 참조하여 수정해봅시다.
다음으로 metrics에 접근 가능한 경로를 설정해줍시다. NGINX 전역 설정 파일인
/etc/nginx/nginx.conf를 수정해줍시다. Read-Only 파일이기 때문에 관리자 권한으로 수정해줍시다.
sudo vi /etc/nginx/nginx.confserver directive는 그냥 추가할 수 없기 때문에 http directive내에 server directive 설정을 추가해줍시다.
server {
    listen  80 default_server;
    listen  [::]:80 default_server;

    location /metrics {
        stub_status;
        allow all;
    }
}allow에는 허용할 IP를 적어주시면 됩니다. deny에 거부할 IP를 적을 수도 있습니다.
설정이 끝났다면 NGINX를 다시 시작하고 다음 명령어를 통해 확인해봅시다.
curl localhost/metrics아래와 같은 결과가 나온다면 성공입니다.
Active connections: 2
server accepts handled requests
 122 122 910
Reading: 0 Writing: 1 Waiting: 1
NGINX Prometheus Exporter 설정
이제 NGINX Prometheus Exporter를 실행해봅시다.
NGINX Prometheus Exporter가 설치된 디렉토리에서 다음 명령어를 적용해봅시다.
nohup ./nginx-prometheus-exporter -nginx.scrape-uri=http://localhost/metrics --web.listen-address=:8080 &-nginx.scrape-uri 뒤에 metrics를 모을 ip주소를 적어줍시다. 현재 localhost이기 때문에 http://localhost/metrics로 설정하겠습니다. service 등록을 통해 향후 편하게 할 수도 있습니다. 관련 내용은 Creating a Linux service with systemd를 참조해주세요.
이번 exporter는 -web.listen-address=:8080를 통해 8080으로 연결해보겠습니다. 남는 포트로 진행해주세요👍
이제 {ip}:8080/metrics로 접근하면 MySQL Server Exporter에 의해 수집된 metrics들을 볼 수 있습니다.
# HELP nginx_connections_accepted Accepted client connections
# TYPE nginx_connections_accepted counter
nginx_connections_accepted 124
# HELP nginx_connections_active Active client connections
# TYPE nginx_connections_active gauge
nginx_connections_active 1
# HELP nginx_connections_handled Handled client connections
# TYPE nginx_connections_handled counter
nginx_connections_handled 124
# HELP nginx_connections_reading Connections where NGINX is reading the request header
# TYPE nginx_connections_reading gauge
nginx_connections_reading 0
# HELP nginx_connections_waiting Idle client connections
# TYPE nginx_connections_waiting gauge
nginx_connections_waiting 0
이제 이 스파이가 쌓은 정보를 Prometheus가 수집할 겁니다.
Prometheus
이전 글을 참조해주세요🤸♂️
Grafana
이전 글을 참조해주세요🤸♂️
Dashboard 연결
저희는 NGINX PLUS가 아니기에 자세한 정보들을 모으지는 못하지만, 구르미(gurumee92)님의 간단한 metrics들을 모니터링하는 Dashboard를 사용해보겠습니다.
dashboard by gurumee92
복사한 JSON을 Grafana에서 Dashboards -> +import에 진입하여 import 해줍시다.
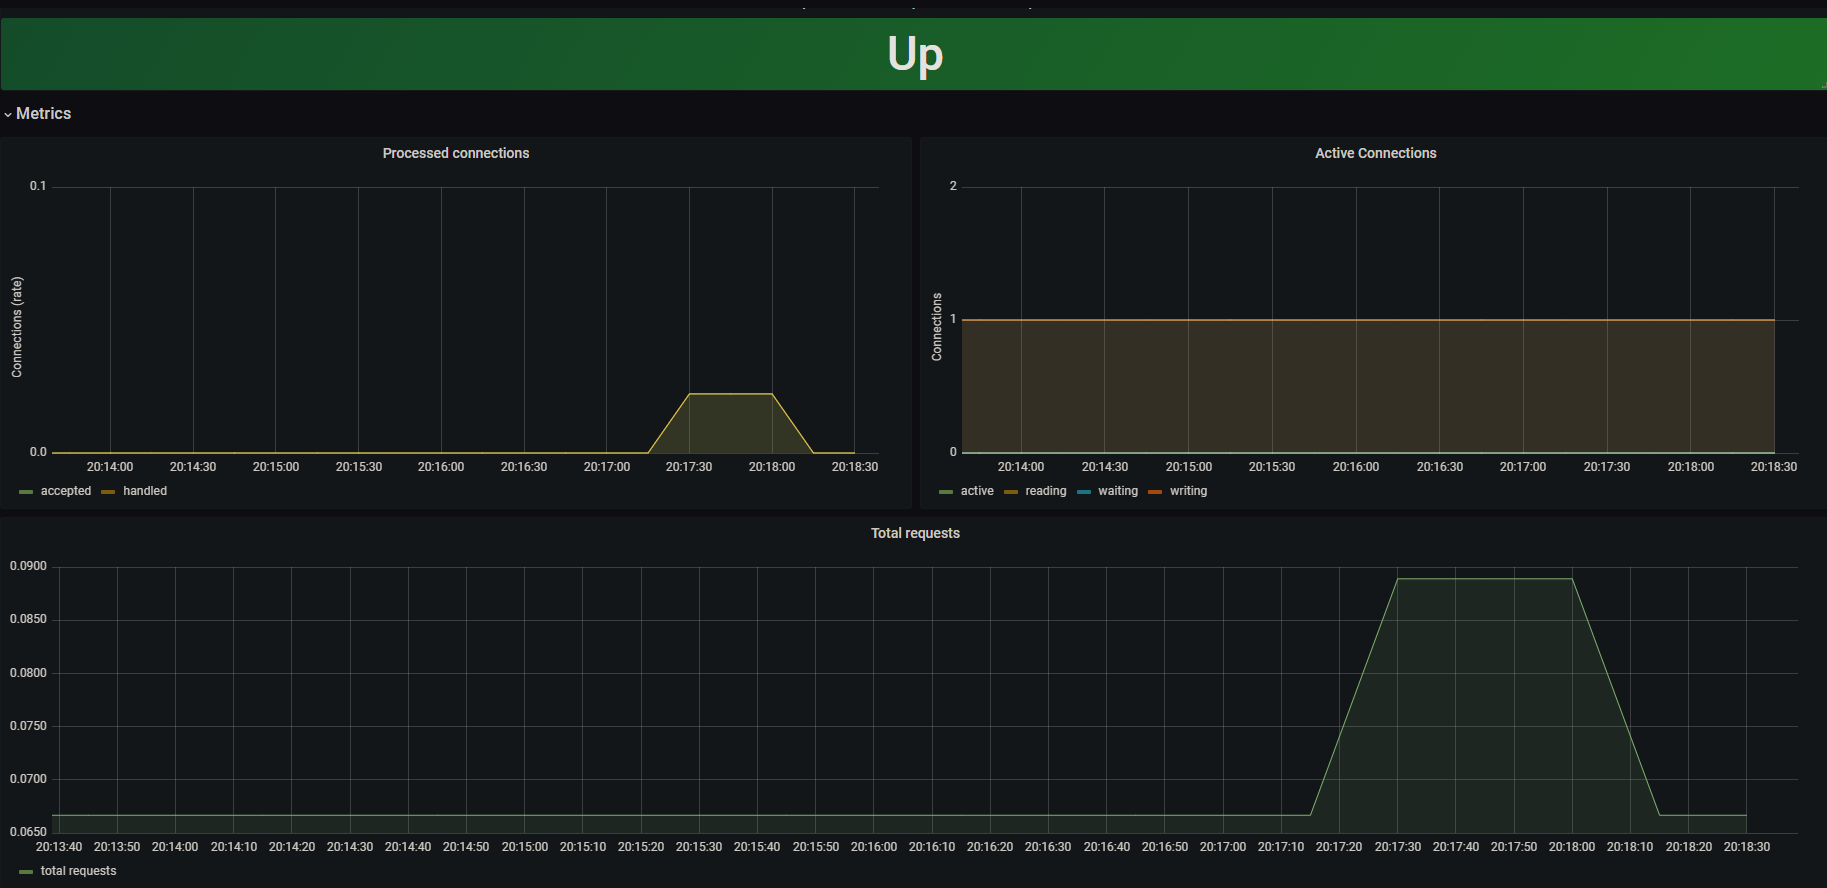
위와 같이 NGINX의 간단한 metrics를 모니터링 할 수 있습니다🌟
참고
NGINX Prometheus Exporter repository
서비스 메트릭 모니터링하기 (1) prometheus-nginxlog-exporter
Monitoring NGINX