도커가 돌아가는 서버 모니터링을 위한 시스템을 구축하고자 한다.
앞에는 내가 공부한 내용이니까 코드가 궁금하다면 마지막에 가서 코드 복붙 하면 잘 돌아갈거에요 :)
알아둬야 할 기술
- prometheus
- grafana
- node exporter
- cAdvisor
prometheus 아키텍처
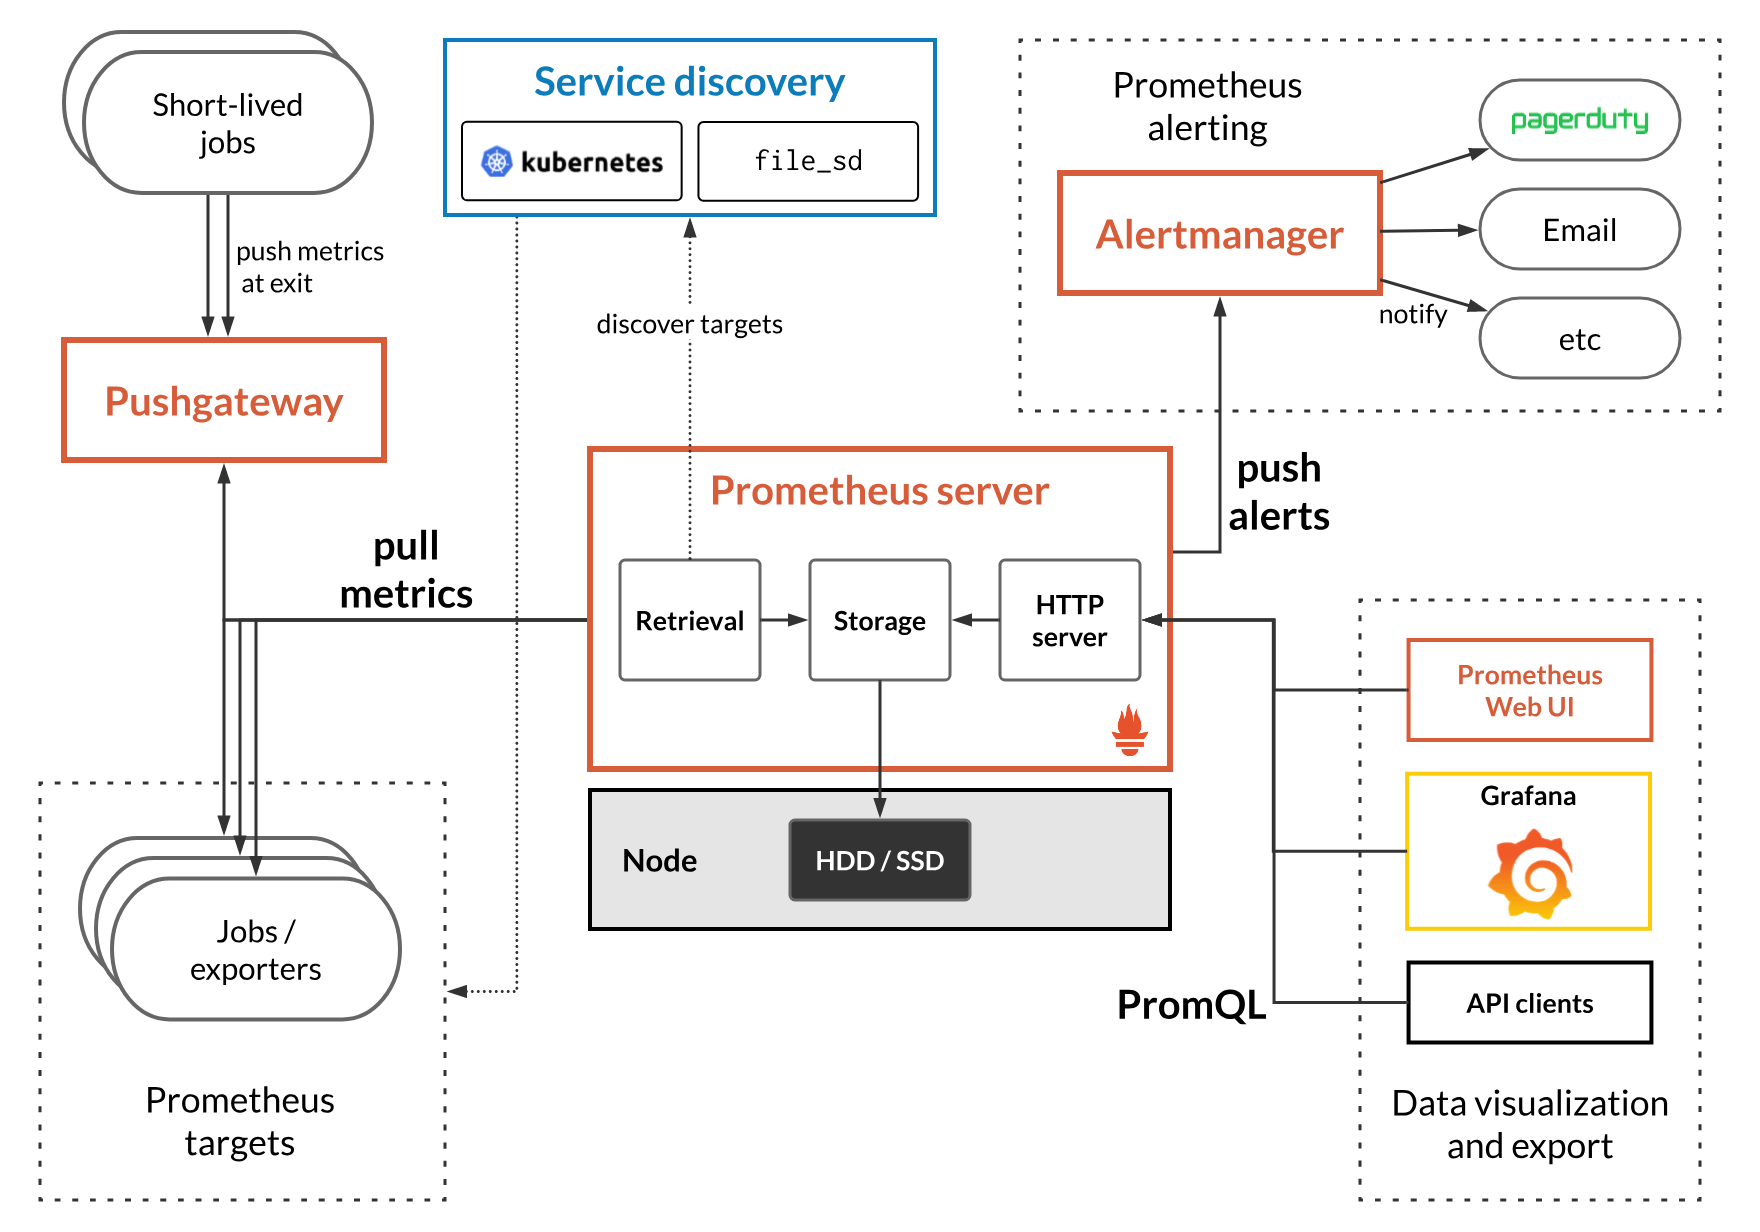
prometheus
- 모니터링 대상이 되는 메트릭(키 값 쌍으로 캡처된 단순한 숫자 측정) 데이터를 pull 방식으로 수집
- metric 데이터에는 CPU사용량, 시간당 데이터 처리량, 분당 네트워크 속도 등등이 있다.
- Retrieval 이 메트릭을 수집할 대상에 접근해서 메트릭을 가져오거나, pushgateway를 통해서 접근할 수 없는 곳에 있는 데이터를 가져옴
- 가져온 데이터는 시간 흐름에 따라 조회할 수 있어야 하므로 저장소가 prometheus에 구현되어 있고, key, value 형태의 저장소이다.
- 이 저장소에 있는 데이터는 PromQL을 통한 쿼리문으로 조회 가능
Exporter
- cadvisor, node exporter 사용
- exporter는 prometheus가 pull 방식으로 데이터를 수집할 수 있도록 메트릭을 노출하는 친구
- 서버들로 부터 메트릭을 수집해 /metrics HTTP endpoint를 제공 prometheus는 이를 통해 export가 열어 놓은 HTTP endpoint로 Get 요청을 날려 메트릭을 수집
grafana
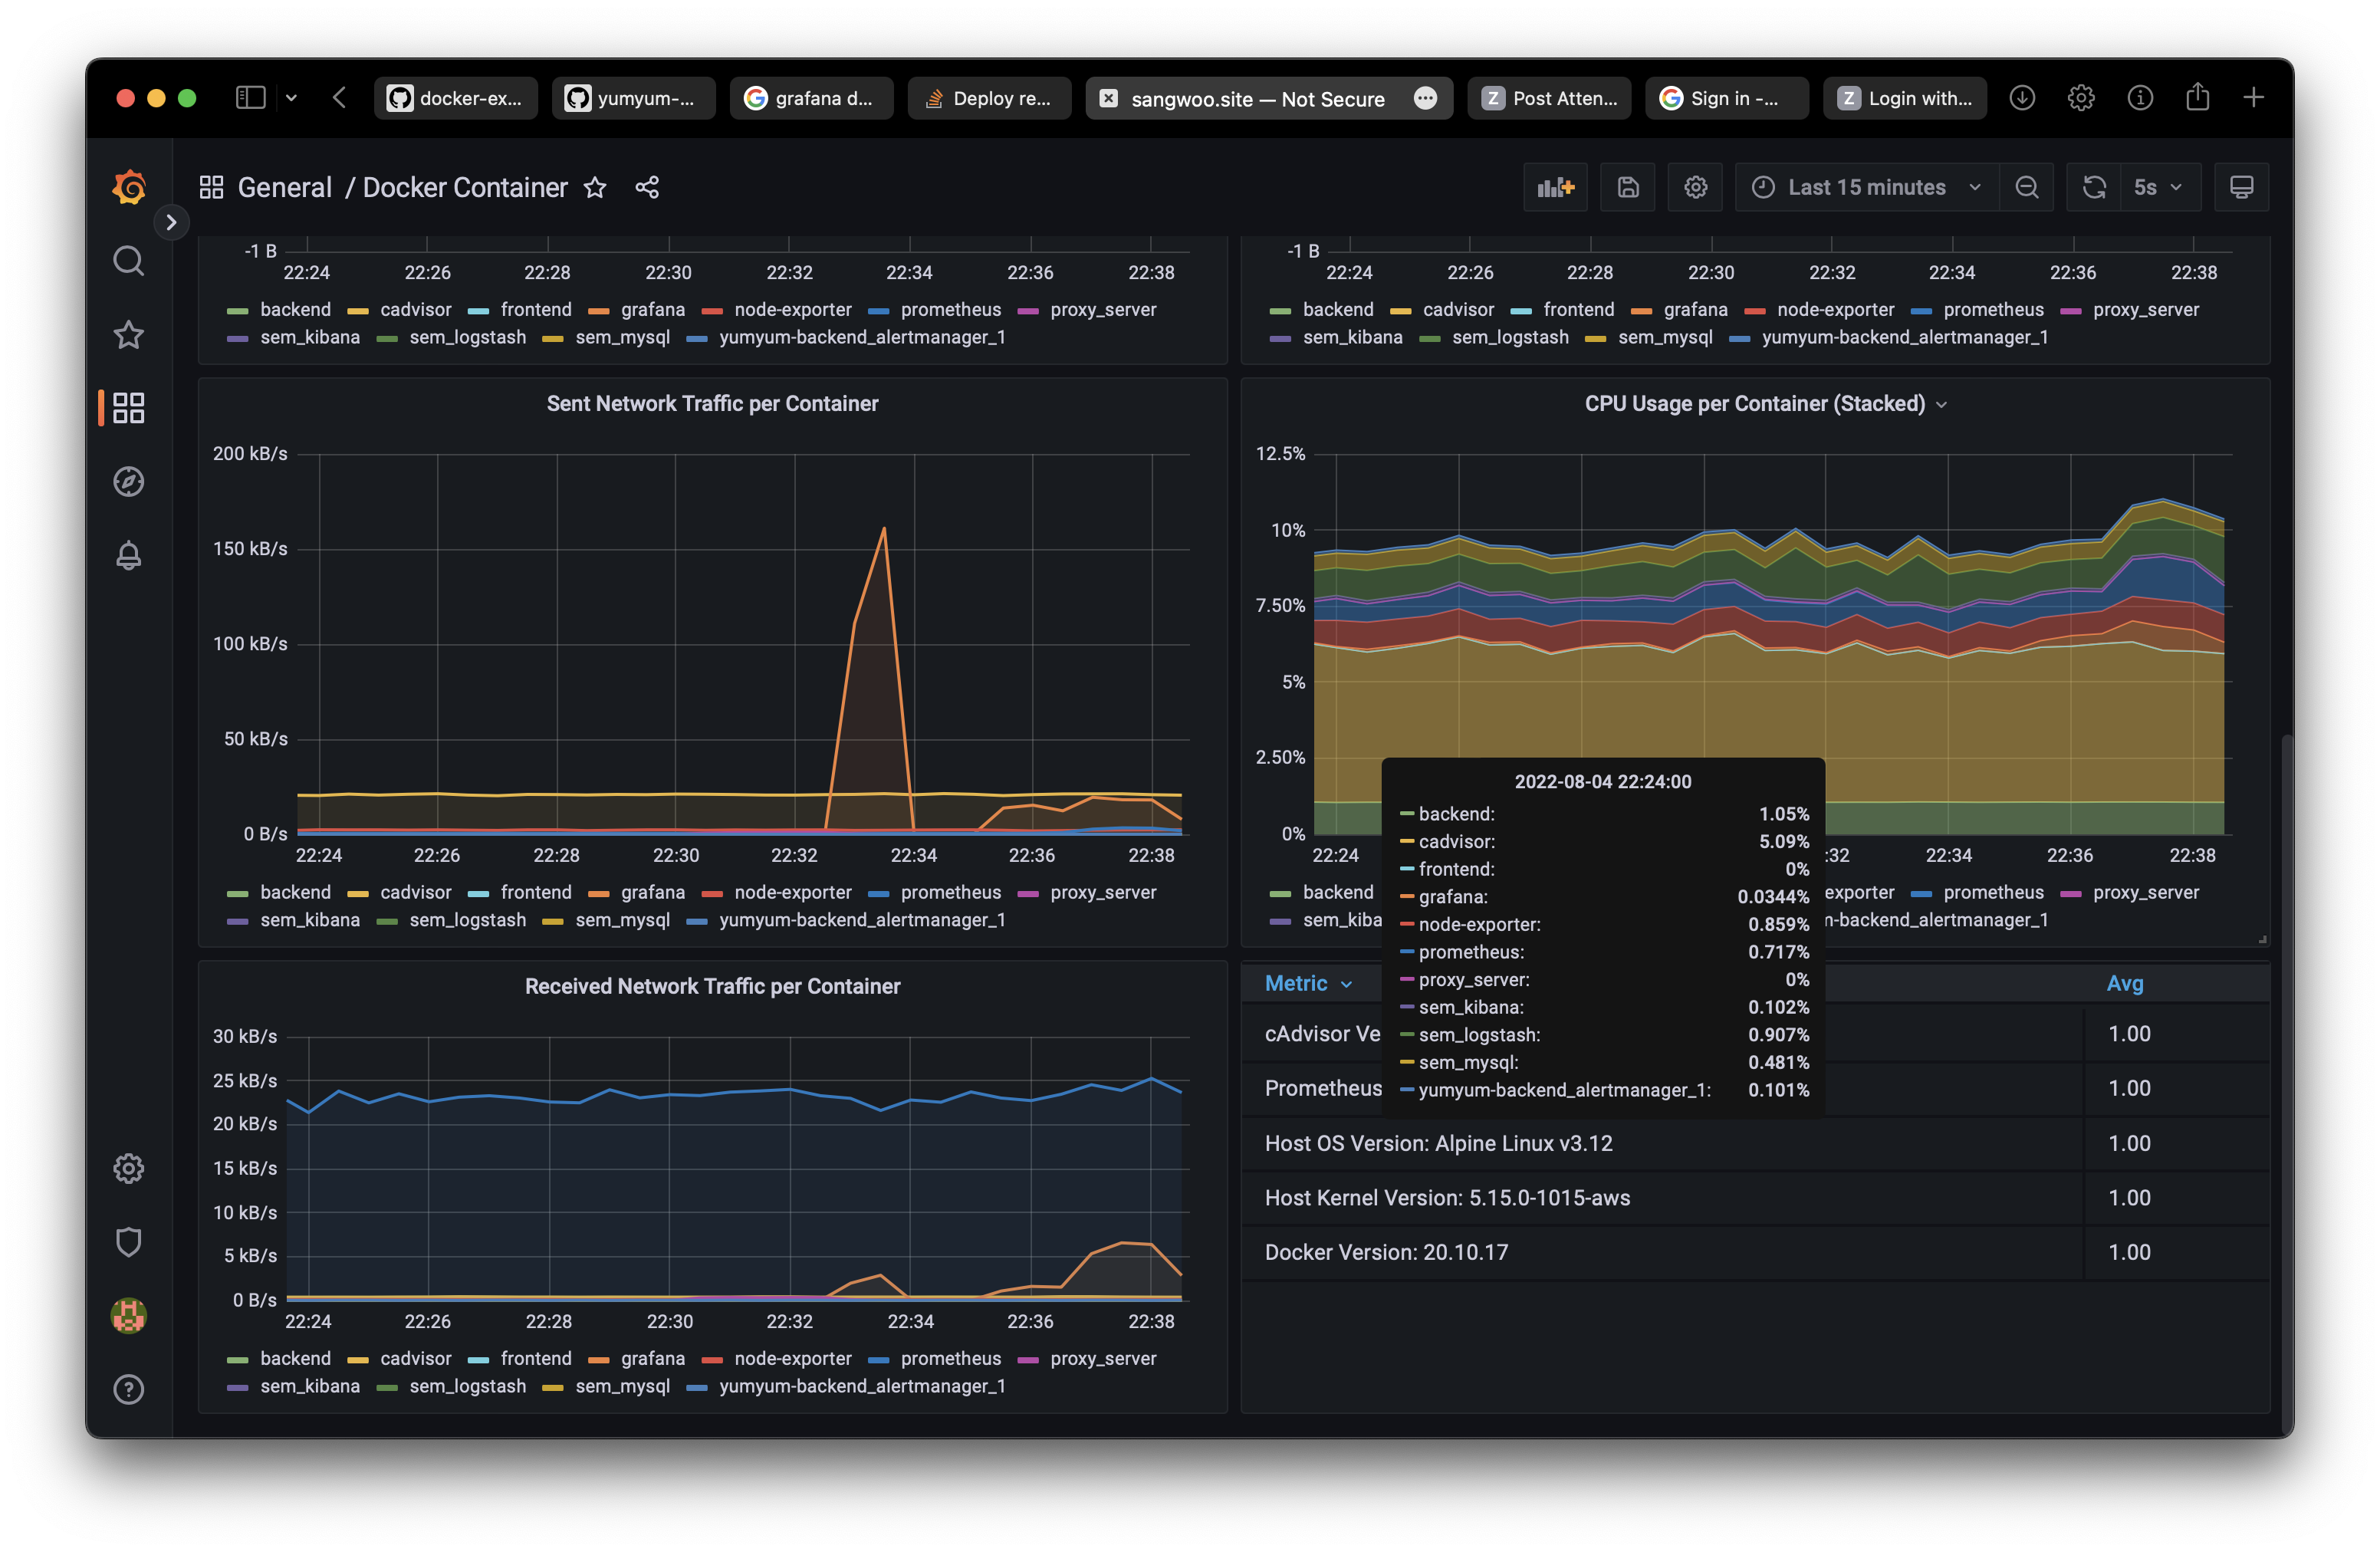
- Grafana는 메트릭 데이터 시각화 도구로 메트릭 분석 플랫폼을 지향하고 있다. 모니터링하고자 하는 data source에 prometheus를 추가하면 prometheus에서 수집한 메트릭을 dashboard에서 시각화 하여 볼 수 있다. (cadvisor dashboard : 11600 )
모니터링을 하는 목적은 결국 특정 컨테이너나 호스트 서버의 이상을 감지하는것이다. 하루종일 모니터링을 하면서 이상을 감지할 수는 없는 법이기에, 이를 알람을 통해서 알면 좋다. **prom/alertmanager** 를 통해 알림을 보내줄 수 있고, 협업을 위해 자주 사용되는 slack 에 특정 모니터링 채널을 만들어 알림을 받을 수 있게 해놨다.
이슈
구조를 이해하는데 처음에 많은 시간을 쏟았다
큰 틀은 결국 "node exporter와 cadvisor를 통해 메트릭을 수집하고 이를 프로메테우스가 받아 grafana로 시각화한다" 로 정리할 수 있다.
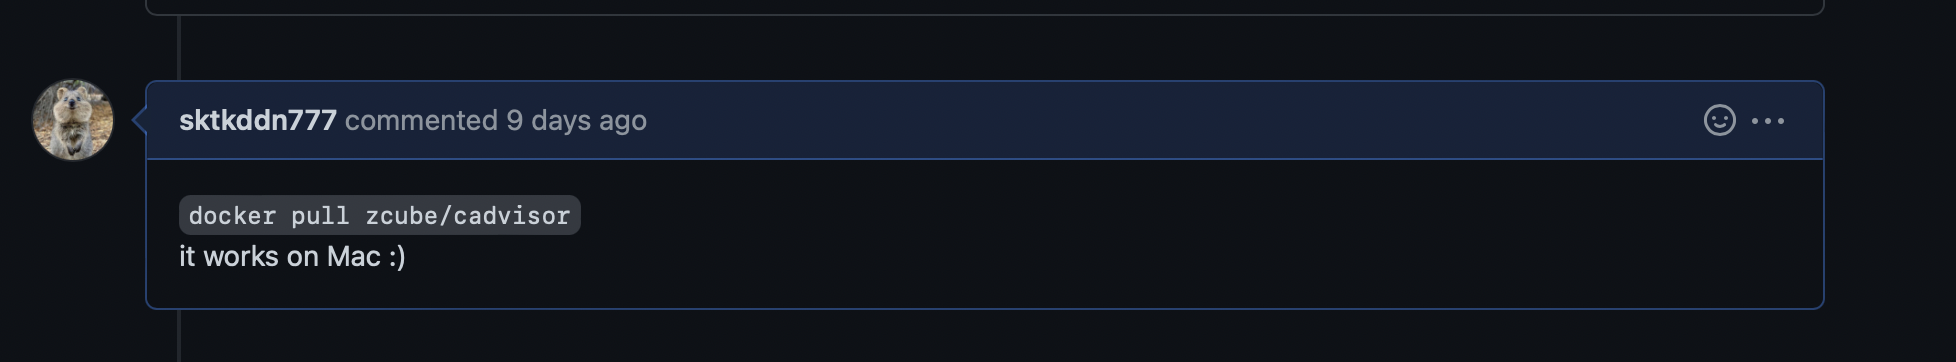
맥으로 cadvisor를 돌리려고 했는데, 오류가 났다
알아보니 m1 칩으로 cadvisor를 돌릴 때 문제가 있다고 그런다 이슈
나도 이글을 읽어보다 새로운 이미지(zcube/cadvisor)로 pull해서 돌리니까 잘 되어서 코멘트 하나 남겼다 :) 하지만, 실제론 ec2위에서 돌릴 예정이기에 공식 이미지를 사용해도 문제가 없다.
알림 기능을 구현하는데도 많은 시간을 쏟았다
slack을 통해 웹훅 url을 받아, 이상이 감지되면 slack에 알림이 오도록
깃허브 링크에 들어가면,alertmanager폴더에 알림을 받을 매개체를 지정할 수 있다. 또한,prometheus/alert.rules로 들어가보면 알림이 발생되는 조건을 설정할 수 있다. 조건 설정 완료후, 프로메테우스에 알림 기능을 설정하면 된다.
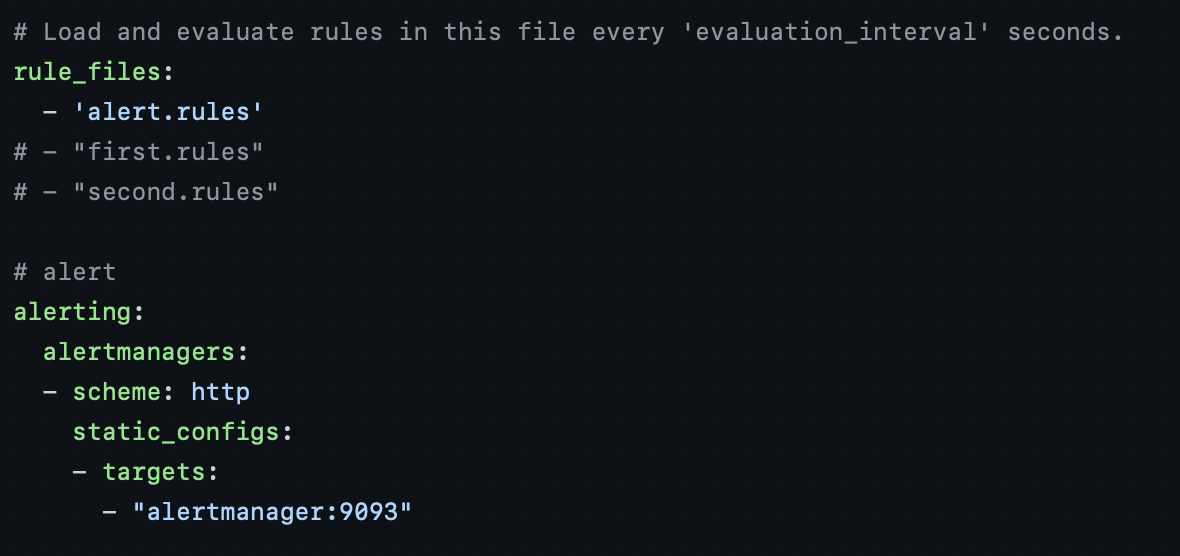
<참고> 알림 규칙
- name: alert.rules
  rules:
  - alert: InstanceDown
    expr: up == 0
    for: 1m
    labels:
      severity: "critical"
    annotations:
      summary: "Endpoint {{ $labels.instance }} down"
      description: "{{ $labels.instance }} of job {{ $labels.job }} has been down for more than 1 minutes."

  - alert: HostOutOfMemory
    expr: node_memory_MemAvailable_bytes / node_memory_MemTotal_bytes * 100 < 10
    for: 2m
    labels:
      severity: warning
    annotations:
      summary: "Host out of memory (instance {{ $labels.instance }})"
      description: "Node memory is filling up (< 10% left)\n  VALUE = {{ $value }}\n  LABELS: {{ $labels }}"

  - alert: HostMemoryUnderMemoryPressure
    expr: rate(node_vmstat_pgmajfault[1m]) > 1000
    for: 2m
    labels:
      severity: warning
    annotations:
      summary: "Host memory under memory pressure (instance {{ $labels.instance }})"
      description: "The node is under heavy memory pressure. High rate of major page faults\n  VALUE = {{ $value }}\n  LABELS: {{ $labels }}"
  - alert: HostOutOfDiskSpace
    expr: (node_filesystem_avail_bytes * 100) / node_filesystem_size_bytes < 10 and ON (instance, device, mountpoint) node_filesystem_readonly == 0
    for: 2m
    labels:
      severity: warning
    annotations:
      summary: "Host out of disk space (instance {{ $labels.instance }})"
      description: "Disk is almost full (< 10% left)\n  VALUE = {{ $value }}\n  LABELS: {{ $labels }}"

  - alert: HostHighCpuLoad
    expr: 100 - (avg by(instance) (rate(node_cpu_seconds_total{mode="idle"}[2m])) * 100) > 80
    for: 0m
    labels:
      severity: warning
    annotations:
      summary: "Host high CPU load (instance {{ $labels.instance }})"
      description: "CPU load is > 80%\n  VALUE = {{ $value }}\n  LABELS: {{ $labels }}"
내가 삽질했던 코드들을 공유함으로써 다른 사람들은 삽질 안했으면 좋겠다ㅎㅎ
각 포트 번호를 docker-compose 에 보면 부여해뒀으니
localhost:port_num 으로 들어가서 하고 싶은거 해보면 좋을거 같다
Github