✏️ 전체적인 구현 순서
- 객체의 변화를 Spring Event Lestener 를 통해 Snapshot 객체에 기록
- 기록한 Snapshot 객체를 List 에 담아 Model 을 통해 HTML 에 전달
- Google Charts 를 사용해 Snapshot 에 기록된 수치를 차트로 변환
✏️ Google Charts
📍 차트 고르기
- 왼쪽 매뉴에서 차트 겔러리를 선택하면 준비된 다양한 차트를 고를 수 있다.
- 가장 기본적인 열 차트를 사용했다.
📍 차트 복사하기
- 열 차트 페이지에서 다양한 열차트 표현 방법과 사용방법이 적혀있다.
- 마음에 드는 차트를 적당히 골라서 복사 후 html 에 붙여넣기 하면된다.
📍 차트 디테일 수정
var data- 차트 막대의 디테일한 설정을 할 수 있는 변수이다.
- 배열의 첫번째 인덱스는 순서대로
막대의 이름의 설명,막대 크기의 설명,{role: "style"}을 입력한다.{role: "style"}은 어떤 역할을 하는지 모르겠다.
- 그 다음 인덱스 부터는 순서대로
막대 이름,막대 크기,막대 색상을 조절할 수 있다.- 인덱스 하나가 막대 하나를 뜻한다.
- 타임리프의 inline 기능도 지원하기 때문에 동적 차트도 구현할 수 있다.
var opthonsvar data에서 설정하지 못한 부분을 설정할 수 있다.- title : 차트의 제목
- width, height : 차트의 상하 좌우 크기
- bar : 막대가 차지하는 면적
- 이 외에도 배경색 등등 다양한 옵션을 추가할 수 있는 것 같다.
✏️ 적용하기
- 타임리프를 이용해 Snapshot 객체가 담긴 List 를 Model 을 통해 넘겨받아 막대의 이름과 크기를 동적으로 구현했다.
<div th:fragment="chart (snapshotList)"
     class="w-full flex justify-center">

<!--    <div th:text=""></div>-->

    <script type="text/javascript" src="https://www.gstatic.com/charts/loader.js"></script>
    <script type="text/javascript" th:inline="javascript">
        google.charts.load("current", {packages: ['corechart']});
        google.charts.setOnLoadCallback(drawChart);

        function drawChart() {

            var data = google.visualization.arrayToDataTable([
                ["day", "solved count", {role: "style"}],
                [ [[${snapshotList.get(6).dayOfWeek}]], [[${snapshotList.get(6).solvedBaekJoon()}]], "color: #8b5cf6"],
                [ [[${snapshotList.get(5).dayOfWeek}]], [[${snapshotList.get(5).solvedBaekJoon()}]], "color: #8b5cf6"],
                [ [[${snapshotList.get(4).dayOfWeek}]], [[${snapshotList.get(4).solvedBaekJoon()}]], "color: #8b5cf6"],
                [ [[${snapshotList.get(3).dayOfWeek}]], [[${snapshotList.get(3).solvedBaekJoon()}]], "color: #8b5cf6"],
                [ [[${snapshotList.get(2).dayOfWeek}]], [[${snapshotList.get(2).solvedBaekJoon()}]], "color: #8b5cf6"],
                [ [[${snapshotList.get(1).dayOfWeek}]], [[${snapshotList.get(1).solvedBaekJoon()}]], "color: #8b5cf6"],
                [ [[${snapshotList.get(0).dayOfWeek}]], [[${snapshotList.get(0).solvedBaekJoon()}]], "color: #8b5cf6"]
            ]);

            var view = new google.visualization.DataView(data);
            view.setColumns([0, 1,
                {
                    calc: "stringify",
                    sourceColumn: 1,
                    type: "string",
                    role: "annotation"
                },
                2]);

            var options = {
                title: "1주간 해결한 문제",
                width: 500,
                height: 350,
                bar: {groupWidth: "80%"},
                legend: {position: "none"},

            };
            var chart = new google.visualization.ColumnChart(document.getElementById("columnchart_values"));
            chart.draw(view, options);
        }
    </script>
    <div id="columnchart_values" style="width: 900px; height: 300px;"></div>

</div>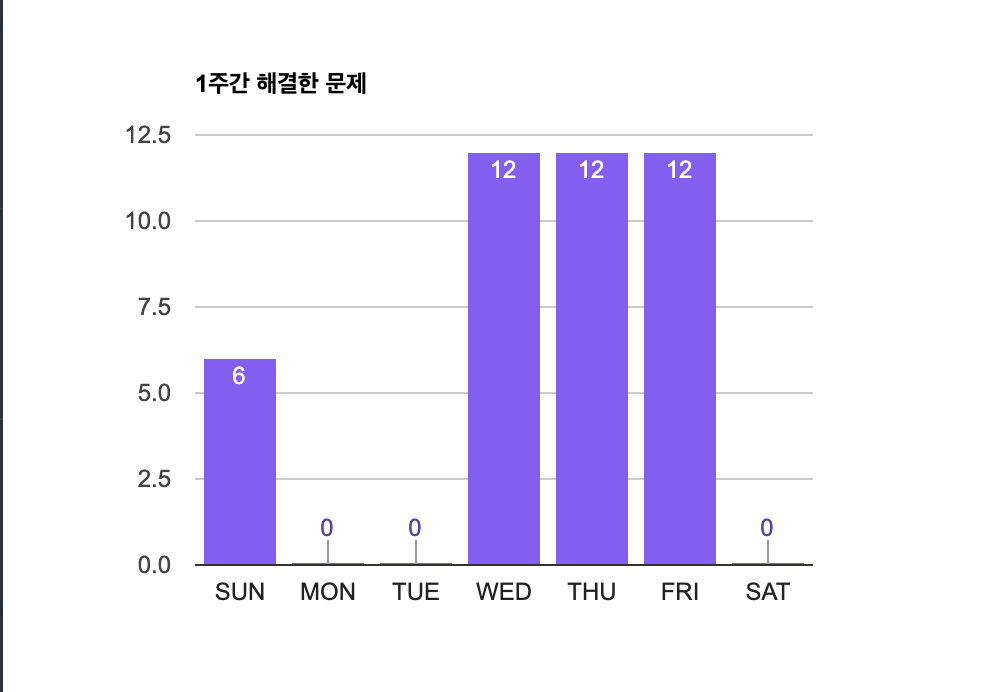

잘못된 내용 PR 환영