NetworkX
import networkx as nxG = nx.Graph() G.add_node(1) G.add_nodes_from([2,3]) G.add_edge(1,2) #edge는 한번에 2개씩 연결가능 g.add_edges_from([(1,2),(1,3),(1,4),(1,5)]) print(G.nodes()) print(G.edges()) #[1,2,3] #[(1,2)]중복 값이 있을 경우 중복 값 제외한 값 추가
nx.draw
nxdraw(G, with_labels=True, node_color='lightblue',edge_color='grey')
with labes => 라벨 출력, node_color => 색,
node_size= 디폴트값 300 and 차수에 비례하려면 [n*100 for n in degree]nx.draw(G,with_labels=True, node_color='lightblue')
엣지와 노드 동시 생성
path_graph()
G=nx.path_graph(n)
n개 노드,엣지 생성(0,1,2,....,n)
add_path()
G = nx.Graph()
nx.add_path(G,[리스트으으~])
degree()
특정 노드에 연결된 선 => 차수라고 함
G.degree(n) n노드의 연결된 선 숫자 출력
G.degree([n,n+1])
엣지와 노드 삭제
remove_edge()
G.remove_edge(n,n+1)
G.remove_edges_from([(n,n+1),(),...])
remove_node()
G.remove_node(n,n+1)
G.remove_nodes_from([(n,n+1),(),...])
엣지와 노드의 개수
number_of_nodes()
G.number_of_nodes()
number_of_edges()
G.number_of_edges()
최단경로 구하기
G.add_edge('a','b',weight=)
labels = nx.get_edge_attributes(G,'weight)
print(labels)
nx.draw(G,with_labels=True,node_color='lightblue',edge_color='grey')
G.add_edge(node1,node2,weight=가중치)
- n - int
The number of nodes
k - int
Each node is joined with its k nearest neighbors in a ring topology.
p - float
The probability of rewiring each edge
erdos_renyi_graph(n,p)
베르누이 시행에 근거한 방식이다.
G = nx.erdos_renyi_graph(25,0.2)
nx.draw(G)
베르누이 시행
일정한 확률을 주고 동저느이 앞면이나 뒷면이 나오게 하는 방법이다. rvs 메소드에 확률을 입력하여 값을 얻어낼수 있다. rvs(p=0.33) 입력하면 6개중에 1이 나올 확률은 2번이다.
from scipy.stats import bernoulli
for i in range(6):
	print(bernoulli.rvs(p=0.33))
numpy => networkx 그래프
nx.to_networkx_graph()
한 개의 데이터 세트에서 다수 개의 그래프를 분리
=>connected_component_subgraphs
G=nx.to_networkx_graph() 이후 ksub=G.subgraph(c) for c in nx.connected_components(G)
klist=list(ksub)
nx.draw(klist[0],with_label=True, node_color='yellow',edge_color='red')
예제
import numpy as np
import networkx as nx
import matplotlib.pyplot as plt
from scipy.stats import bernoulli
>
def erdosGraph(N,p):
  G = nx.Graph()
  G.add_nodes_from(range(N))
  listG = list(G.nodes())
 >
  for i,node1 in enumerate(listG):
    for node2 in listG[i+1:]:
      if(bernoulli.rvs(p=p)):
        G.add_edge(node1,node2)
  return G
nx.draw(erdosGraph(20,0.18)) # 그냥 그래프
G1 = erdosGraph(89,0.3)
plt.hist(list([d for idx, d in G1.degree()]), histtype='step') #히스토그램
watts_strogatz_graph(n,k,p)
G = nx.watts_strogatz_graph(30,10,0.1)
nx.draw(G)
barabasi_albert_graph(n,p)
G = barabasi_albert_graph(n,p)
nx.draw(G)
random_lobster(n,k,p)
G=nx.random_loster(25,0.9,0.9)
nx.draw(G)
엑셀파일로 그래프 생성
엑셀
(0,0) (1,0) (2,0) (3,0)
(0,1) (1,1) (2,1) (3,1)
(0,2) (1,2) (2,2) (3,2)
(0,3) (1,3) (2,3) (3,3).....
위 사진은 (1,0)와 (0,1)이 연결 (1,2)와 (2,1)이 연결된다 라는 뜻
이런식으로 출력
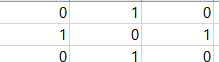
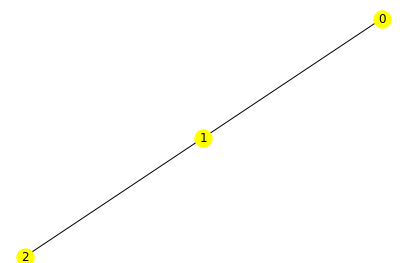
k = np.loadtxt("test.csv",delimiter=",")
G = nx.to_networkx_graph(k)
print(G.nodes())
nx.draw(G,with_labels=True, node_color='yellow')
- [(n,d) for n,d in G.degree()]
n => 노드 d => 차수