ChartOCR: Data Extraction from Charts Images via a Deep Hybrid Framework (WACV 2021)
Paper Review
목록 보기
22/51

Introduction
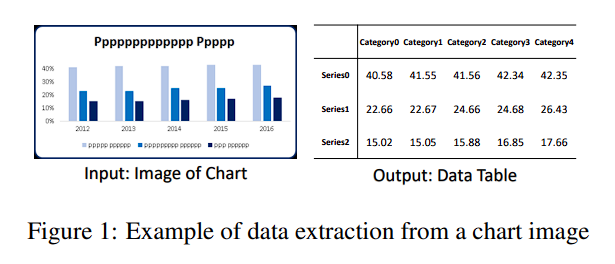
- Chart를 Table로 변환하는 작업은 Key
- Rule-Base 기반 approach는 유사 style에는 잘 작동하지만, 다양한 chart에는 적용하기 어려움
- DNN 기반 approach는 정확도를 향상시켰으나, 모든 chart type에 적용할 수 없음
- 우리는 Chart Component Detection을 key point detection으로 생각
- chart data extraction은 단순히 chart images로 변환
- DNN과 Rule-Based를 접목시킴
* Information Extraction (key point와 chart type을 획득)- type specific rule을 적용해 data component를 재구성
- component를 data format에 맞게 transform
- 우리의 새로운 평가 지표와 데이터 셋을 통해 SOTA 입증
Related Work
Rule-based Methods
- color copntinuous search, edge extraction 등을 통해 raw component를 찾음
- predifined rule을 통해 wrong candidate를 제거
- hand-crafted rule과 pre-defined feature에 크게 의존한다는 점, 다양한 type에 적용하지 못한다는 한계를 가짐
- 유저 interaction을 바탕으로 error correction을 구현한 ChartSense 등이 있지만, time cost가 증가함
Deep Neural Networks
- Bar chart, Pie chart 등에서 DNN을 적용한 모델이 존재
- time efficiency를 증대했지만, chart type에 restrained 됨
Keypoint-based Object Detection
- Pose detection, Face detection 등 다양한 아이디어의 기반
- Bounding box를 detecting 하는 것이 아닌, key point를 detecting
- pose detection에서의 관절, face detection에서의 얼굴 요소 등 우리는 chart에서의 component를 key로 detection 할 것
- chart가 어떻게 구성되어 있던, 우리는 component만 detecting하면 됨
- detection 이후 rule 기바으로 complete object 생성
Our Method
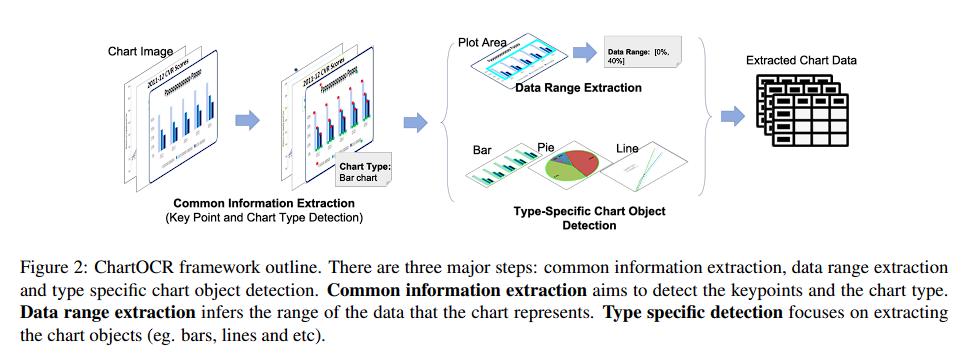
- three major part로 구분 가능
* common information extraction- data range extraction
- type specific detection
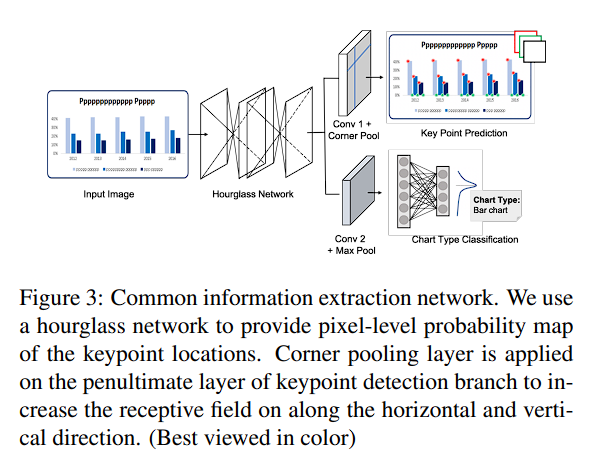
Common Information Extraction
Key Point Detection
- chart style과 무관하게 chart component를 detection
- 따라서 module을 다르게 train할 필요가 없음
- unseen style에 경우, fine tuning을 통해 사용할 수 있음
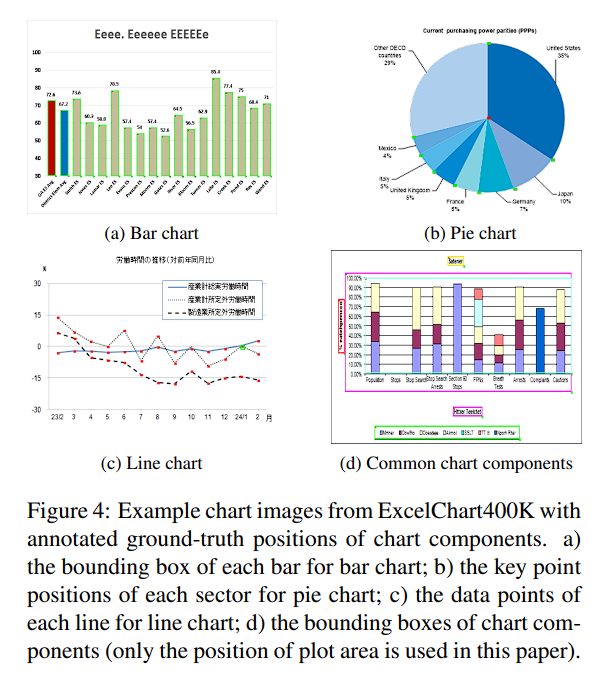
- key point는 chart마다 다르게 설정해주어야 함
* bar chart는 top-left, bottom-right corner- line chart는 pivot points on the line
- pie chart는 center points와 차트를 구분하는 arc
- CornerNet, Hourglass Net을 backbone으로 사용
- top-left, bottom-right, background 세 가지를 예측하며 CornerNet의 corner pooling layer를 통해 key point를 better localize 하려 함
Chart Type Classification
- Hourglass Network에서 나온 output을 FC Network를 통해 chart type prediction을 진행
- Softmax
Data Range Extraction
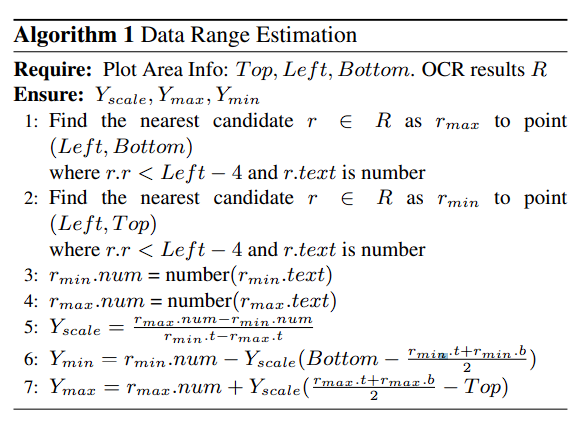
- key point의 image pixel을 numerical reading
- pie chart는 무조건 전체 percentage가 100%이기에, data range를 추출할 필요 없음
- Microsoft OCR APU를 통해 text를 추출
범례, 제목, axis-label을 추출
data range는 y-axis label과만 관계 있음 - 다음 알고리즘을 통해 range를 extraction
Type-specific Chart Object Detection
Bar Chart

- threshold 0.4 이상인 key point만 측정
- 수직일 시 감마를 크게 주고 수평일 시 반대
Pie Chart
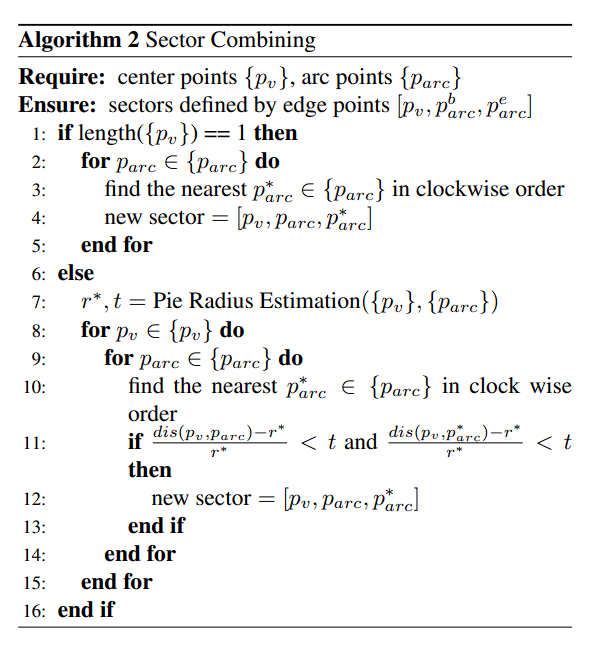
- corner pooling layer를 center pooling layer로 대체함으로서 360도 이웃을 포착
- 모든 sector가 붙어있는 tight case와 하나 이상의 sector가 떨어져있는 exploded case로 구분
- 상기 알고리즘을 통해 구분지어 정보를 획득
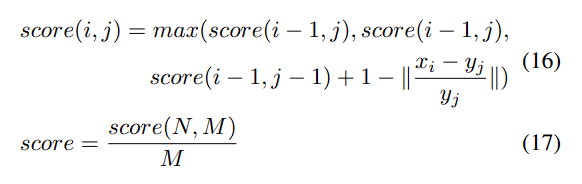
Line Chart
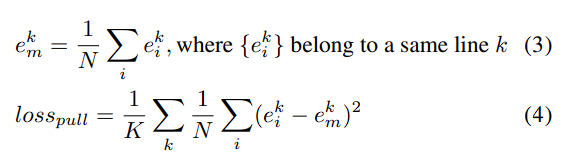
- pivot point를 key point로 detection
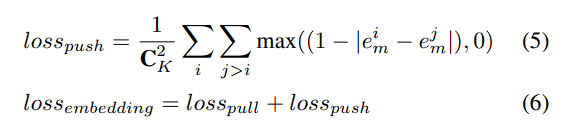
- 같은 라인일 때 embedding을 유사하게 하는 loss function 사용
- point loss와 embedding loss에 람다를 곱한 값을 합하여 total loss function을 최적화
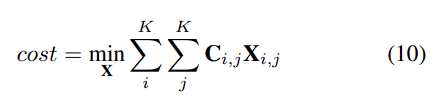
- hierarchical clustering을 통해 같은 line에 속하는 값들의 cluster를 생성
* 한 포인트가 두 개 이상의 라인에 속한다면 이상치로 판단- 이를 intersection point로 명한 뒤, Query network를 통해 어떤 라인에 속해야하는지 predict 함
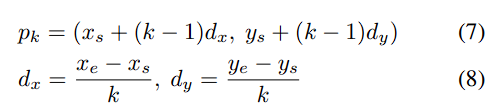
- s는 intersection point, e는 closest point assigned to a cluster
- K sample point를 QUERY network를 통과시켜 같은 라인에 속하는지 classify
- 이를 intersection point로 명한 뒤, Query network를 통해 어떤 라인에 속해야하는지 predict 함
Data Set
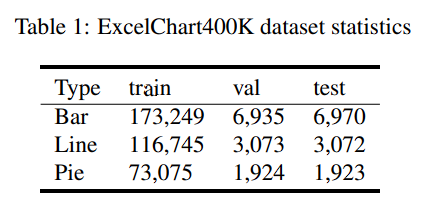
- FQA, WebData dataset은 100개의 image, 유사한 chart style로 인해 overfitting 가능성 높음
- ExcelChart400K는 우리가 web에서 수집한 데이터로 386,966 개의 chart image이며, numerical reading이 포함되어 있음
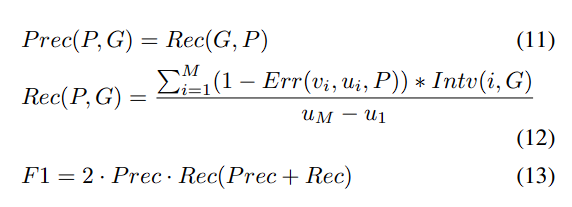
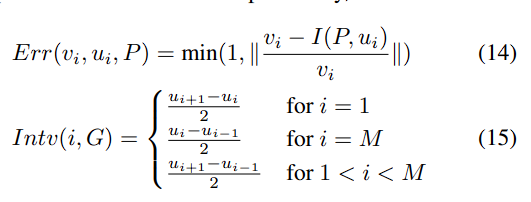
Evaluation Metric
Bar Chart
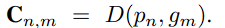
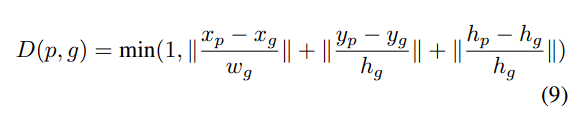
- x,y,w,h는 각각 bounding box의 요소
- pred인 p와 ground truth인 q
- w는 chart reading과 연관이 없기에, 학습에 사용하지 않음
Line Chart
Pie Chart