[Kaggle] 2018 Data Science Bowl 커널 둘러보기 1: Teaching notebook for total imaging newbies
2018 Data Science Bowl
다양한 이미지에서 세포핵 탐지 자동화 알고리즘을 만드는 것이 목표. 이를 통해 여러 질병 치료법 개발에 도움이 될 수 있다.
Teaching notebook for total imaging newbies
by Stephen Bailey
[원본 커널 링크]
이미지 데이터를 처음 다루는 사람들을 위한 입문 학습용으로 제작된 커널.
- 학습용 이미지 데이터 경로 변수에 저장
import pathlib
import imageio
import numpy as np

# Glob the training data and load a single image path
training_paths = pathlib.Path('../input/stage1_train').glob('*/images/*.png')
training_sorted = sorted([x for x in training_paths])
im_path = training_sorted[45]
im = imageio.imread(str(im_path))
Dealing with color
RGB, RGBA, Grayscale 등 여러 양식의 이미지를 편의상 sickit-image의 rgb2gray 함수를 사용하여 grayscale 양식으로 통일한다.
# Print the image dimensions
print('Original image shape: {}'.format(im.shape))

# Coerce the image into grayscale format (if not already)
from skimage.color import rgb2gray
im_gray = rgb2gray(im)
print('New image shape: {}'.format(im_gray.shape))
Original image shape: (520, 696, 4)
New image shape: (520, 696)
# Now, let's plot the data
import matplotlib.pyplot as plt

plt.figure(figsize=(10,4))

plt.subplot(1,2,1)
plt.imshow(im)
plt.axis('off')
plt.title('Original Image')

plt.subplot(1,2,2)
plt.imshow(im_gray, cmap='gray')
plt.axis('off')
plt.title('Grayscale Image')

plt.tight_layout()
plt.show()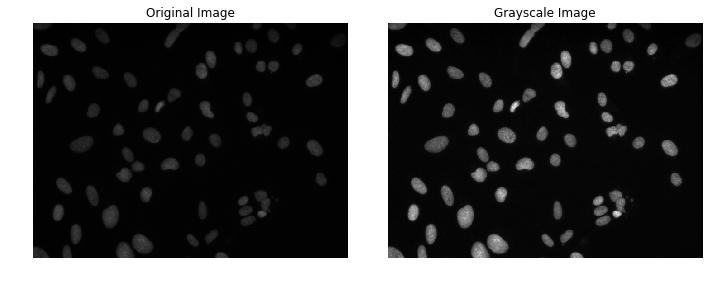
Removing background
이미지 데이터가 개체와 배경 둘로 나뉜다고 가정한다. 그럼 배경과 객체를 분리하는 적절한 기준값을 찾아서 배경을 제외한 객체에 해당하는 데이터만 분리하여 처리할 수 있다.
평균 또는 중앙값을 임계값으로 설정하지 않도록 하자.
여기서는 이미지를 양봉 분포로 모델링하여 최적의 분리값을 찾아주는 'otsu'를 사용한다.
from skimage.filters import threshold_otsu
thresh_val = threshold_otsu(im_gray)		# otsu방식의 임계값
mask = np.where(im_gray > thresh_val, 1, 0)	# 임계값 보다 큰 값은 1, 아닌 것은 0으로

# Make sure the larger portion of the mask is considered background
if np.sum(mask==0) < np.sum(mask==1):	# 혹시 1이 더 많으면
	mask = np.where(mask, 0, 1)	# 0과 1을 서로 바꿈
plt.figure(figsize=(10,4))
plt.subplot(1,2,1)
im_pixels = im_gray.flatten()
plt.hist(im_pixels,bins=50)
plt.vlines(thresh_val, 0, 100000, linestyle='--')
plt.ylim([0,50000])
plt.title('Grayscale Histogram')
plt.subplot(1,2,2)
mask_for_display = np.where(mask, mask, np.nan)
plt.imshow(im_gray, cmap='gray')
plt.imshow(mask_for_display, cmap='rainbow', alpha=0.5)
plt.axis('off')
plt.title('Image w/ Mask')
plt.show()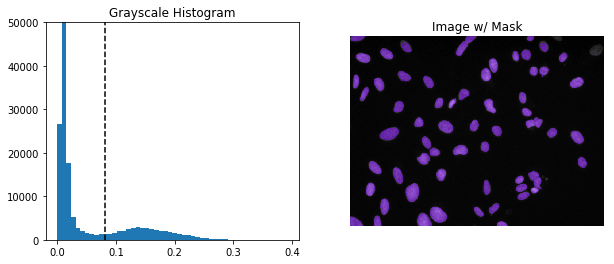
Deriving individual masks for each object
이미지 내에서 배경을 제외한 모든 개체를 찾아 ndimage.label()함수를 사용하여 각 개체에 번호를 라벨링한다.
해당 번호를 for문에 활용하여 각 개체 번호를 list 자료형에 담는다.
from scipy import ndimage
labels, nlabels = ndimage.label(mask)	# 연속된 개체끼리 라벨링, 전체 개체 개수 저장

label_arrays = []
for label_num in range(1, nlabels+1):
    label_mask = np.where(labels == label_num, 1, 0)	# 각 인덱스에 맞는 개체만 따로 뽑아 저장
    label_arrays.append(label_mask)

print('There are {} separate components / objects detected.'.format(nlabels))
There are 76 separate components / objects detected.
# Create a random colormap
from matplotlib.colors import ListedColormap
rand_cmap = ListedColormap(np.random.rand(256,3))

labels_for_display = np.where(labels > 0, labels, np.nan)
plt.imshow(im_gray, cmap='gray')
plt.imshow(labels_for_display, cmap=rand_cmap)
plt.axis('off')
plt.title('Labeled Cells ({} Nuclei)'.format(nlabels))
plt.show()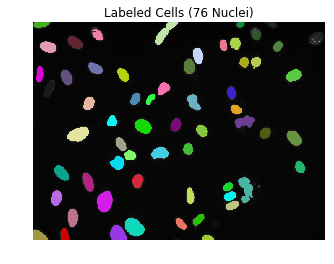
위와 같이 76개의 세포핵으로 구분된 사진에서 두가지 문제점이 확인된다.
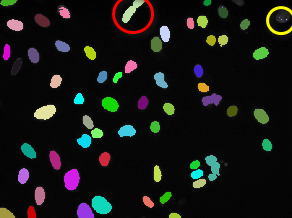
- 세포핵으로 구분된 1 픽셀짜리 점들 (우측 상단 노란 원 참고)
- 둘 이상의 세포핵이 겹쳐 하나로 인식된 경우 (상단 중앙 빨간 원 참고)
1번 문제를 해결하기 위해 ndimage.find_objects 메서드가 라벨링 된 개체의 좌표 정보를 리스트로 반환하기 때문에 이를 활용하여 각각 추가 작업을 진행할 수 있다.
이 작업을 통해 76개 중 16개의 너무 작은 개체값을 제외하여 총 60개의 개체값(세포핵)으로 분리했다.
for label_ind, label_coords in enumerate(ndimage.find_objects(labels)):	# 라벨 인덱스, 해당 영역 좌표
    cell = im_gray[label_coords]	# 이미지에서 해당 라벨의 영역 좌표에 해당하는 부분을 cell에 저장

    # Check if the label size is too small
    if np.product(cell.shape) < 10: # 영역의 넓이가 10 pixel 보다 작으면 배경처리
        print('Label {} is too small! Setting to 0.'.format(label_ind))
        mask = np.where(labels==label_ind+1, 0, mask)

# Regenerate the labels
labels, nlabels = ndimage.label(mask)
print('There are now {} separate components / objects detected.'.format(nlabels))
Label 4 is too small! Setting to 0.
Label 5 is too small! Setting to 0.
Label 7 is too small! Setting to 0.
Label 8 is too small! Setting to 0.
Label 9 is too small! Setting to 0.
Label 10 is too small! Setting to 0.
Label 14 is too small! Setting to 0.
Label 15 is too small! Setting to 0.
Label 16 is too small! Setting to 0.
Label 19 is too small! Setting to 0.
Label 21 is too small! Setting to 0.
Label 22 is too small! Setting to 0.
Label 23 is too small! Setting to 0.
Label 60 is too small! Setting to 0.
Label 61 is too small! Setting to 0.
Label 72 is too small! Setting to 0.
There are now 60 separate components / objects detected.
fig, axes = plt.subplots(1,6, figsize=(10,6))

for ii, obj_indices in enumerate(ndimage.find_objects(labels)[0:6]):
    cell = im_gray[obj_indices]
    axes[ii].imshow(cell, cmap='gray')
    axes[ii].axis('off')
    axes[ii].set_title('Label #{}\nSize: {}'.format(ii+1, cell.shape))

plt.tight_layout()
plt.show()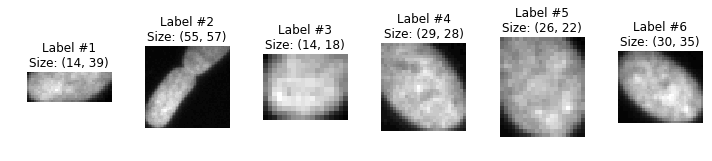
Label #2와 같이 두 개의 세포핵이 겹쳐지며 하나로 인식되는 문제를 해결하기 위해 마스크를 축소하여 세포 간의 차이를 벌릴 수 있는지 확인한다. 이를 mask erosion(마스크 침식)이라고 부른다. 확인 후에는 원래 비율을 회복하기 위해 다시 확장시킬 수 있다.
# Get the object indices, and perform a binary opening procedure
two_cell_indices = ndimage.find_objects(labels)[1]
cell_mask = mask[two_cell_indices]
cell_mask_opened = ndimage.binary_opening(cell_mask, iterations=8)
fig, axes = plt.subplots(1,4, figsize=(12,4))
axes[0].imshow(im_gray[two_cell_indices], cmap='gray')
axes[0].set_title('Original object')
axes[1].imshow(mask[two_cell_indices], cmap='gray')
axes[1].set_title('Original mask')
axes[2].imshow(cell_mask_opened, cmap='gray')
axes[2].set_title('Opened mask')
axes[3].imshow(im_gray[two_cell_indices]*cell_mask_opened, cmap='gray')
axes[3].set_title('Opened object')
for ax in axes:
ax.axis('off')
plt.tight_layout()
plt.show()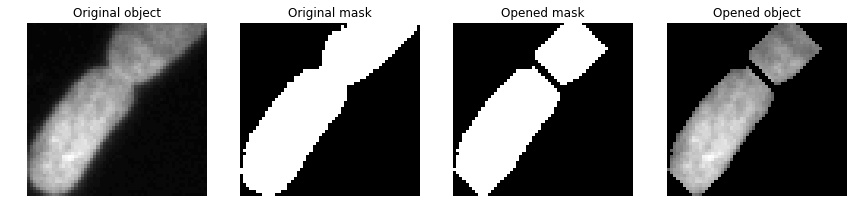
Convert each labeled object to Run Line Encoding
마지막으로 각 label_mask를 "Run Line Encoded" 문자열로 인코딩해야 한다. 기본적으로 array를 순회하며 mask의 일부인 픽셀을 찾으면 인덱싱하고, 해당 mask가 몇 개의 픽셀로 이루어져 있는지 세어본다. 새로운 mask의 시작점 픽셀을 찾을 때마다 이것을 반복한다.
def rle_encoding(x):
    '''
    x: numpy array of shape (height, width), 1 - mask, 0 - background
    Returns run length as list
    '''
    dots = np.where(x.T.flatten()==1)[0] # .T sets Fortran order down-then-right
    run_lengths = []
    prev = -2
    for b in dots:
        if (b>prev+1): run_lengths.extend((b+1, 0))
        run_lengths[-1] += 1
        prev = b
    return " ".join([str(i) for i in run_lengths])

print('RLE Encoding for the current mask is: {}'.format(rle_encoding(label_mask)))
RLE Encoding for the current mask is: 210075 6 210593 8 211112 9 211631 10 212150 11 212669 12 213189 12 213709 12 214228 13 214748 13 215268 13 215788 13 216308 13 216828 13 217348 13 217869 12 218389 12 218909 12 219430 11 219950 11 220471 10 220991 10 221512 9 222033 8 222554 7 223075 6 223596 5 224117 4 224639 2
Combine it into a single function
무식한 방법으로 하나의 이미지를 처리하는 기본적인 단계들을 살펴보았으니 이것을 하나의 함수로 통합할 수 있을 것이다.
이 함수는 하나의 이미지 경로를 입력받아 위에서 살펴본 프로세스를 수행하며 발견되는 각 mask의 RLE 문자열을 데이터 프레임으로 반환할 것이다.
또한, 데이터셋에 포함된 모든 이미지에 대해 위의 처리과정을 거쳐 하나의 데이터프레임으로 반환하는 함수도 만든다.
import pandas as pd

def analyze_image(im_path):
    '''
    Take an image_path (pathlib.Path object), preprocess and label it, extract the RLE strings
    and dump it into a Pandas DataFrame.
    '''
    # Read in data and convert to grayscale
    im_id = im_path.parts[-3]
    im = imageio.imread(str(im_path))
    im_gray = rgb2gray(im)

    # Mask out background and extract connected objects
    thresh_val = threshold_otsu(im_gray)
    mask = np.where(im_gray > thresh_val, 1, 0)
    if np.sum(mask==0) < np.sum(mask==1):
        mask = np.where(mask, 0, 1)
        labels, nlabels = ndimage.label(mask)
    labels, nlabels = ndimage.label(mask)

    # Loop through labels and add each to a DataFrame
    im_df = pd.DataFrame()
    for label_num in range(1, nlabels+1):
        label_mask = np.where(labels == label_num, 1, 0)
        if label_mask.flatten().sum() > 10:
            rle = rle_encoding(label_mask)
            s = pd.Series({'ImageId': im_id, 'EncodedPixels': rle})
            im_df = im_df.append(s, ignore_index=True)

    return im_df


def analyze_list_of_images(im_path_list):
    '''
    Takes a list of image paths (pathlib.Path objects), analyzes each,
    and returns a submission-ready DataFrame.'''
    all_df = pd.DataFrame()
    for im_path in im_path_list:
        im_df = analyze_image(im_path)
        all_df = all_df.append(im_df, ignore_index=True)

    return all_df
testing = pathlib.Path('../input/stage1_test/').glob('*/images/*.png')
df = analyze_list_of_images(list(testing))
df.to_csv('submission.csv', index=None)