연합뉴스 타이틀 주제 분류 데이터 탐색과 시각화
https://dacon.io/competitions/official/235747/overview/description
https://klue-benchmark.com
라이브러리 로드
import pandas as pd
import numpy as np
import seaborn as sns
import matplotlib.pyplot as plt

# 시각화를 위한 폰트 설정
import koreanize_matplotlib

%config InlineBackend.figure_format = 'retina'
데이터 로드 함수
import os, platform
base_path = "data/klue/"

def file_exist_check(base_path):
    if os.path.exists(f"{base_path}train_data.csv"):
        print(f"{base_path} 경로에 파일이 이미 있음")
        return

    if platform.system() == "Linux":
        print(f"파일을 다운로드 하고 {base_path} 경로에 압축을 해제함")
        !wget https://bit.ly/dacon-klue-open-zip
        if not os.path.exists(base_path):
            os.makedirs(base_path)
        !unzip dacon-klue-open-zip -d data/klue
    else:
        print(f"""https://dacon.io/competitions/official/235747/data 에서 다운로드 하고
              실습 경로 {base_path}에 옮겨주세요.""")
    return

file_exist_check(base_path)
>>>>
data/klue/ 경로에 파일이 이미 있음
학습, 예측 데이터
train = pd.read_csv(f"{base_path}train_data.csv", index_col='index')
test = pd.read_csv(f"{base_path}test_data.csv", index_col='index')
print(train.shape, test.shape)
display(train.head())
display(test.head())
>>>>
(45654, 2) (9131, 1)
- topic_dict.csv 불러오기
topic = pd.read_csv(f"{base_path}topic_dict.csv")
topic
>>>>
	topic	topic_idx
0	IT과학	0
1	경제		1
2	사회		2
3	생활문화	3
4	세계		4
5	스포츠	5
6	정치		6
전처리를 위한 데이터 병합
raw = pd.concat([train, test])
raw.shape
>>>>
(54785, 2)

raw.head(2)
>>>>
		title									topic_idx
index
0		인천→핀란드 항공기 결항…휴가철 여행객 분통			4.0
1 실리콘밸리 넘어서겠다…구글 15조원 들여 美전역 거점화 4.0- 실제 토픽명을 볼 수 있도록 topic_inx를 키 값으로 merge
df = raw.merge(topic, how='left')

raw.shape, df.shape
>>>>
((54785, 2), (54785, 3))

df.head(5)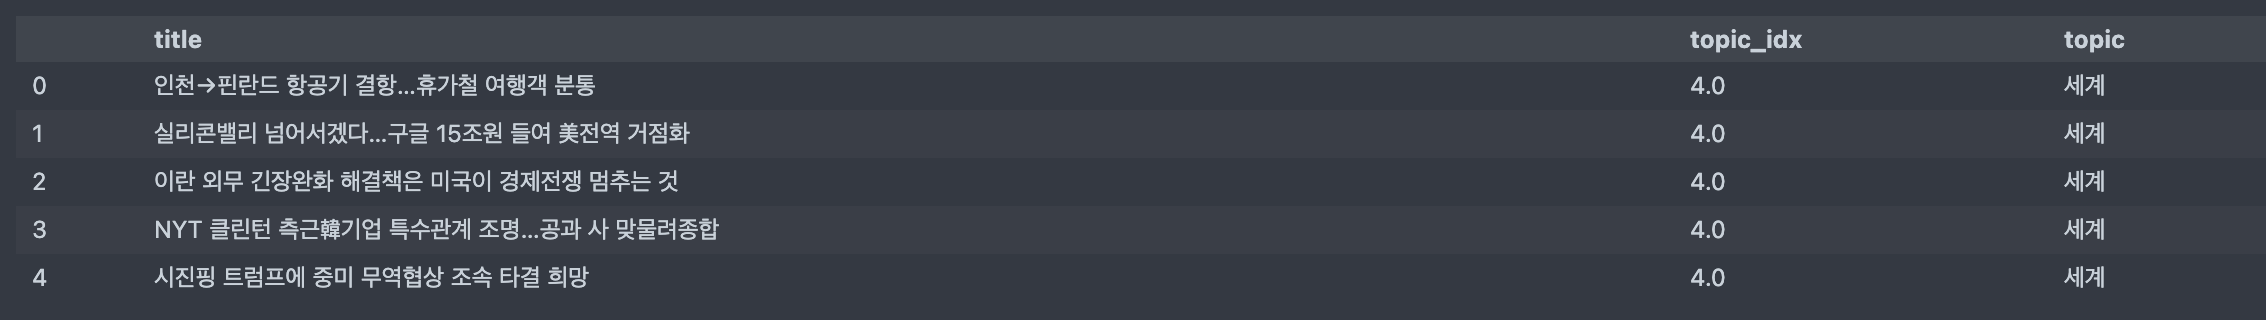
정답값 빈도수
- train 에서 제공되는 정답값의 빈도수
df['topic_idx'].value_counts()
>>>>
4.0    7629
2.0    7362
5.0    6933
6.0    6751
1.0    6222
3.0    5933
0.0    4824
Name: topic_idx, dtype: int64

# topic 빈도수
df['topic'].value_counts()
>>>>
세계      7629
사회      7362
스포츠     6933
정치      6751
경제      6222
생활문화    5933
IT과학    4824
Name: topic, dtype: int64- 시각화
sns.countplot(data=df, x='topic')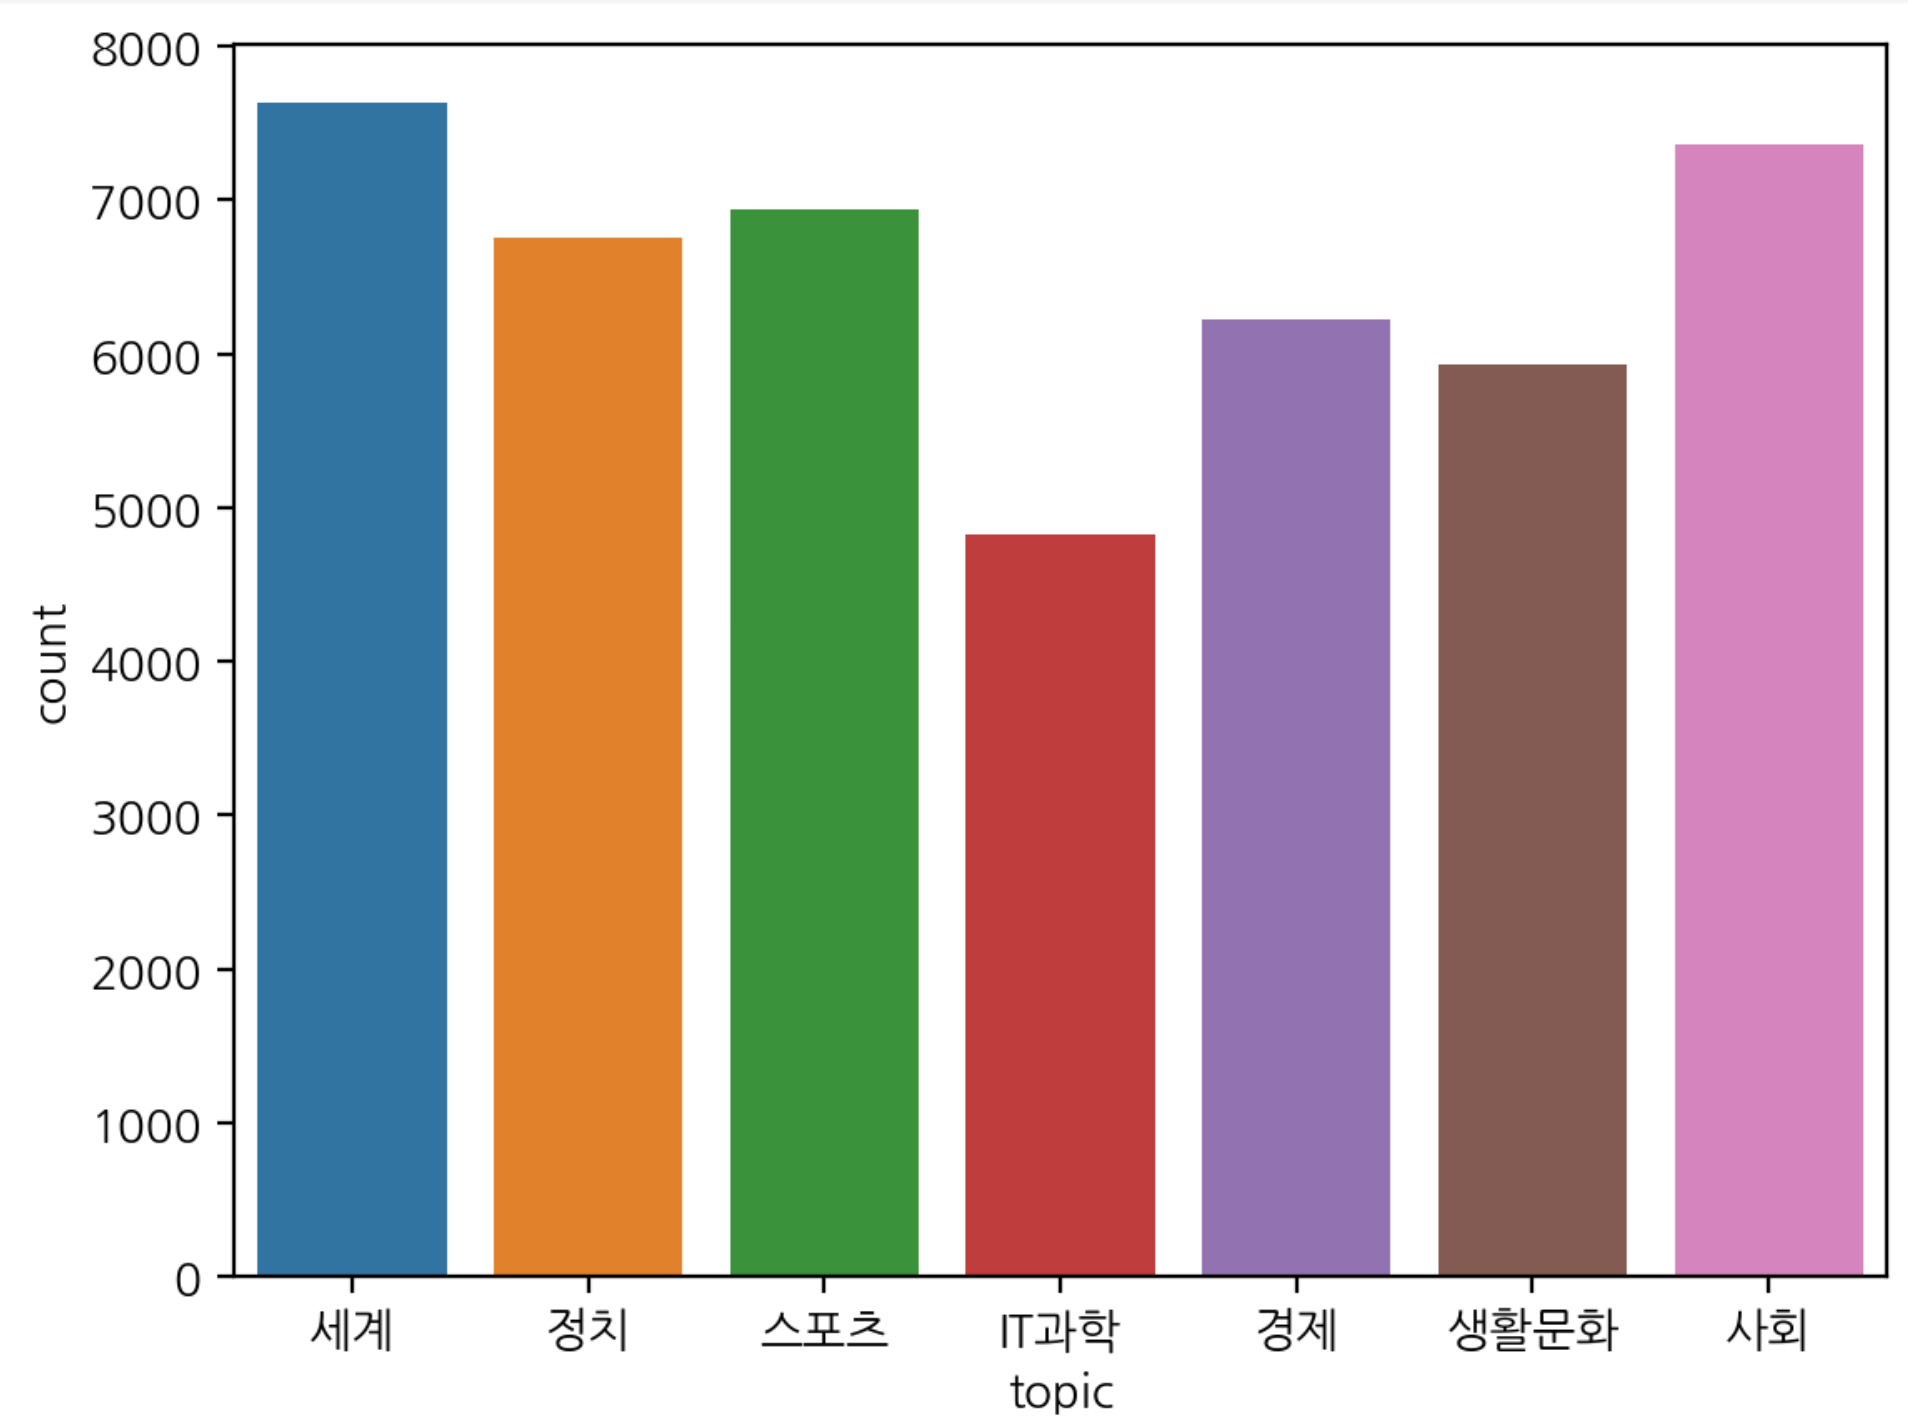
문자 길이
df['len'] = df['title'].map(lambda x: len(x))
df['word_count'] = df['title'].map(lambda x: len(x.split()))
# 형태소 분석기 사용하면 단어의 수 셀 때 중복을 더 제거할 수 있지만 띄어쓰기 기준으로 본다.
df['unique_word_count'] = df['title'].map(lambda x: len(set(x.split())))
df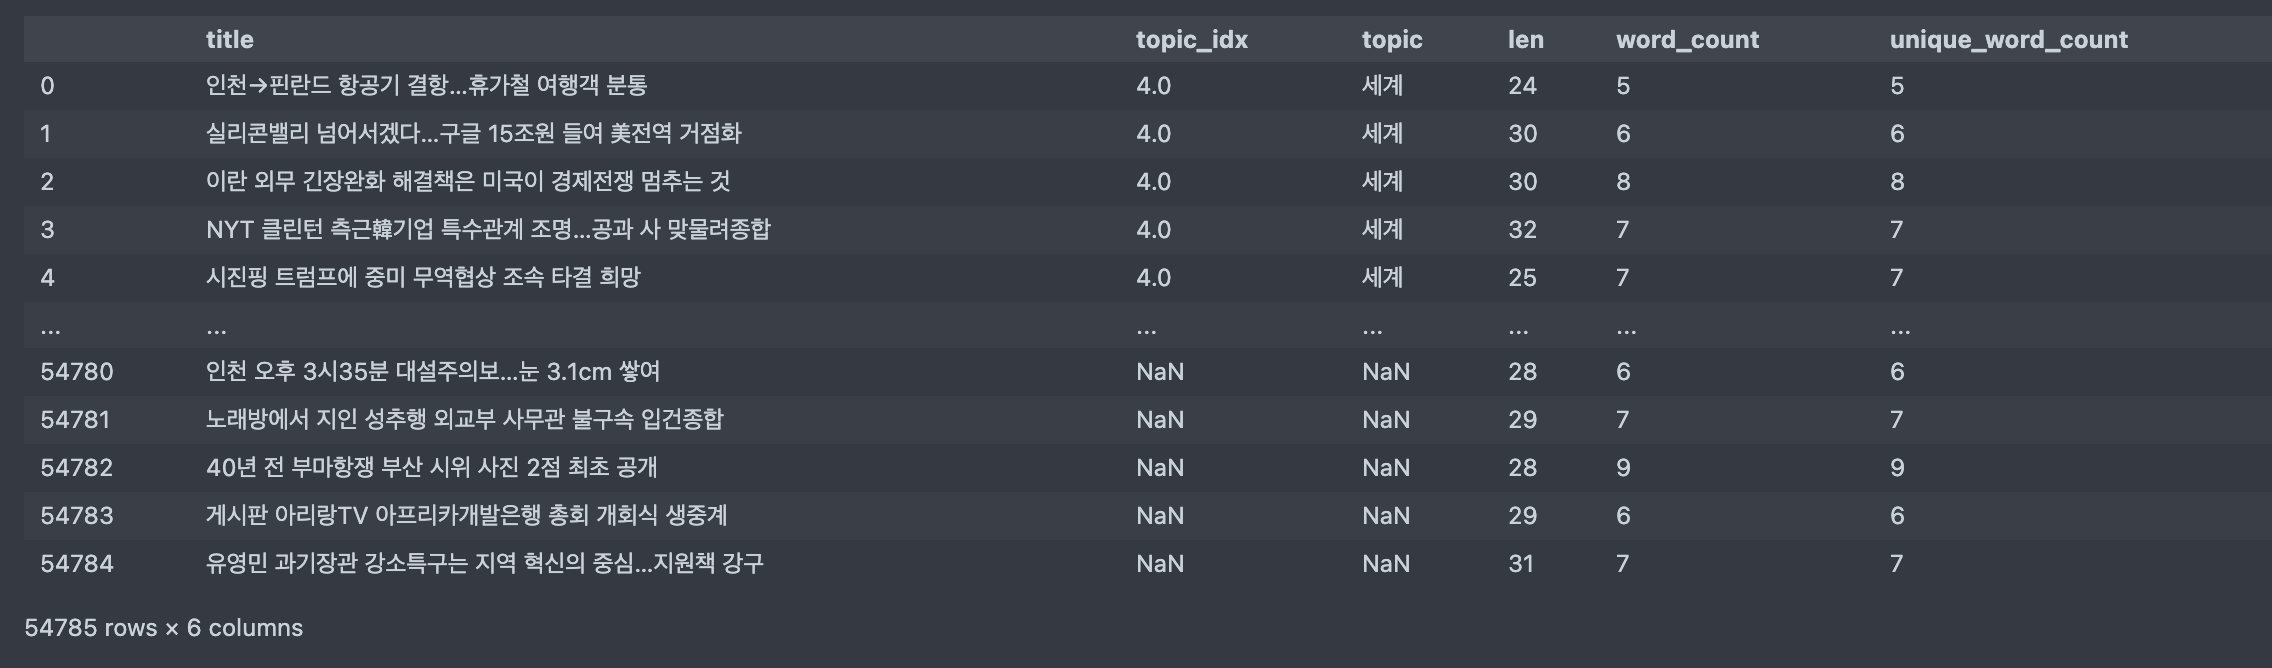
- 시각화
fig, axes = plt.subplots(ncols=3, figsize=(15, 4))
sns.histplot(data=df, x='len', ax=axes[0])
sns.histplot(data=df, x='word_count', ax=axes[1])
sns.histplot(data=df, x='unique_word_count', ax=axes[2])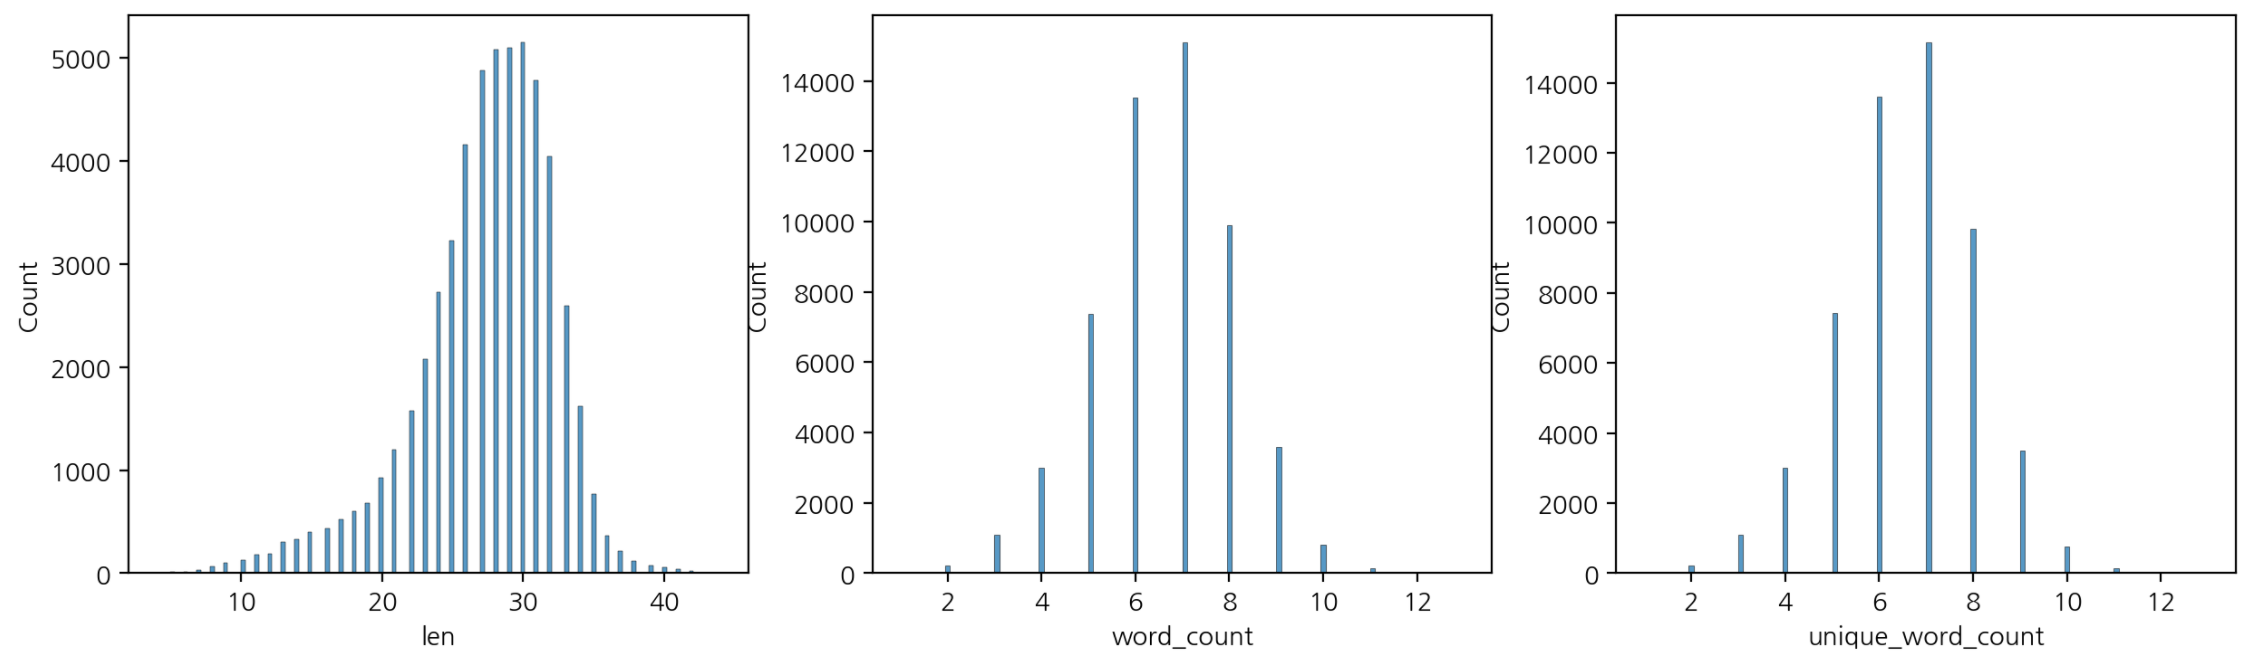
- 기술통계값
df[['len', 'word_count', 'unique_word_count']].describe()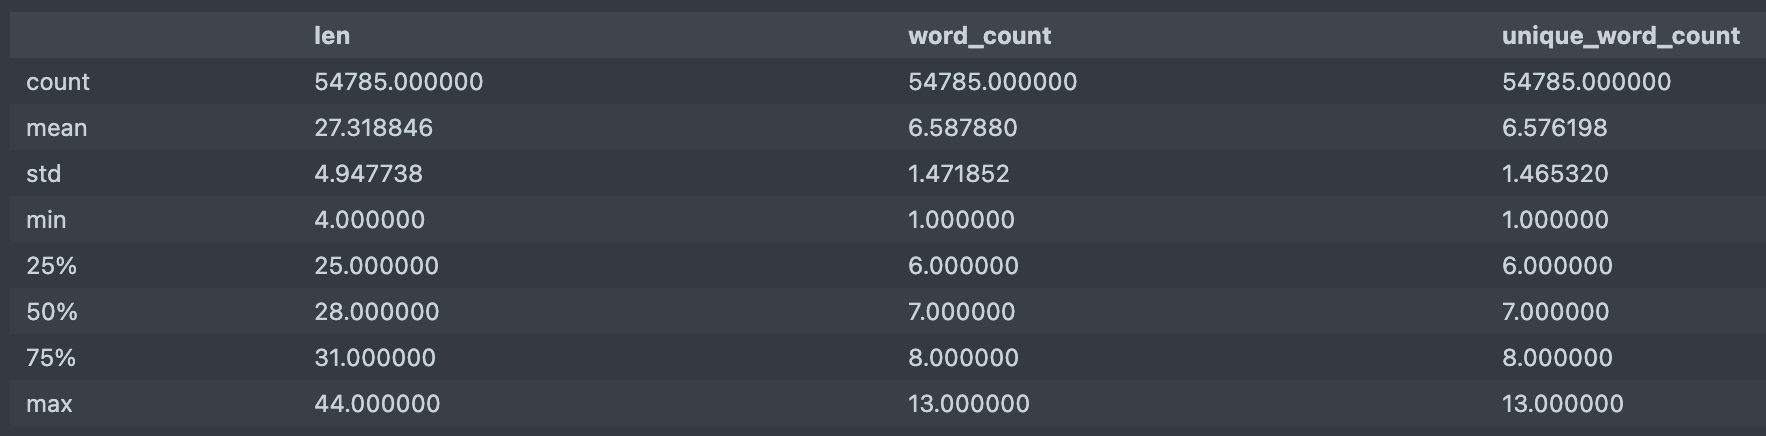
- 분포 시각화 (displot)
# topic 별 "len" 의 histplot 시각화
sns.displot(data=df, x='len', hue='topic', col='topic', col_wrap=2, aspect=5, height=2)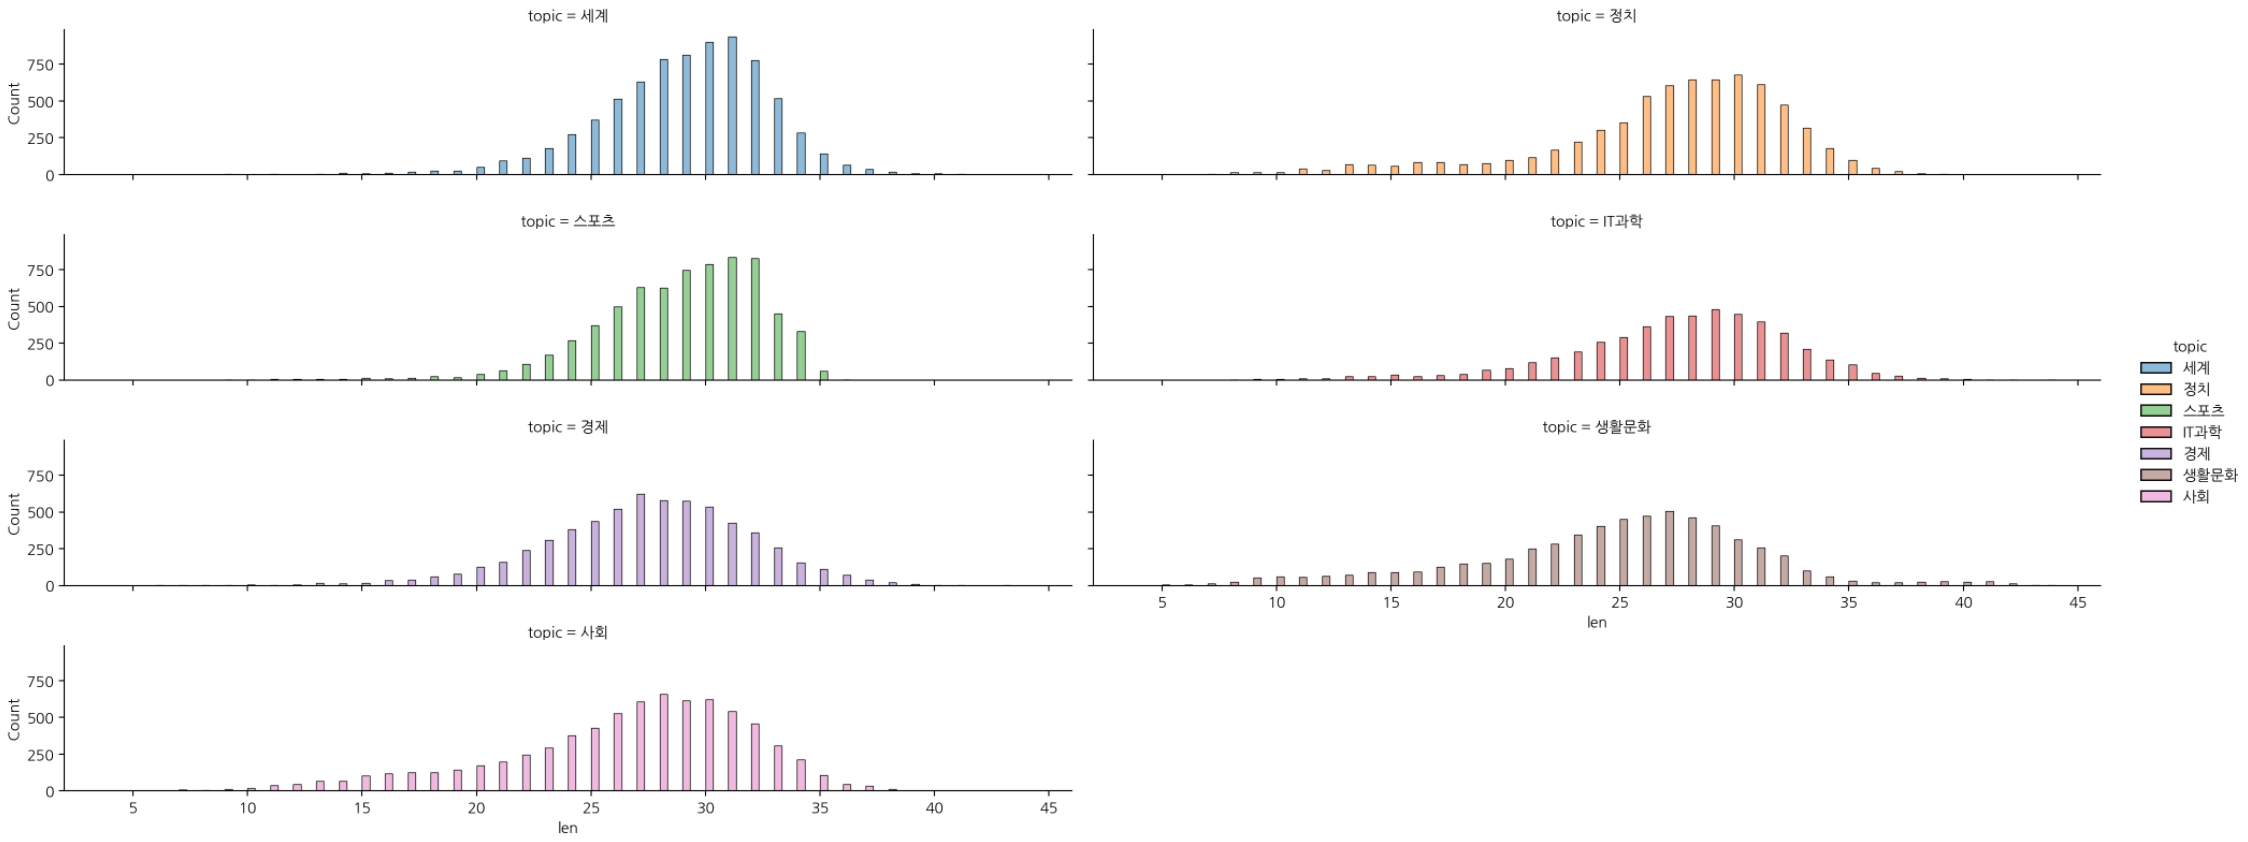
# displot 으로 topic 별 "word_count" 의 histplot 시각화
sns.displot(data=df, x='word_count', hue='topic', col='topic', col_wrap=2, aspect=5, height=2)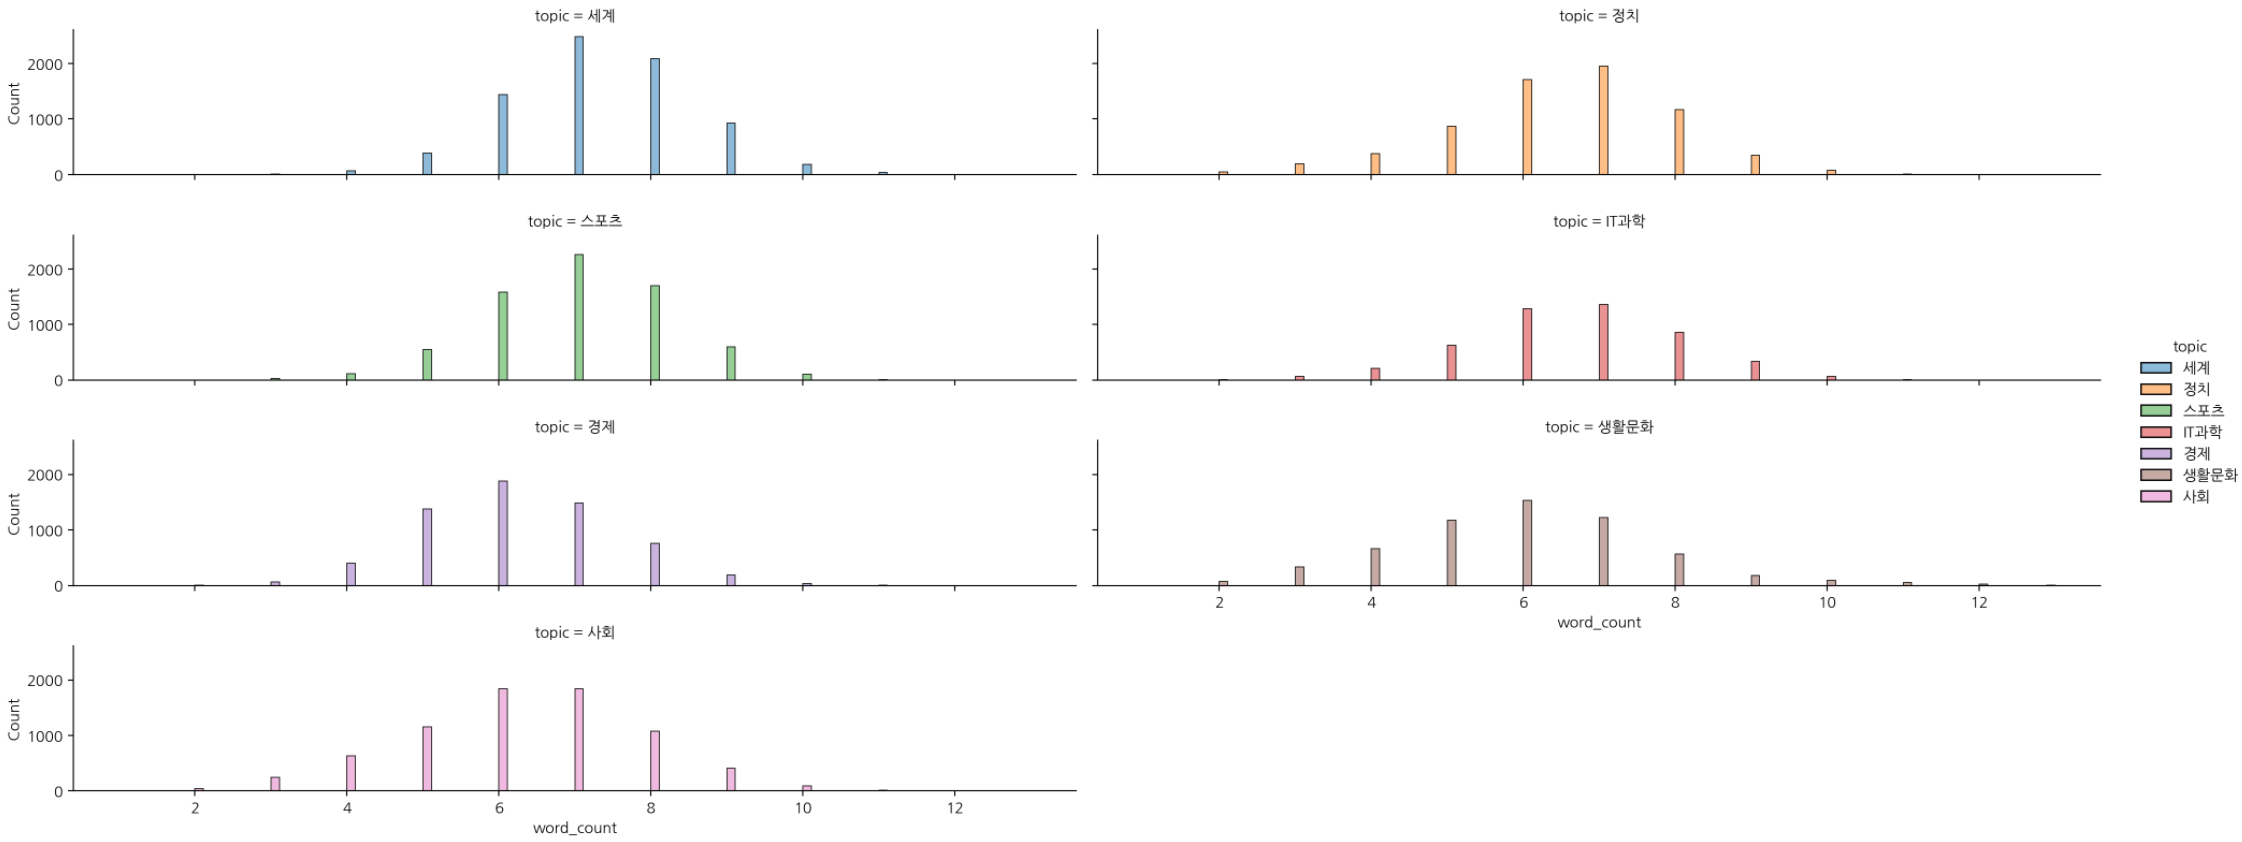
- heatmap 을 통한 시각화
sns.heatmap(df[['len', "word_count", "unique_word_count"]], cmap='BuPu')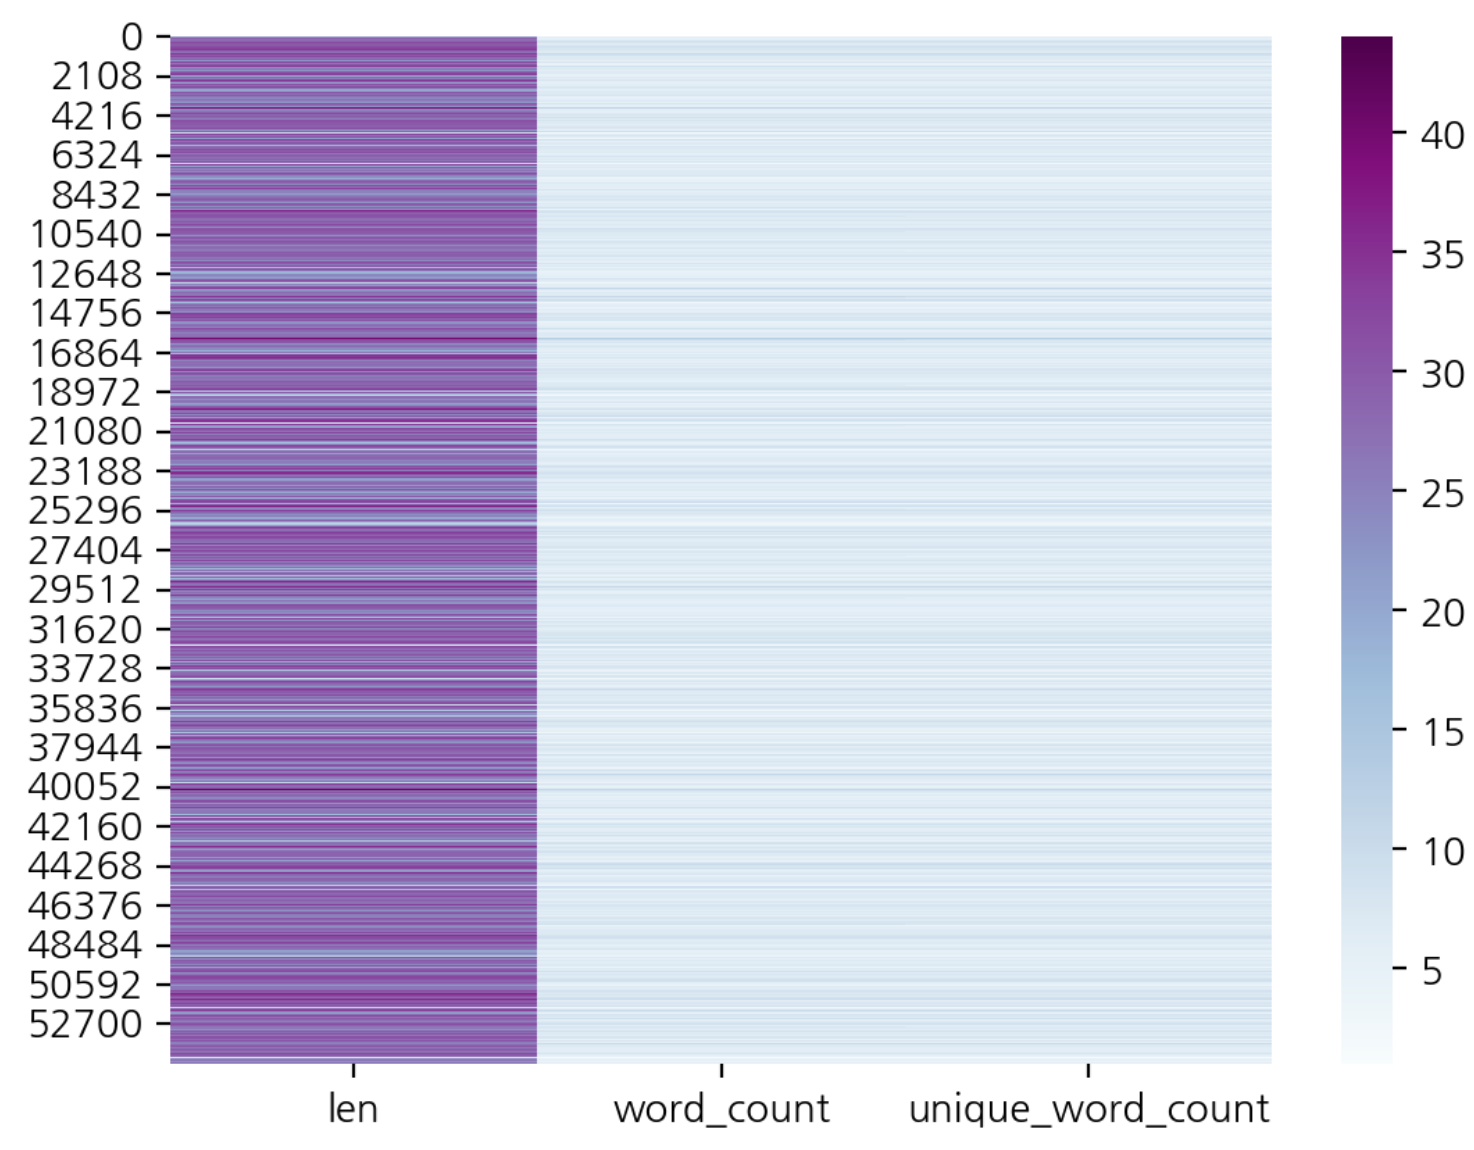
문자 전처리
숫자 제거
- 정규표현식
- map
import re

df['title'].map(lambda x: re.sub("[0-9]", "", x)
- pandas의 str.replacedf['title'].str.replace("[0-9]", "", regex=True)
특수 문자 제거
import string

punct = string.punctuation
punct
>>>>
'!"#$%&\'()*+,-./:;<=>?@[\\]^_`{|}~'

# 역슬래시를 통해 예외처리
# [!\"\$\*] 일부 특수문자 제거
df['title'].str.replace("[!\"\$\*]", "", regex=True)
알파벳 소문자 변경
df['title'].str.lower()한글, 영문과 공백만 남기고 모두 제거
- 한글 : [ㄱ-ㅎㅏ-ㅣ가-힣]
- 영어 : [a-zA-Z]
df['title'].map(lambda x : re.sub("[^ㄱ-ㅎㅏ-ㅣ가-힣 a-zA-Z]", "", x)공백 여러 개는 하나로
- [\s]+ : 공백 여러개 의미
re.sub("[\s]+", "", "공백          전처리")
>>>>
'공백 전처리'

# 여러 개의 공백을 하나의 공백으로 전처리
df['title'].str.replace("[\s]+", " ", regex=True)
불용어
df remove_stopwords(text):
	token = text.split(' ')
    stops = ['합니다', '하는', '할', '하고', '한다',
    		'그리고', '입니다', '그', '등', '이런', '및', '제', '더']
    meaningful_words = [w for w in tokens if not w in stops]
return ''.join(meaningful_words)- map 사용하여 불용어 제거
df['title'].map(lambda x : remove_stopwords(x))
df['title'].sample(10)
워드클라우드
- 불용어, 자주 등장하는 단어, 주제별 단어 등 시각화 하기 좋음
!pip install wordcloud

from wordcloud import WordCloud

def display_word_cloud(data, width=1200, height=500):
    word_draw = WordCloud(
        font_path=r"/Library/Fonts/NanumBarunGothic.ttf",
        width=width, height=height,
        stopwords=["합니다", "입니다"],
        background_color="white",
        random_state=42
    )
    word_draw.generate(data)

    plt.figure(figsize=(15, 7))
    plt.imshow(word_draw)
    plt.axis("off")
    plt.show()

# join() 이용하여 변수 title 리스트에서 문자열로 변환
display_word_cloud(" ".join(df['title']))
특정 토픽만 워드클라우드 시각화
topic['topic'].unique()
>>>>
array(['IT과학', '경제', '사회', '생활문화', '세계', '스포츠', '정치'], dtype=object)

for t in topic['topic'].unique():
	print(t)
display_word_cloud("".join(df.loc[df['topic'] == t, 'title]))- IT과학

- 경제


Ⓓ🅰️🅣🄰 ♡♥︎