Prometheus + node exporter + alertmanage + slack
Prometheus
서버나 프로그램을 모니터링 하기 위해 사용한다.
특징은 pull방식이라는것. Prometheus 서버가 노드나 프로그램등에 데이터를 요청하면 노드나 프로그램등은 데이터를 보내주면 된다. 노드나 프로그램등에서 전혀 리모트 서버에 대해 알 필요가없고 데이터의 전달에 대해서 고민하지 않아도 된다.
push : 각각 모니터되는 서버에서 주기적으로 모니터링 서버로 데이터를 보내는 방식
pull : 각각 모니터되는 서버에서 데몬만 돌고있고 모니터링 서버에서 request를 던져서 pull하는 방식
Prometheus의 아키텍쳐는 아래와 같이 구성되어 있다.
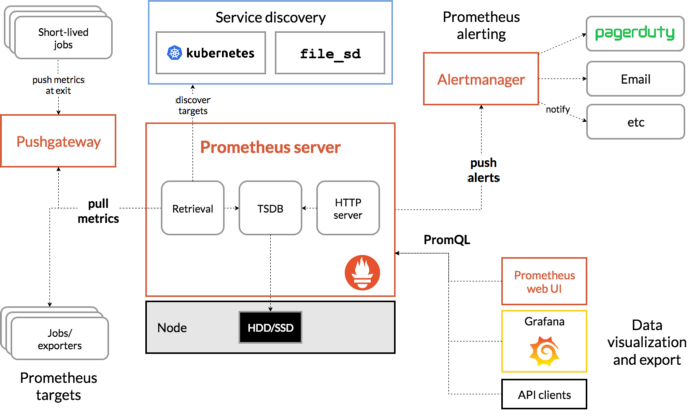
Jobs/exporters는 실제로 매트릭을 수집하는 프로세스라고 보면 된다.
이 exporter가 매트릭을 수집하고 HTTP 통신을 통해 매트릭 데이터를 가져갈 수 있게 /metrics 라는 HTTP 엔드포인트를 제공한다.
그러면 Prometheus server가 이 exporter의 엔드포인트로 HTTP GET 요청을 날려 매트릭 정보를 수집(Pull)한다.
수집한 정보를 Prometheus가 제공하는 간단한 웹 뷰를 통해 조회할 수 있고 그 안에서 테이블 및 그래프 형태로 볼 수 있다.
하지만 시각화 도구가 부족해서 이를 직접 사용하지는 않고 대게 Grafana라는 Data Visualization tool을 이용하여 시각화하고 있다.
Prometheus 설치 방법
간단하게 Docker를 사용하여 Prometheus를 구성하는 방법을 알아보자.
먼저 Prometheus는 prometheus.yml 이라는 파일을 사용하여 기본적인 설정을 한다.
기본적인 prometheus.yml의 내용을 살펴보자.
# 기본적인 전역 설정
global:
  scrape_interval:     15s # 15초마다 매트릭을 수집한다. 기본은 1분이다.
  evaluation_interval: 15s # 15초마다 매트릭을 수집한다. 기본은 1분이다.
  # 'scrpae_timeout' 이라는 설정은 기본적으로 10초로 세팅되어 있다.
# Alertmanager 설정
alerting:
  alertmanagers:
  - static_configs:
    - targets:
      # - alertmanager:9093
# 규칙을 처음 한번 로딩하고 'evaluation_interval'설정에 따라 정기적으로 규칙을 평가한다.
rule_files:
  # - "first_rules.yml"
  # - "second_rules.yml"
# 매트릭을 수집할 엔드포인트를 설정. 여기서는 Prometheus 서버 자신을 가리키는 설정을 했다.
scrape_configs:
  # 이 설정에서 수집한 타임시리즈에 'job=<job_name>'으로 잡의 이름을 설정한다.
  - job_name: 'prometheus'
    # 'metrics_path'라는 설정의 기본 값은 '/metrics'이고
    # 'scheme'라는 설정의 기본 값은 'http'이다.
    static_configs:
    - targets: ['localhost:9090']
prometheus.yml 파일을 생성한 후
Prometheus가 15초 마다 매트릭을 수집하는데,
http://localhost:9090/metrics 에서 제공하는 매트릭 정보를 수집하도록 설정했다.
그리고 이 수집에 대한 Job 이름은 prometheus로 지정하였다.
그 다음 아래 명령어를 통해 Prometheus를 docker로 배포한다.
sudo docker run \
        --rm -d \
        -p 9090:9090 \
        -v /path/to/prometheus.yml:/etc/prometheus/prometheus.yml \
        prom/prometheus
즉, 우리가 작성한 prometheus.yml 이 실제 컨테이너 내부의 /etc/prometheus/prometheus.yml으로 세팅되어 우리가 지정한 설정 값으로 Prometheus 컨테이너가 실행된다는 뜻이다.
그리고 Prometheus 컨테이너가 종료 되더라도 수집하던 매트릭 데이터는 보존하기 위해 prometheus-volume이라는 볼륨을 생성하고 그 볼륨에 Prometheus 컨테이너의 /prometheus 디렉터리와 마운트 시켰다.
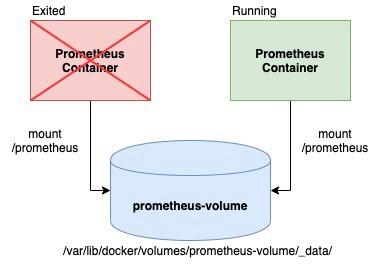
이런 방식을 사이드카 패턴이라고 한다.
그럼 브라우저를 통해 Prometheus 대시보드로 접속해보자.
브라우저를 열어 http://<Prometheus를 띄운 서버의 public ip>:9090 으로 접속하자.

node exporter 설치 및 연동
서버 노드의 자원(CPU, 메모리, 디스크 등)에 대한 매트릭을 수집해주는 exporter
Node exporter 는 바이너리로 설치
wget https://github.com/prometheus/node_exporter/releases/download/v0.18.1/node_exporter-0.18.1.linux-amd64.tar.gz

tar -xvzf node_exporter-0.18.1.linux-amd64.tar.gz

cd node_exporter-0.18.1.linux-amd64/

mv node_exporter /usr/local/bin/
이후 node exporter 를 시스템에 등록해준다.
vi /etc/systemd/system/node_exporter.service[Unit]
Description=Node Exporter
After=network.target
[Service]
User=root
Group=root
Type=simple
ExecStart=/usr/local/bin/node_exporter
[Install]
WantedBy=multi-user.targetsystemctl daemon-reload
systemctl start node_exporter
systemctl enable node_exportercurl 요청을 통해 node exporter가 제대로 실행됐는지 확인
curl localhost:9100/metrics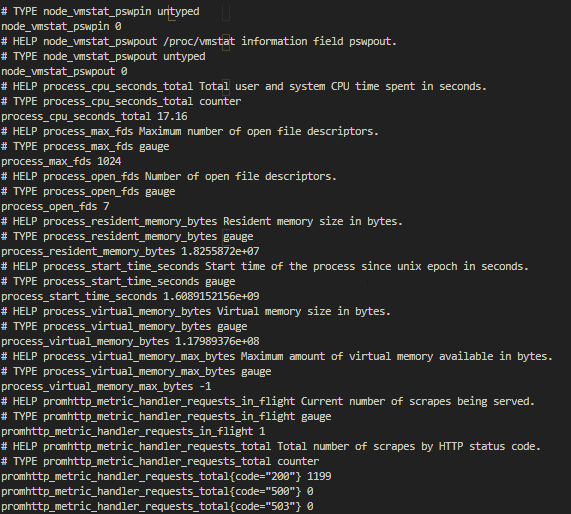
이제 프로메테우스가 주기적으로 node exporter의 결과값을 받아오면 된다.
prometheus.yml 설정파일을 수정하면
global:
  scrape_interval:     15s
  evaluation_interval: 15s
scrape_configs:
  - job_name: 'prometheus'
    static_configs:
    - targets: ['localhost:9090']
  - job_name: 'node exporter'
  	static_configs:
    - targets: ['<ip-address>:9100'] # 방화벽은 필수로 열어주어야한다.
그리고 도커를 다시 재실행해 주면,
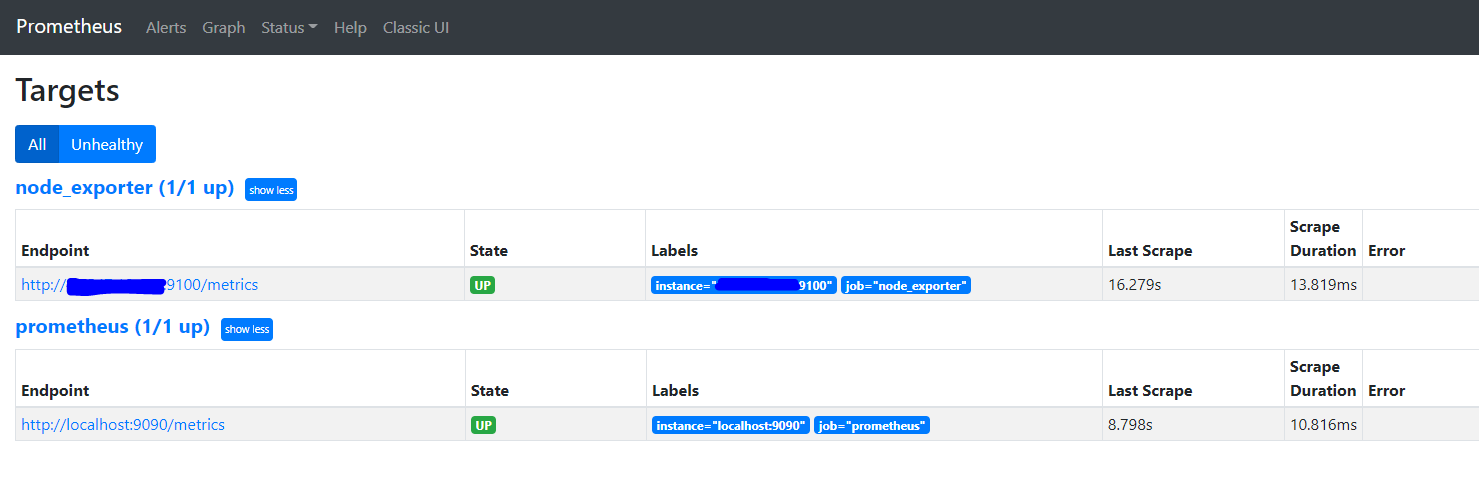
Node exporter가 타겟에 정상적으로 추가되었다.
Alert rules 추가 및 슬랙 연동
alert을 추가하기 위해서는 prometheus.yml 에 사용할 alert rule 파일명을 지정해준다.
rule_files:
  - "alert_rules.yml"
alert_rules.yml 파일에
groups:
- name: Memory
  rules:
  - alert: Memory
    expr: node_memory_Active > 10000
    for: 5s
    labels:
      severity: major
      annotations:
        summary: High Memory Usage on {{ $labels.instance }}
        identifier: "{{ $labels.instance }}"
        description: "{{ $labels.job }} Memory Usage: {{ $value }}"
여기서 for 부분에 5s 를 설정한 것은, expr 부분에 명시한 조건이 5초 이상 발생한 경우에 알람을 발생시키겠다는 의미입니다.
일반적으로는 좀 더 길게 설정하지만, 역시 alert 발생을 쉽게 확인하기 위해 테스트 목적으로 짧게 지정하였습니다.
실제 alert message에서는 $labels.instance 는 alert이 발생한 노드명으로 치환되고, $value 는 실제 해당 metric의 값으로 치환됩니다.
이 경우에는 memory 사용량이 들어가게 됩니다.
여기까지 하면 alert이 발생하고, prometheus dashboard 에서 조회할 수 있게 됩니다.
이제 발생된 alert을 적절한 destination으로 notify 해줘야 하는데 그 부분은 alertmanager가 담당하게 됩니다.
Alert Manager
AlertManager는 Prometheus 로부터 alert를 전달받아 이를 적절한 포맷으로 가공하여 notify해주는 역할을 합니다.
wget https://github.com/prometheus/alertmanager/releases/download/v0.15.1/alertmanager-0.15.1.linux-amd64.tar.gz
tar xvf alertmanager-0.15.1.linux-amd64.tar.gz
mv alertmanager-0.15.1.linux-amd64 alertmanager
cd alertmanager
이제 아래와 같이 alertmanager가 사용할 기본 config 파일을 작성합니다.
global:
resolve_timeout: 5m
slack_api_url: "https://hooks.slack.com/services/..." # slack 웹후크 URL
route:
group_by: ['alertname']
group_wait: 30s
repeat_interval: 1h
receiver: 'slack-alert'
routes: []
receivers:
- name: 'slack-alert'
slack_configs:
- channel: "#bottest"
username: "Prometheus"
send_resolved: true
title: ''
text: ''
templates:
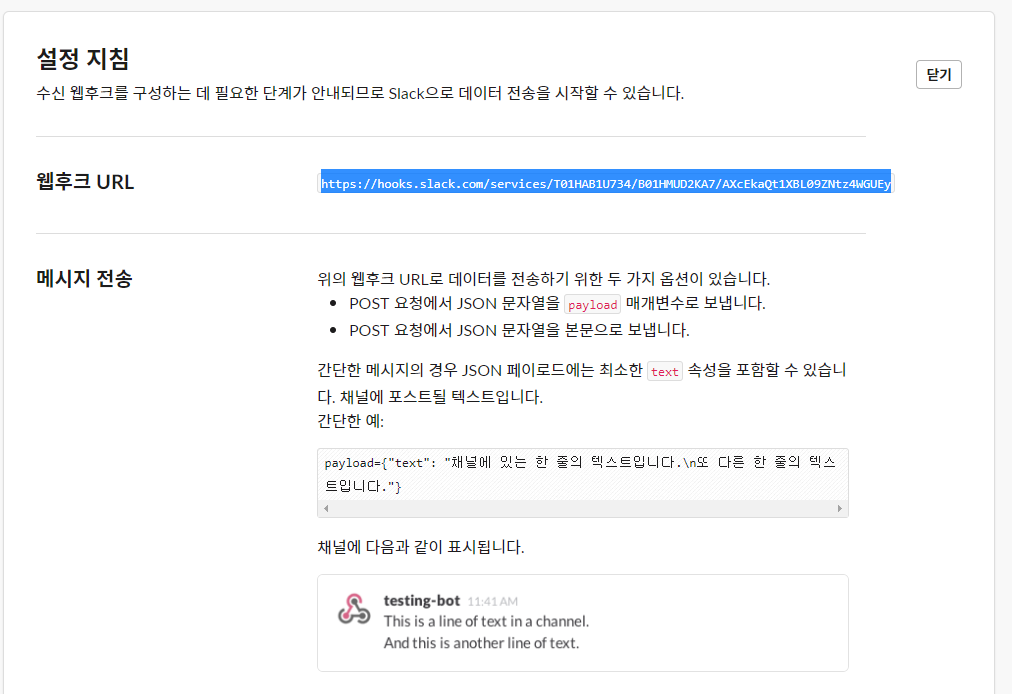
- '/path/to/slack.tmpl'슬랙과 연동하기 위해 슬랙 앱 중 Incoming Webhook을 추가한다.
그리고 제공되는 웹후크 URL을 위 alertmanger config 파일에 적어준다.
하단의 template은 notification message 의 포맷을 담고 있는 template file명을 지정합니다.
slack.tmpl 파일은 다음과 같이 작성하였습니다.
{{ define "__single_message_title" }}{{ range .Alerts.Firing }}{{ .Labels.alertname }} @ {{ .Annotations.identifier }}{{ end }}{{ range .Alerts.Resolved }}{{ .Labels.alertname }} @ {{ .Annotations.identifier }}{{ end }}{{ end }}
{{ define "custom_title" }}[{{ .Status | toUpper }}{{ if eq .Status "firing" }}:{{ .Alerts.Firing | len }}{{ end }}] {{ if or (and (eq (len .Alerts.Firing) 1) (eq (len .Alerts.Resolved) 0)) (and (eq (len .Alerts.Firing) 0) (eq (len .Alerts.Resolved) 1)) }}{{ template "__single_message_title" . }}{{ end }}{{ end }}
{{ define "custom_slack_message" }}
{{ if or (and (eq (len .Alerts.Firing) 1) (eq (len .Alerts.Resolved) 0)) (and (eq (len .Alerts.Firing) 0) (eq (len .Alerts.Resolved) 1)) }}
{{ range .Alerts.Firing }}{{ .Annotations.description }}{{ end }}{{ range .Alerts.Resolved }}{{ .Annotations.description }}{{ end }}
{{ else }}
{{ if gt (len .Alerts.Firing) 0 }}
*Alerts Firing:*
{{ range .Alerts.Firing }}- {{ .Annotations.identifier }}: {{ .Annotations.description }}
{{ end }}{{ end }}
{{ if gt (len .Alerts.Resolved) 0 }}
*Alerts Resolved:*
{{ range .Alerts.Resolved }}- {{ .Annotations.identifier }}: {{ .Annotations.description }}
{{ end }}{{ end }}
{{ end }}
{{ end }}
Better Slack alerts from Prometheus
Golang template 이라 보기가 좀 쉽지는 않지만 간단히 말씀드리면,
단일 alert이 발생했을 경우는 아래와 같이 제목 라인에 alert이 발생한 노드 정보가 표시되고 다음 라인에 alert 메세지가 표시됩니다.
복수개의 alert이 발생했을 경우는 제목 라인에는 총 alert 갯수만 표시되고, 다음 라인부터는 노드명과 alert 메세지가 함께 표시됩니다.
Alertmanager 실행 및 확인
./alertmanager --config.file=alertmanager.yml &참고 블로그
Prometheus란?
Prometheus 모니터링
Prometheus를 이용한 Event Alerting in TACO
공식 문서