들어가기에 앞서...
- 본 글은 쿠버네티스 시리즈 중의 하나로, kubernetes 실습을 위한 기본 환경 세팅이 이루어져 있지 않은 분은 시리즈 1편을 확인해주시길 바란다.
- 쿠버네티스 실습 시리즈는 아래 학습 자료를 참고하고 있다.
0. 블로깅 목적
- DaemonSet의 정의 및 기능에 대해 이해한다.
- DaemonSet 실습을 통해 활용 방법을 이해한다.
1. DaemonSet의 정의 및 기능에 대해 이해한다.
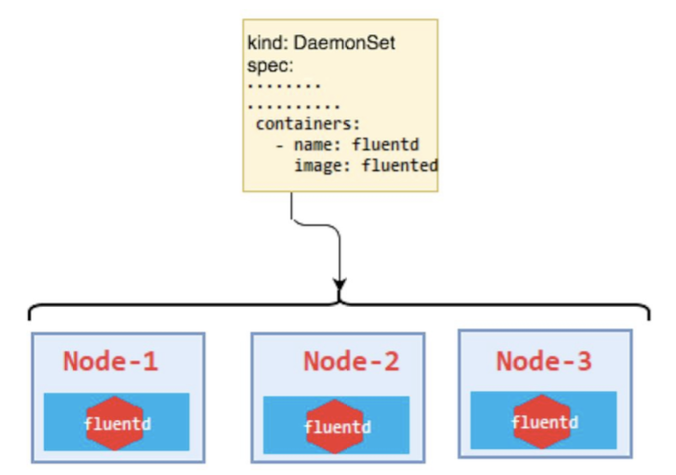
1) DaemonSet?
- 본래 Deployment를 통하면 scheduler가 노드의 상태를 알아서 체크하면서, 특정 노드의 스케쥴링을 임의로 진행한다.
- 반면 DaemonSet은 반드시 노드에 워크로드를 하나씩 꼭 띄워야할 때 사용한다. (각 노드마다 꼭 실행되어야 하는 워크로드가 있을 때!)
- 클러스터 상의 모든 노드에 동일한 Daemon형태의 Pod를 하나씩 생성한다. 그런 Daemon Pod는 로그 수집, 메트릭 수집, 네트워크 구성 등의 목적으로 많이 사용된다.
- 로그 수집: 각각의 노드에 Daemon 형태로 띄워져서 Pod들로부터 발생하는 모든 로그를 수집해서 중앙 로그 시스템으로 전달해준다.
- ex) filebeat, fluentbit 등의 워크로드
- 메트릭 수집:
- ex) node-exporter, metricbeat, telegraf 등의 워크로드
- 네트워크 구성
- ex) kube-proxy, calico 등의 워크로드
- Deployment와 마찬가지로 Label Selector 기반으로 동작되기 때문에 사용법이 어렵지 않다.
- nodeSelector, Affinity, Toleration 등을 통해 실행되어야 할 노드 목록을 필터링 가능하다.
- 즉, DaemonSet을 사용하더라도 모든 노드에 Daemon Pod를 띄우는 게 아니라, 특정 노드에만 띄우고 싶을 때 사용하는 리소스들이다.
2. DaemonSet 실습을 통해 활용 방법을 이해한다.
- yml 파일을 준비해보자.
daemonset.yml
apiVersion: apps/v1
kind: DaemonSet
metadata:
  name: filebeat
  namespace: default
  labels:
    app.kubernetes.io/name: filebeat
spec:
  selector:
    matchLabels:
      app.kubernetes.io/name: filebeat
  template:
    metadata:
      labels:
        app.kubernetes.io/name: filebeat
    spec:
      serviceAccountName: filebeat
      terminationGracePeriodSeconds: 30
      # hostNetwork: true
      # dnsPolicy: ClusterFirstWithHostNet
      containers:
      - name: filebeat
        image: docker.elastic.co/beats/filebeat:7.15.0
        args:
        # Log to `stderr` instead of `syslog` or `file`
        - "-e"
        env:
        - name: NODE_NAME
          valueFrom:
            fieldRef:
              fieldPath: spec.nodeName
        securityContext:
          runAsUser: 0
        resources: {}
          # We usually recommend not to specify default resources and to leave this as a conscious
          # choice for the user. This also increases chances charts run on environments with little
          # resources, such as Minikube. If you do want to specify resources, uncomment the following
          # lines, adjust them as necessary, and remove the curly braces after 'resources:'.
          # requests:
          #   cpu: 100m
          #   memory: 128Mi
          # limits:
          #   memory: 256Mi
        ports:
        - name: internal-http
          containerPort: 5066
        livenessProbe:
          httpGet:
            path: /
            port: internal-http
            scheme: HTTP
          initialDelaySeconds: 10
          periodSeconds: 10
          timeoutSeconds: 5
          failureThreshold: 3
        readinessProbe:
          httpGet:
            path: /
            port: internal-http
            scheme: HTTP
          initialDelaySeconds: 10
          periodSeconds: 10
          timeoutSeconds: 5
          failureThreshold: 3
        volumeMounts:
        - mountPath: /usr/share/filebeat/filebeat.yml
          readOnly: true
          name: config
          subPath: filebeat.yml
        - mountPath: /usr/share/filebeat/data
          name: data
        - mountPath: /var/lib/docker/containers
          readOnly: true
          name: varlibdockercontainers
        - mountPath: /var/log
          readOnly: true
          name: varlog
      volumes:
      - name: config
        configMap:
          name: filebeat-config
          defaultMode: 0640
      - name: varlibdockercontainers
        hostPath:
          path: /var/lib/docker/containers
      - name: varlog
        hostPath:
          path: /var/log
      # data folder stores a registry of read status for all files, so we don't send everything again on a Filebeat pod restart
      - name: data
        hostPath:
          # When filebeat runs as non-root user, this directory needs to be writable by group (g+w).
          path: /var/lib/filebeat-data
          type: DirectoryOrCreate
- labels는 app.kubernetes.io/name: filebeat을 사용한다. 그래서 마치 Deployment처럼 selector로 매칭을 하게 된다.
- template아래는 Pod 명세이며, image로는docker.elastic.co/beats/filebeat:7.15.0을 사용한다.
- 포트는 internal-http로 5066으로 열었다.
- volumes와 volumesMounts도 각각 잘 매핑될 수 있도록 정의되어 있다.
configmap.yml
apiVersion: v1
kind: ConfigMap
metadata:
  name: filebeat-config
  namespace: default
data:
  filebeat.yml: |
    filebeat.inputs:
    - type: container
      paths:
      - /var/log/containers/*.log
      processors:
      - add_kubernetes_metadata:
          host: ${NODE_NAME}
          matchers:
          - logs_path:
              logs_path: "/var/log/containers/"
    http:
      enabled: true
      host: 0.0.0.0
      port: 5066
    output.console:
      enabled: true
- filebeat.yml이라는 파일을 configmap의 key로하고 내용을 value로 한 걸 볼 수 있다.
- filebeat는 input과 output을 하게 된다.
- input으로는 container 로그 파일을 수집을 해놨고, 이 로그 파일들은 hostPath를 통해서 이전 yml 파일을 마운트를 해뒀기 때문에 전체 컨테이너 로그들에 접근할 수 있는 상태가 된다.
- output은 elasticsearch로 보내거나, logstash로 보내거나, kafka로 보내는 과정을 거치게 되는데 실습은 간단히 하기 위해 console로 로깅하도록 해두었다.
rbac.yml
apiVersion: v1
kind: ServiceAccount
metadata:
  name: filebeat
  namespace: default
  labels:
    app.kubernetes.io/name: filebeat
---
apiVersion: rbac.authorization.k8s.io/v1
kind: ClusterRole
metadata:
  name: filebeat
  labels:
    app.kubernetes.io/name: filebeat
rules:
# "" indicates the core API group
- apiGroups: [""]
  resources:
  - namespaces
  - nodes
  - pods
  - services
  verbs:
  - get
  - watch
  - list
- apiGroups: ["apps"]
  resources:
  - replicasets
  verbs:
  - get
  - watch
  - list
---
apiVersion: rbac.authorization.k8s.io/v1
kind: ClusterRoleBinding
metadata:
  name: filebeat
  labels:
    app.kubernetes.io/name: filebeat
subjects:
- kind: ServiceAccount
  name: filebeat
  namespace: default
roleRef:
  apiGroup: rbac.authorization.k8s.io
  kind: ClusterRole
  name: filebeat
- 이거는 filebeat에 필요한 권한들을 주는 설정이라고 할 수 있다.
실습을 진행해보자.
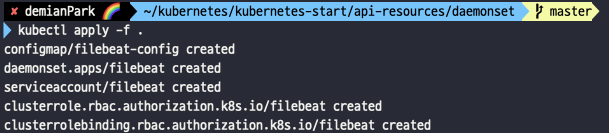
- kubectl apply -f .
- 모든 yml을 apply한다.
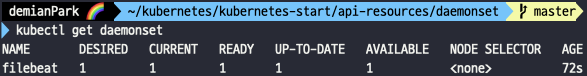
- kubectl get daemonset
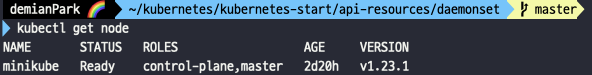
- kubectl get node
- Desired와 Current가 1인 걸 알 수 있다.
- 이는 노드의 개수가 1개이기 때문이다.
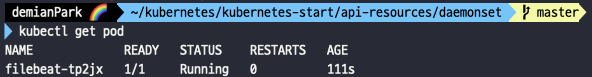
- kubectl get pod
- filebeat가 1개 띄워진 걸 볼 수 있다.
- kubectl logs pod filebeat-tp2jx
- pod 조회시 얻은 이름을 넣어 실행해보면 로그가 계속해서 찍히는 걸 볼 수 있다.
- 이는 filebeat가 각각의 노드에 존재하는 컨테이너 로그들을 수집(input)해서 콘솔로 계속 output하도록 설정했기 때문이다.

그렇게 바쿠만도는 개발에 퐁당 빠지고 말았답니다.