관련된 글
[Python] sin, cos, tan 그래프 출력하기
import
numpy
- exp
자연지수 e를 받은 값인x승의 값을 반환해주는 라이브러리 입니다.
나머지 matplotlib.pyplot, numpy는 상단의 관련된 글에서 확인해주세요.
코드
import matplotlib.pyplot as plt
import numpy as np
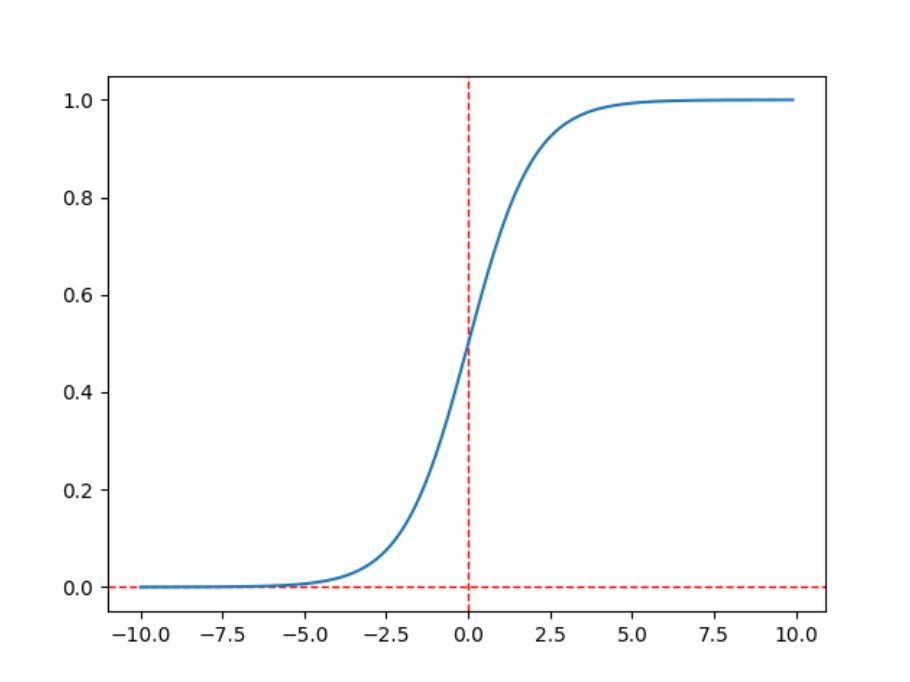
def sigmoid(x):
return 1 / (1 + np.exp(-x))
array = np.arange(-10, 10, 0.1)
plt.axvline(x=0, color='r', linestyle='--', linewidth=1)
plt.axhline(y=0, color='r', linestyle='--', linewidth=1)
plt.plot(array, sigmoid(array))
plt.show()출력

안녕하세요 페르세스 티탄입니다! 부족한 부분이 많이 있겠지만 잘부탁드립니다.