android jetpack-compose로 앱 작업을 하던 중 라인그래프가 필요해서 jaikeerthick/Composable-Graphs를 사용하게 되었다.
https://github.com/jaikeerthick/Composable-Graphs
1. Gradle Setup
- settings.gradle.kts > repositories 에 maven 추가
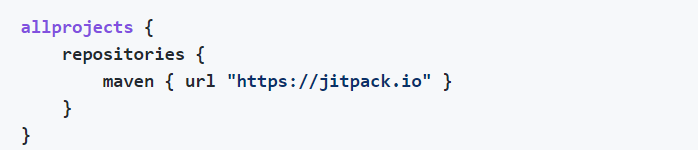
dependencyResolutionManagement {
    repositoriesMode.set(RepositoriesMode.FAIL_ON_PROJECT_REPOS)
    repositories {
        gradlePluginPortal()
        google()
        mavenCentral()

        // 그래프
        maven { url = uri("https://www.jitpack.io" ) }
    }
}
이미지와 같이 추가했더니 에러가 나서 코드 부분으로 수정
- build.gradle.kts(:app)에 implementation 추가
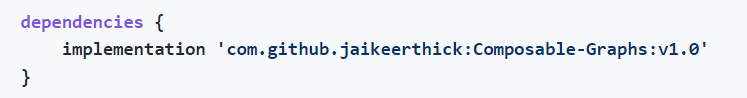
implementation("com.github.jaikeerthick:Composable-Graphs:v1.0")하면
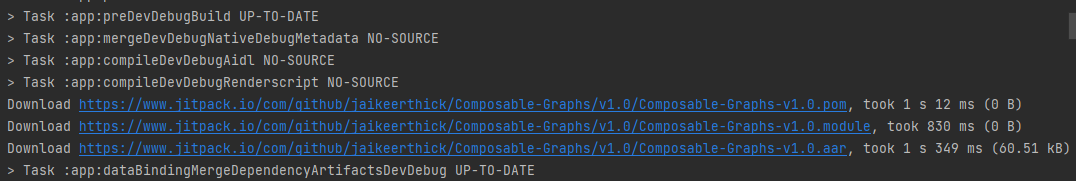
....
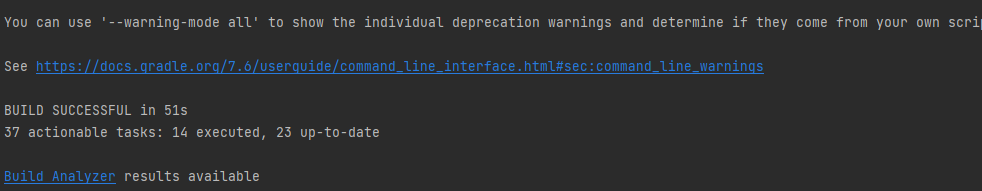
이렇게 설치 완료
2. 구현
- bar 그래프를 사용할지, line 그래프를 사용할지 결정하고, 예제를 그대로 가져오면 된다.
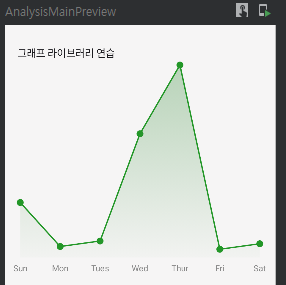
- line 그래프로 구현
Column() {
    val style = LineGraphStyle(
        visibility = LinearGraphVisibility(
            isHeaderVisible = true,
            isYAxisLabelVisible = false,
            isCrossHairVisible = true
        ),
        colors = LinearGraphColors(
            lineColor = GraphAccent2,
            pointColor = GraphAccent2,
            clickHighlightColor = PointHighlight2,
            fillGradient = Brush.verticalGradient(
                listOf(Gradient3, Gradient2)
            )
        )
    )

    LineGraph(
        xAxisData = listOf("Sun", "Mon", "Tues", "Wed", "Thur", "Fri", "Sat").map {
            GraphData.String(it)
        }, // xAxisData : List<GraphData>, and GraphData accepts both Number and String types
        yAxisData = listOf(200, 40, 60, 450, 700, 30, 50),
        style = style
    )
}
이미지와 같은 그래프가 나온다.
3. 스타일
- 코드
Column() {
    val style = LineGraphStyle(
        visibility = LinearGraphVisibility(
            isHeaderVisible = true,
            isYAxisLabelVisible = true,
            isCrossHairVisible = true,
        ),
        colors = LinearGraphColors(
            lineColor = Color(0xFFff9f3d),
            pointColor = Color.Transparent,
            clickHighlightColor = Color(0xFFcfff9f3d),
            fillGradient = Brush.verticalGradient(
                0.2f to Color(0xFFcfff8912), 0.5f to Color(0xFF5cff9f3d)
            )
        ),
        height = 182.dp
    )

    LineGraph(
        xAxisData = listOf("11일", "12일", "13일", "14일", "15일", "16일", "17일", "18일").map {
            GraphData.String(it)
        }, // xAxisData : List<GraphData>, and GraphData accepts both Number and String types
        yAxisData = listOf(60, 150, 100, 50, 30, 120, 70, 80),
        style = style
    )
}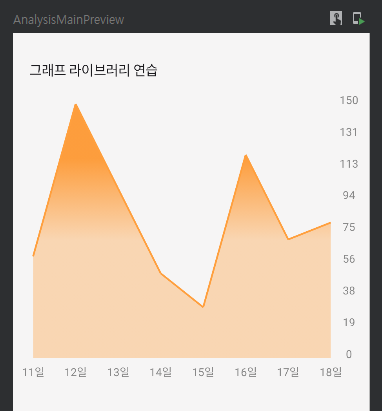
디자인과 맞추기 위해 그래프와 라인의 색상을 바꾸고 dot를 transparent로 처리하였다.
아쉬움😶
이정도만 필요하다면, 아주 쉽게 구현이 가능하다.
아직 v1.0이라 옵션이 없어 아쉽다.
y축의 label을 왼쪽으로 옮기고 싶은데, 아직(2022.02월 시점) 옵션이 없다고 한다...
또 value를 툴팁으로 띄우고 싶은데, 검색해봐도 나오지 않는다.. 툴팁 기능도 아직 없는 듯 하다.
아쉽...
y축 label과 tooltip을 따로 구현해서 띄우거나, 다른 라이브러리를 사용해야 겠다.
끝-

기억이 안되면, 기록을 -