2022 DSF 데이터 사이언스 페스티벌 경진대회에 참여한 결과물이다.

| 대회명 | 데이터 사이언스 페스티벌 |
|---|---|
| 주최 | DS플러스 차세대 융합인재양성 사업단 |
| 주관 | 호서대학교 DS플러스 사업단, Addit |
| 후원 | 한국지능정보사회진흥원(NIA) |
| 주제 | 자유주제(통합데이터지도 내 데이터활용) |
| 기간 | 2022.11 ~ 2022.12 |
| 성적 | 🏆 대상 (1st / 50 teams) 🏆 |
Introduction
분석 배경
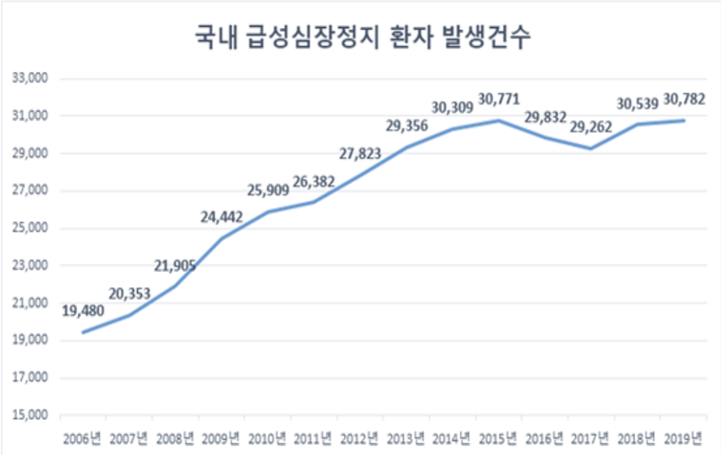
1. 심정지 환자 수의 증가
보건복지부의 급성심장정지조사 통계에 따르면 지난 2006년부터 국내 급성심장정지 환자 발생건수는 꾸준히 증가세를 보였다.
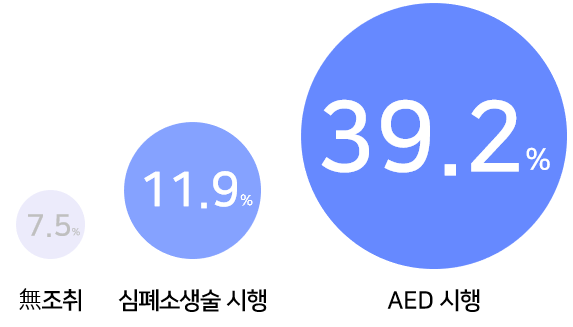
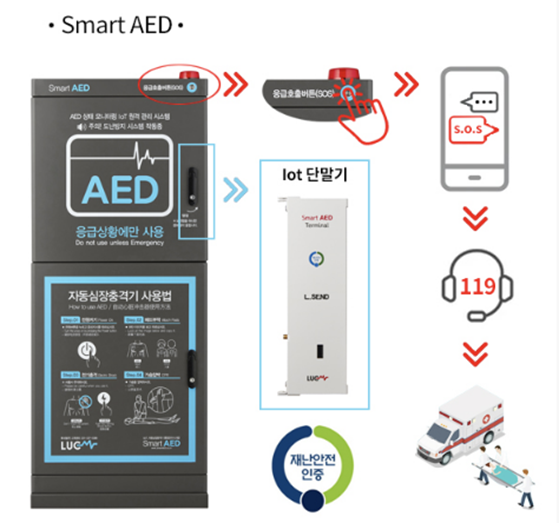
2. 심정지 처치에 가장 효과적인 자동심장충격기(AED)
심정지 발생 시 환자를 살릴 수 있는 가장 좋은 방법은 자동심장충격기, AED를 활용하는 것이다.

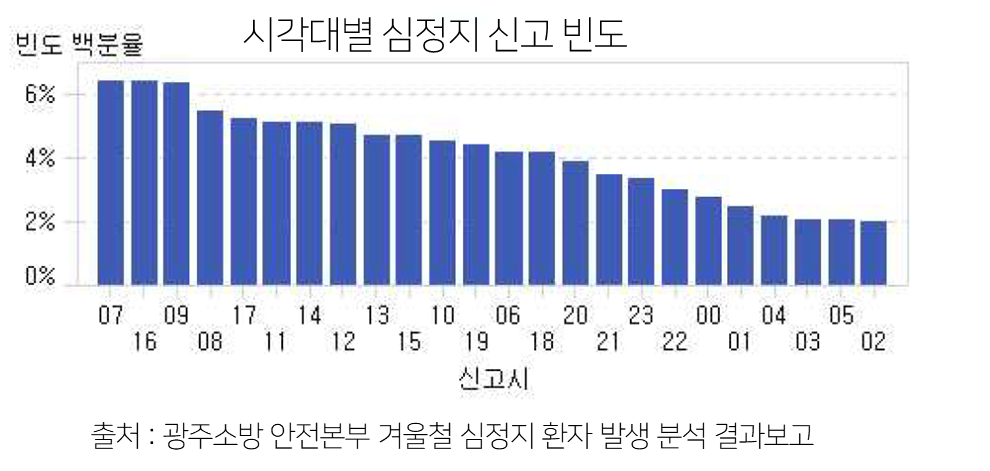
3. 24시간 발생 가능한 심정지
광주소방 안전본부의 보고에 따르면 심정지는 시간대에 무관하게 발생한다.
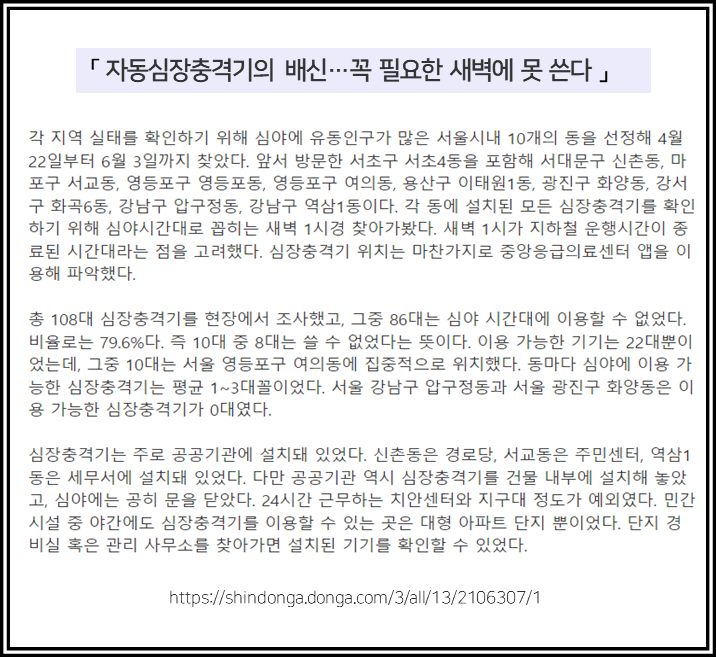
4. 24시간 사용 불가한 현재의 AED
하지만 현재 상용되는 AED들은 대부분 공공기관이나 지하철 역사와 같은 건물 내부에 위치하여 퇴근시간대 이후에는 사용할 수 없다. 외부 환경 변화에 취약한 AED의 특성 상 외부에 설치되기 힘들기 때문이다.
분석 목표
- 동대문구 AED 설치 현황을 분석하고 추가적인 AED 수요 파악
- 실내가 아닌 보행자 기준의 새로운 실외 스마트 AED의 최적위치 선정
- 시민들이 24시간 접근 가능한 AED 응급체계 구축
EDA
! pip install geopandas
! pip install pydeck
! pip install mip

# 한글 matplotlib 시각화를 위한 폰트 설치
! sudo apt-get install -y fonts-nanum
! sudo fc-cache -fv
! rm ~/.cache/matplotlib -rf

import pandas as pd
import numpy as np
import time
import os
import base64
import re
import random
import pickle
import matplotlib.pyplot as plt
plt.rc('font', family='NanumBarunGothic')
import seaborn as sns
import datetime
from datetime import datetime
import geopandas as gpd
import pydeck as pdk
from shapely import wkt
from tqdm import tqdm
from mip import *
os.chdir('/content/drive/MyDrive/ML_projects/alreadydone/DSF')

def multipolygon_to_coordinates(x):
    lon, lat = x[0].exterior.xy
    return [[x, y] for x, y in zip(lon, lat)]

def polygon_to_coordinates(x):
    lon, lat = x.exterior.xy
    return [[x, y] for x, y in zip(lon, lat)]

def image_to_data_url(filename):
    ext = filename.split('.')[-1]
    prefix = f'data:image/{ext};base64,'
    with open(filename, 'rb') as f:
        img = f.read()
    return prefix + base64.b64encode(img).decode('utf-8')

# https://www.flaticon.com/kr/authors/kanyanee-watanajitkasem
AED_ICON = './free-icon-aed-6417086.png'
icon = image_to_data_url(AED_ICON)
icon_data = {
    "url": icon,
    "width": 128,
    "height": 128,
    "anchorY": 128,
}

# 동대문구 행동별 경계면 폴리곤 데이터
with open('./seoul_boundary.pickle', 'rb') as f:
    boundary = pickle.load(f)

boundary = boundary[boundary['구'] == '동대문구']
1. 심정지 발생 현황
동대문구의 성별, 연령대별 심정지 발생 현황을 그려본 결과 50대 이상은 84%를 차지하고 남성이 여성에 비해 두 배 가량 높았다. 즉, AED 설치 지역을 선정할 때 인구통계학적 특성을 반영해야 함을 알 수 있다.
# 성별 그래프
occur = pd.read_csv("./전체_발생건수.csv", encoding='cp949')
seoul = occur[occur['시도별(1)'] == '서울']
seoul = seoul.drop([seoul.index[3], seoul.index[-1]])
sper = seoul.T[2::2]

ratio = list(sper.iloc[-1, 1:3].astype(float))
labels = list(sper.iloc[0, 1:3])
plt.figure(figsize=(8,8))

patches, texts, autotexts = plt.pie(ratio, labels=labels,
                                    autopct='%1.1f%%',
                                    shadow=True,
                                    startangle=200,
                                    pctdistance = 0.65,
                                    labeldistance = 0.85,
                                    colors = ['#E08757', '#427AE0'],
                                    wedgeprops = {'width':0.5,'edgecolor':'w','linewidth':3},
                                    textprops = {'size' : 15}
                                    )
# Customize text labels
for text in texts:
    text.set_horizontalalignment('center')

# Customize percent labels
for autotext in autotexts:
    autotext.set_horizontalalignment('center')
    autotext.set_fontstyle('italic')

plt.show()

# 연령대 그래프
ratio = list(sper.iloc[-1, 3:].astype(float))
labels = list(sper.iloc[0, 3:])

plt.figure(figsize=(8,8))
patches, texts, autotexts = plt.pie(ratio, labels=labels,
                                    autopct='%1.1f%%',
                                    shadow=True,
                                    startangle=200,
                                    pctdistance = 0.6,
                                    labeldistance = 0.8,
                                    colors = ['#ff9999', '#ffc000', '#8fd9b6', '#d395d0', '#5E9DFD'],
                                    wedgeprops = {'width':0.5,'edgecolor':'w','linewidth':3},
                                    textprops = {'size' : 15}
                                    )
# Customize text labels
for text in texts:
    text.set_horizontalalignment('center')

# Customize percent labels
for autotext in autotexts:
    autotext.set_horizontalalignment('center')
    autotext.set_fontstyle('italic')

plt.axis('equal')
plt.show()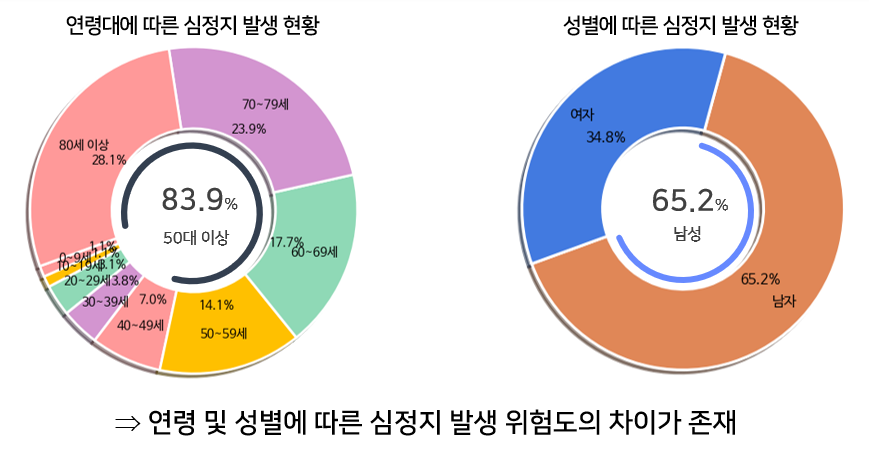
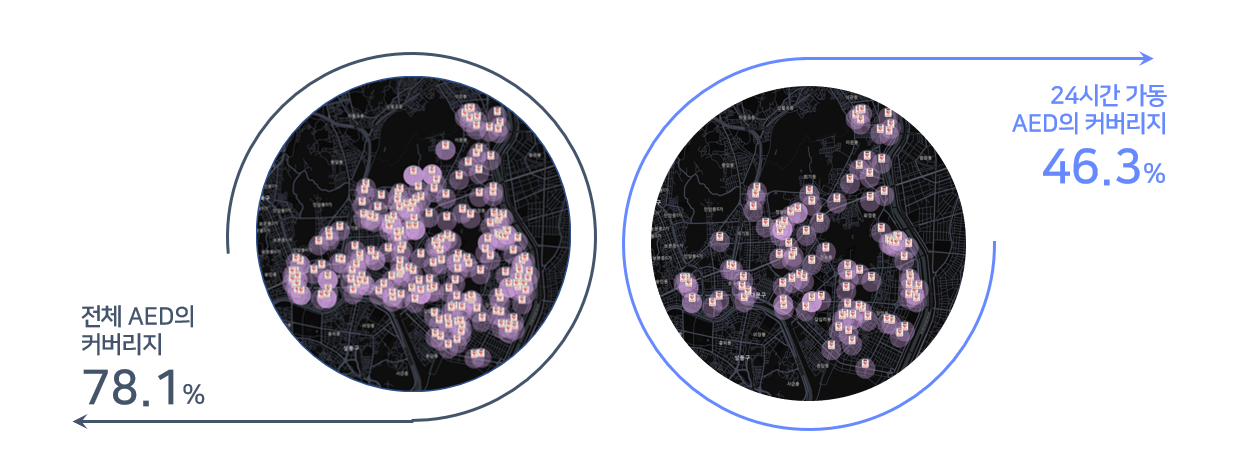
2. 동대문구 AED 현황
자동심장 충격기 정보조회 데이터에서 동대문구만 필터링한 후 기존 존재하던 전체 AED와 24시간 가동 AED를 비교했다. 퇴근시간대 이후엔 사용하지 못하는 공공기관, 학교, 지하철과 같은 곳의 AED를 제외하니 전체 246개 중 99개 만이 24시간 사용 가능했다. 전체 커버리지는 78.1%에서 46.3%로 많이 줄어들었다.
따라서 추가적인 24시간 실외 AED가 필요함을 알 수 있다. 시각화는 pydeck을 활용하여 위경도 데이터를 기준으로 그렸다. 분홍색 원은 AED가 커버가능한 반경 200m 지역을 의미한다.
aed = pd.read_csv("./자동심장 충격기 정보 조회(AED)(표준 데이터).csv", encoding='cp949')
aed['행정동'] = aed['설치기관주소'].apply(lambda x: x.split()[1])
aed = aed[aed['행정동']=='동대문구'].reset_index(drop=True)

# 기존 AED 시각화용 데이터
aed_200 = gpd.GeoDataFrame(aed, geometry=gpd.points_from_xy(aed['경도'], aed['위도']), crs = 'epsg:4326')
aed_200 = aed_200.set_geometry('geometry')
aed_200['buffer_200'] = aed_200.to_crs('epsg:5179').buffer(200).to_crs('epsg:4326')
aed_200 = aed_200.set_geometry('buffer_200')
aed_200['buffer_200_coordinates'] = aed_200['buffer_200'].apply(polygon_to_coordinates)

aed_200 = aed_200[['설치기관주소', '설치위치', '경도', '위도', 'geometry', 'buffer_200', 'buffer_200_coordinates']]
aed_200 = aed_200.rename(columns = {"경도" : "lon", "위도" : 'lat'})

# icon layer
aed_200['icon_data'] = None
for i in aed_200.index:
    aed_200["icon_data"][i] = icon_data

import pydeck as pdk
layer1 = pdk.Layer(
    'PolygonLayer',
    aed_200,
    get_polygon='buffer_200_coordinates',
    get_fill_color= '[216, 157, 227, 89]',
    get_fill_line=[255, 255, 255, 100],
    pickable=True,
    auto_highlight=True)

layer2 = pdk.Layer(
    "IconLayer",
    aed_200,
    get_icon="icon_data",
    get_size=8,
    size_scale=3,
    get_position='[lon, lat]',
    pickable=True,
    auto_highlight=True
)

center = [127.0400, 37.5744]
view_state = pdk.ViewState(
    longitude=center[0],
    latitude=center[1],
    zoom=13)

r = pdk.Deck(layers=[layer1, layer2], initial_view_state=view_state)
r.to_html('./wow.html')
24시간 가동 AED 데이터를 따로 만들어 사용했는데 이는 200m buffer를 계산하는 과정에서 좌표계를 epsg:5179로 변경 후 m 단위로 연산하고 다시 epsg:4326으로 변경해줘야기 때문이다.
그 과정에서 set_geometry() 함수 때문에 모든 처리를 하나의 df로 처리하면 좌표계 오류가 계속 뜨기에 어쩔 수 없이 분리하여 사용하였다.
수요량 부분은 알고리즘에서 사용하기 위한 처리이다.
# 수요량 b,c 계산용 100m buffer 생성
aed_24_100 = gpd.GeoDataFrame(aed, geometry=gpd.points_from_xy(aed['경도'], aed['위도']), crs = 'epsg:4326')
aed_24_100 = aed_24_100.set_geometry('geometry')
aed_24_100['buffer_100'] = aed_24_100.to_crs('epsg:5179').buffer(100).to_crs('epsg:4326')
aed_24_100 = aed_24_100.set_geometry('buffer_100')
aed_24_100['buffer_100_coordinates'] = aed_24_100['buffer_100'].apply(polygon_to_coordinates)

aed_24_100 = aed_24_100[['설치기관주소', '설치위치', '경도', '위도', 'geometry', 'buffer_100', 'buffer_100_coordinates']]
aed_24_100 = aed_24_100.rename(columns = {"경도" : "lon", "위도" : 'lat'})

# 기존 24시간 AED 시각화용 200m buffer 생성
aed_24_200 = gpd.GeoDataFrame(aed, geometry=gpd.points_from_xy(aed['경도'], aed['위도']), crs = 'epsg:4326')
aed_24_200 = aed_24_200.set_geometry('geometry')
aed_24_200['buffer_200'] = aed_24_200.to_crs('epsg:5179').buffer(200).to_crs('epsg:4326')
aed_24_200 = aed_24_200.set_geometry('buffer_200')
aed_24_200['buffer_200_coordinates'] = aed_24_200['buffer_200'].apply(polygon_to_coordinates)

aed_24_200 = aed_24_200[['설치기관주소', '설치위치', '경도', '위도', 'geometry', 'buffer_200', 'buffer_200_coordinates']]
aed_24_200 = aed_24_200.rename(columns = {"경도" : "lon", "위도" : 'lat'})2부에서 계속된다!
