
📌 코칭스터디 Data Science 13기 - 4주차
1. 강의 내용
- K-beauty는 성장하고 있을까?(가설세우기, 데이터 로드, 전처리)
- 데이터 시각화로 가설 검정하기
2. 강의 정리
1) 가설세우기
- K-Beauty는 성장하고 있는가?
- 성장하고 있다면 해외 판매를 하고자 할때 어느 국가로 판매전략을 세우면 되는가?
2) 데이터 준비
- 데이터셋 로드
df = pd.read_csv('./data/101_DT_1KE10081_20231106160107.csv', encoding='cp949')- 데이터 전처리
- 컬럼명 "지역별"을 "국가(대륙)별"로 변경하기
df.rename(columns={'지역별':'국가(대륙)별'}, inplace=True)- 필요없는 컬럼 삭제하기('항목', '단위', 'Unnamed: 29')
df = df.drop(['항목', '단위', 'Unnamed: 29'], axis=1)- melt 함수를 활용해서 tidy data로 구성하기
df_new = df.melt(id_vars=['국가(대륙)별', '상품군별', '판매유형별'], var_name='기간', value_name='백만원')- 컬럼명 "기간"에서 "연도"로 분리하기
df_new['연도'] = df_new['기간'].map(lambda x: int(x.split('.')[0]))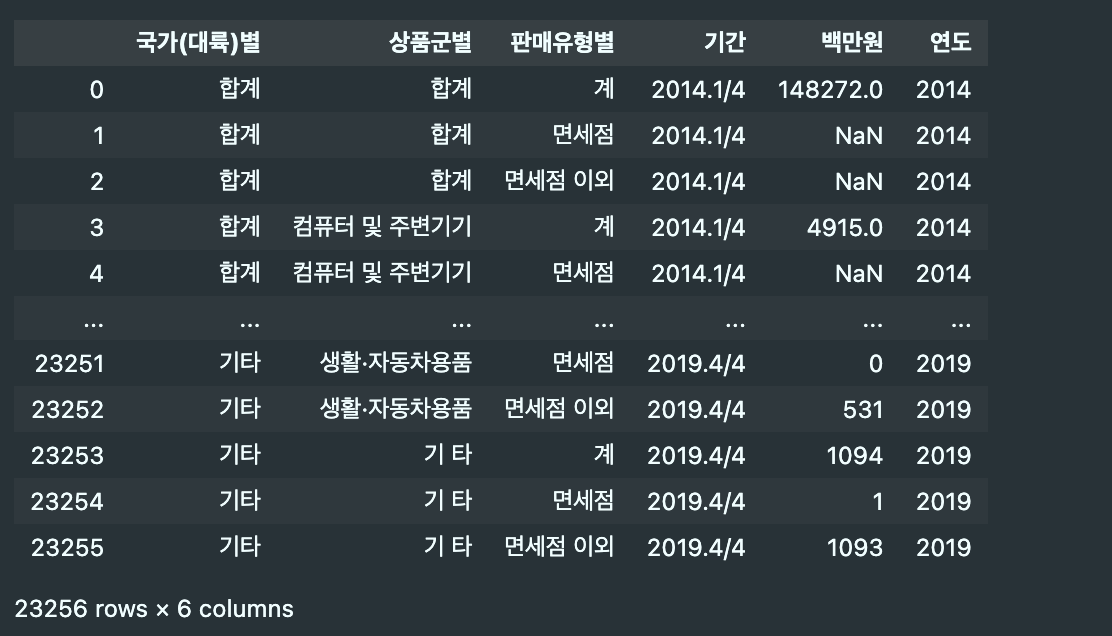
- 컬럼명 "기간"에서 "분기"로 분리하기
df_new['분기'] = df_new['기간'].map(lambda x: int(str(x.split('.')[1]).split('/')[0]))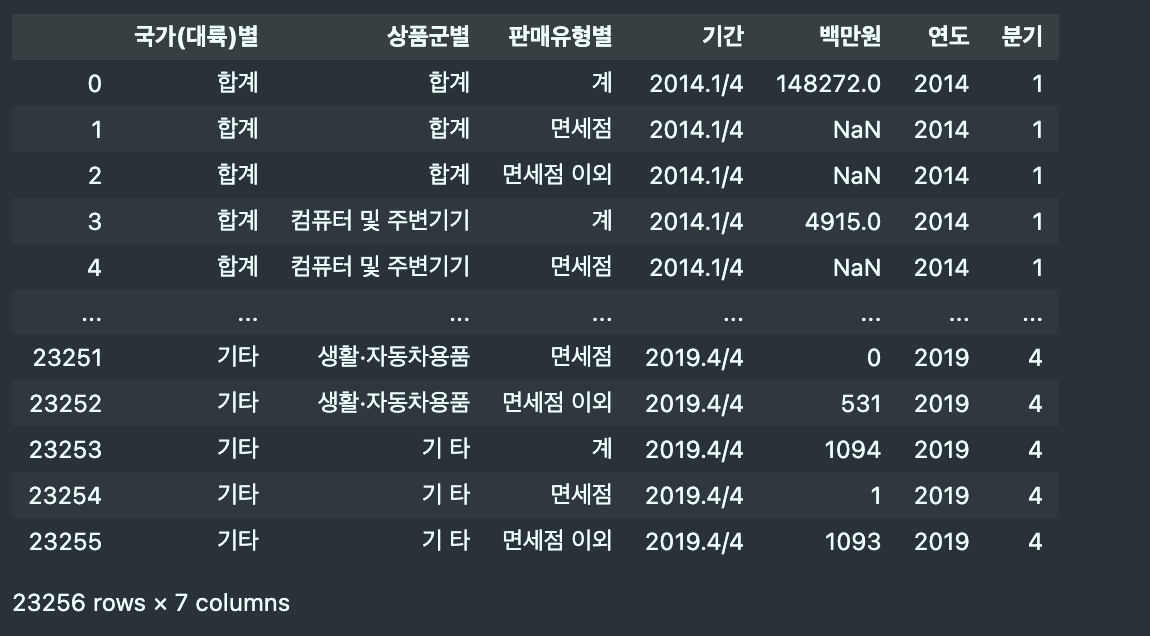
- 금액을 수치 데이터로 표현하기 위해 데이터 타입 변경
df_new['백만원'] = df_new['백만원'].replace('-', pd.np.nan).astype(dtype='float64')
df_new.replace({np.nan:0}, inplace=True)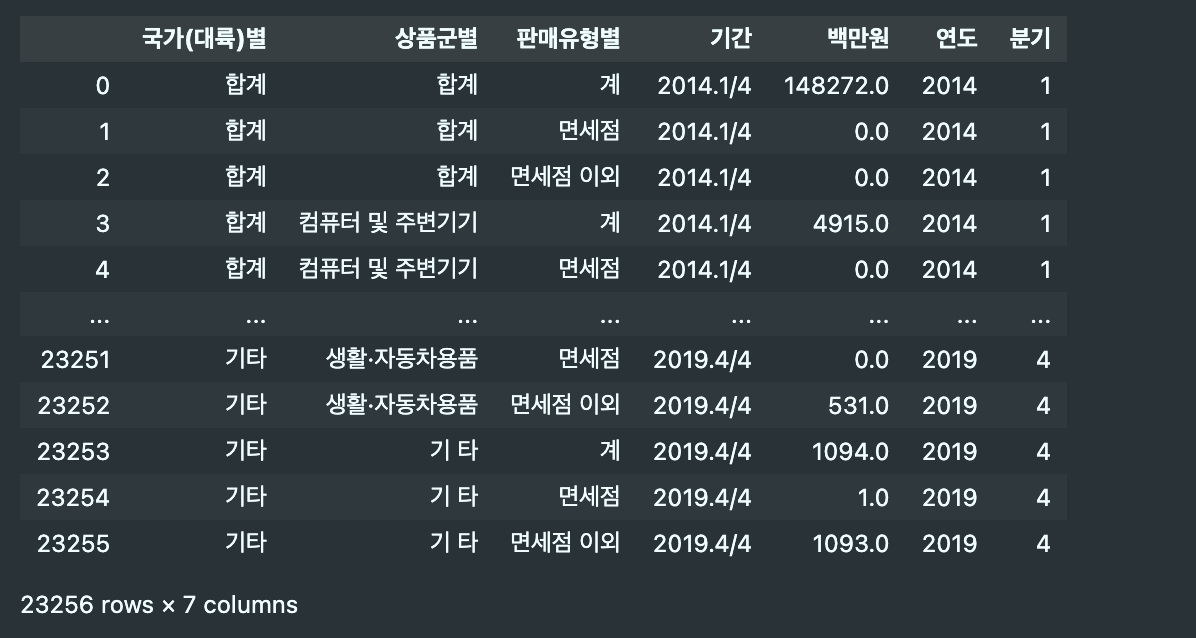
- 필요없는 데이터 제거하기
df_new = df_new[(df_new['국가(대륙)별'] != '합계') & (df_new['상품군별'] != '합계')].copy()
df_new.isnull().sum()
3) 데이터 시각화
-
전체 상품군별 시각화
- 전체 상품군 lineplot: 연도가 지날수록 증가하고 있음
sns.lineplot(data=df_total, x='연도', y='백만원')
plt.show()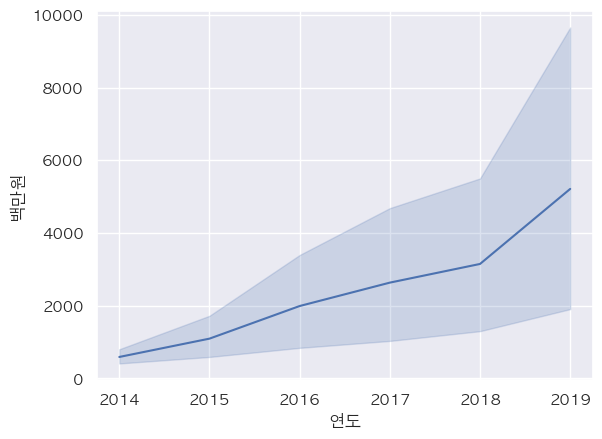
- 상품군별 lineplot: 전체적으로 증가하고 있고, 특히 "화장품"이 눈에 띄게 증가하고 있음
sns.lineplot(data=df_total, x='연도', y='백만원', hue='상품군별')
plt.legend(title="상품군별", bbox_to_anchor=(1.05, 1), loc=2, borderaxespad=0.)
plt.show()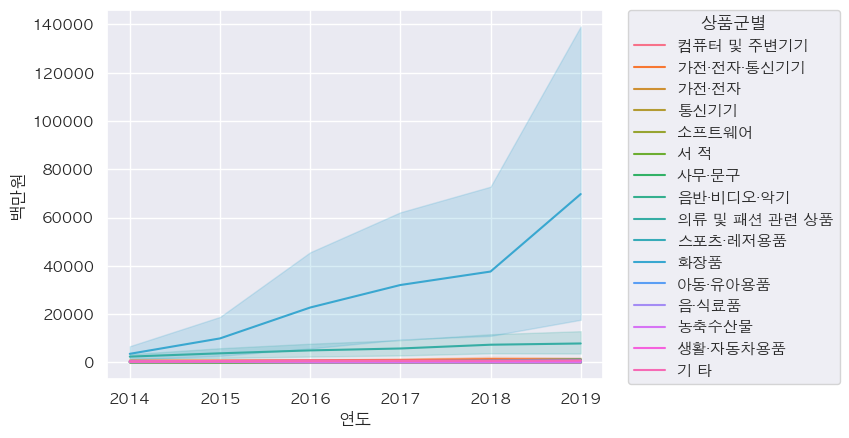
- 판매액순 상품군별 각각의 replot
- 화장품, 의류 및 패션 관련 상품
- 가전 전자 통신기기, 음반 비디오 악기
sns.relplot(data=df_total, x="연도", y="백만원", hue="상품군별", kind="line", col="상품군별", col_wrap=4)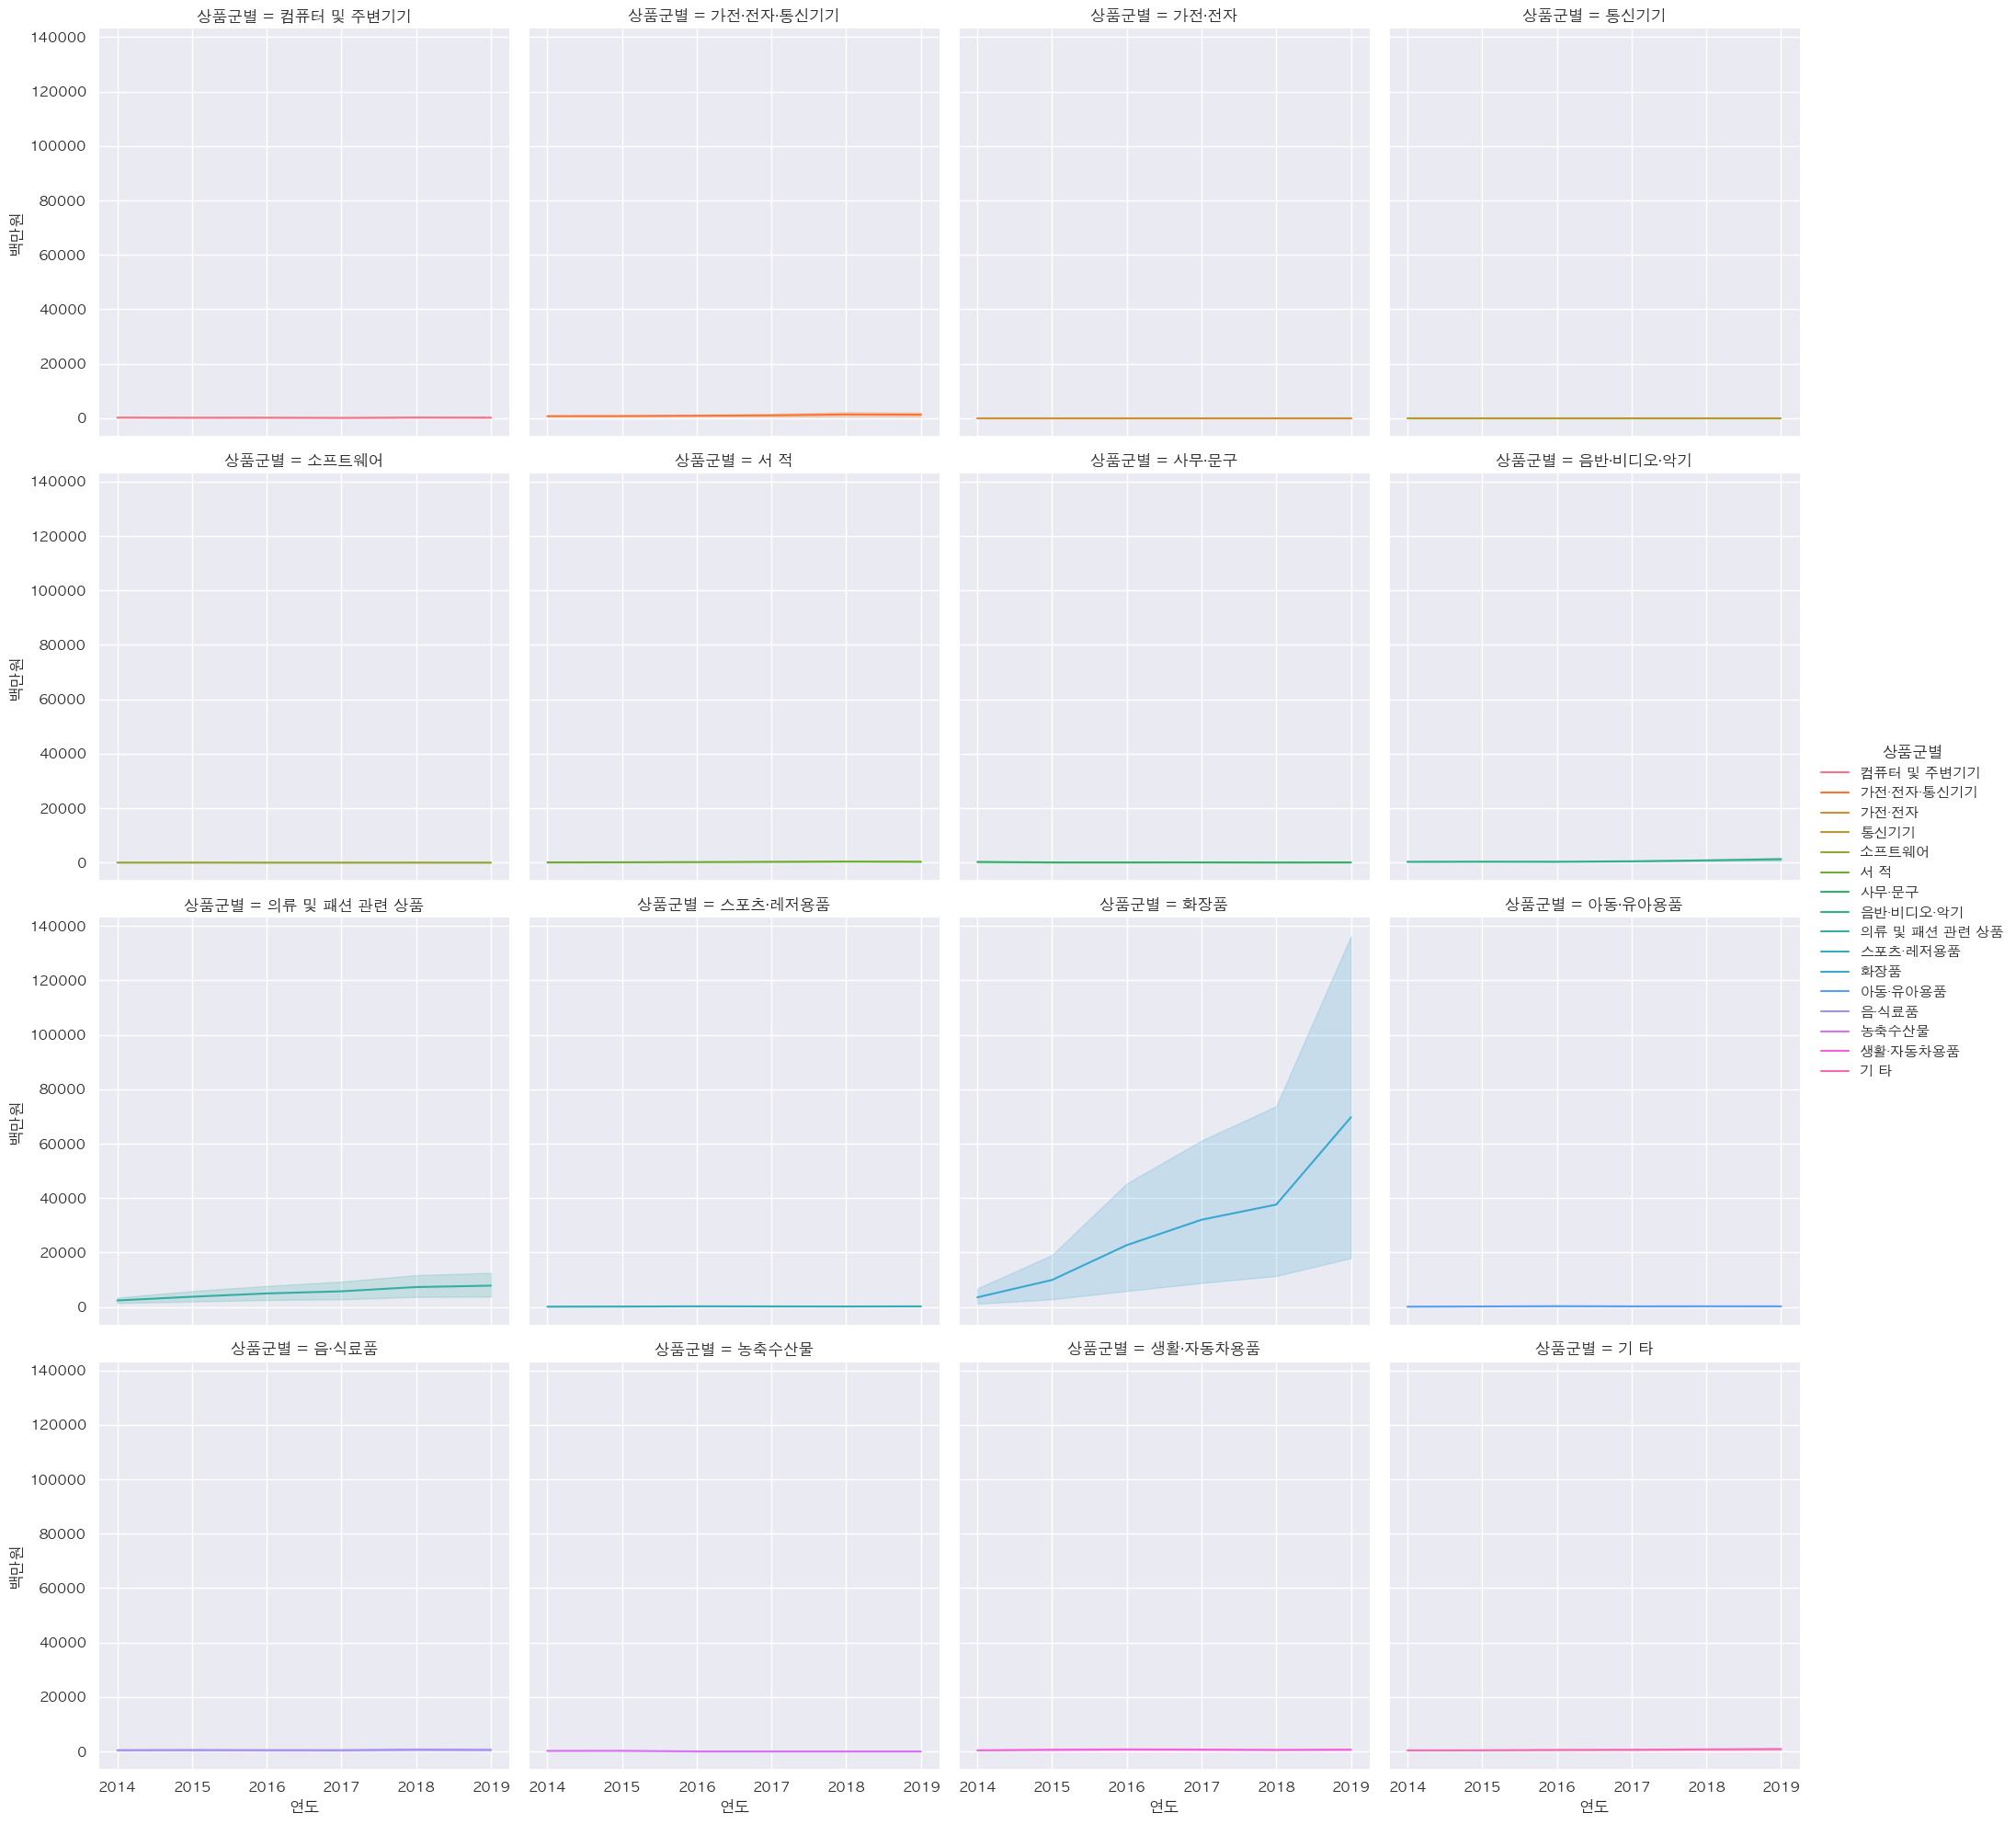
df_sub = df_total[~df_total.isin({'상품군별':['화장품', '의류 및 패션 관련 상품']})]
sns.relplot(data=df_sub, x='연도', y='백만원', hue='상품군별', kind='line', col_wrap=4, col='상품군별')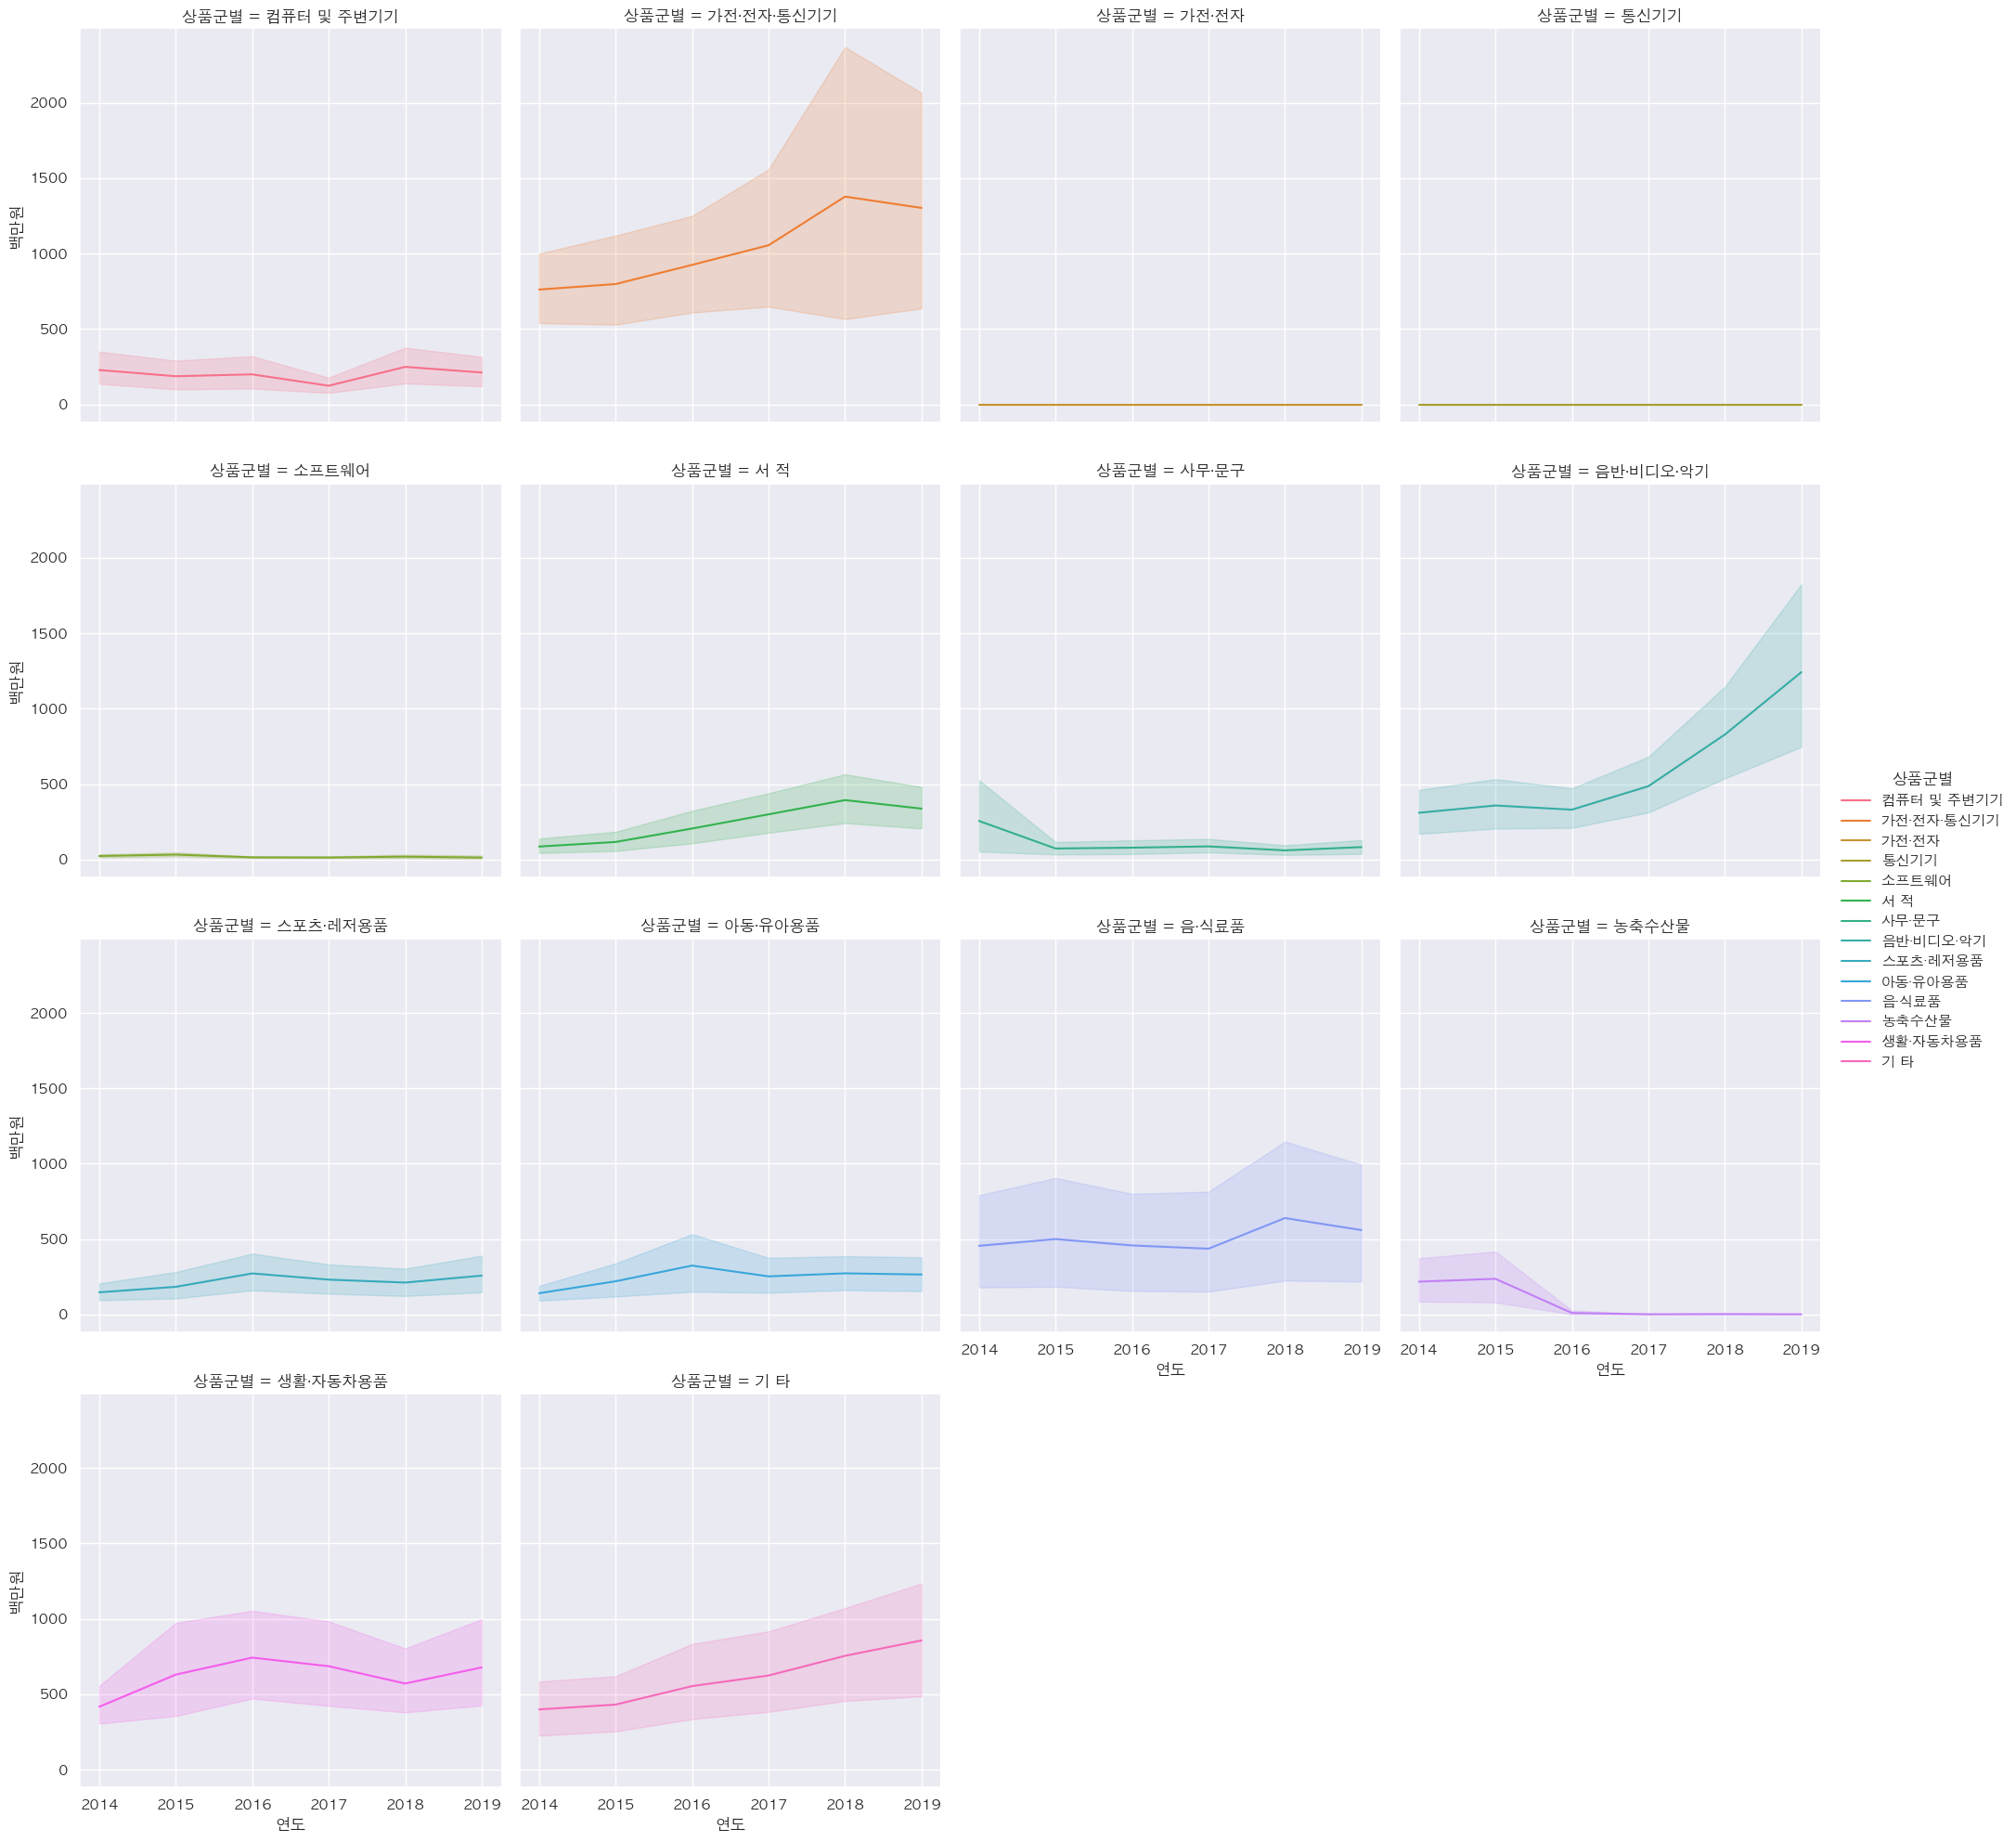
-
화장품 해외 판매액 시각화
- 분기별 화장품 판매액: 주로 연도가 지날수록 판매액이 증가함
df_cosmetic = df_total[df_total['상품군별'] == '화장품']
plt.figure(figsize=(12,6))
sns.lineplot(data=df_cosmetic, x='연도', y='백만원', hue='분기')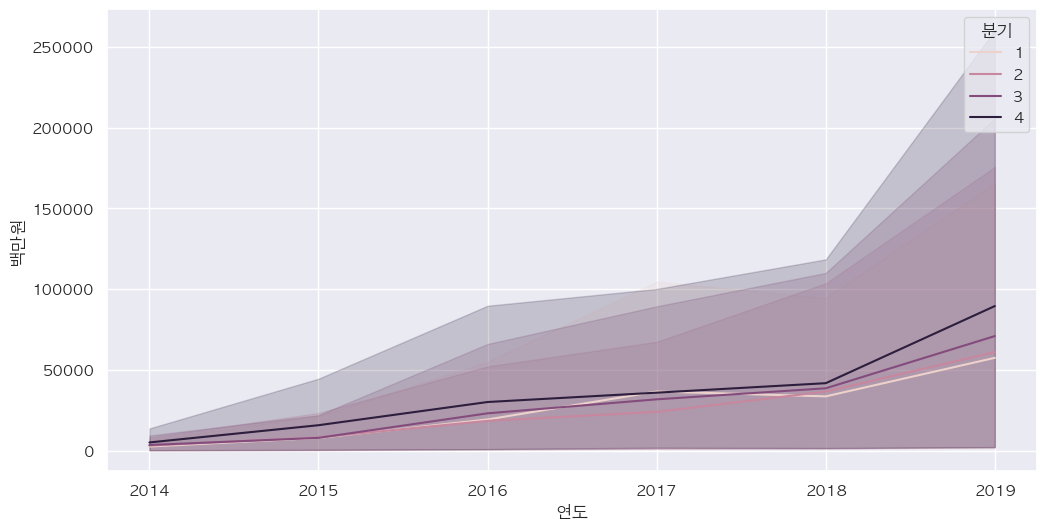
- 기간별 화장품 판매액
plt.figure(figsize=(12,6))
plt.xticks(rotation=30)
sns.lineplot(data=df_cosmetic, x='기간', y='백만원')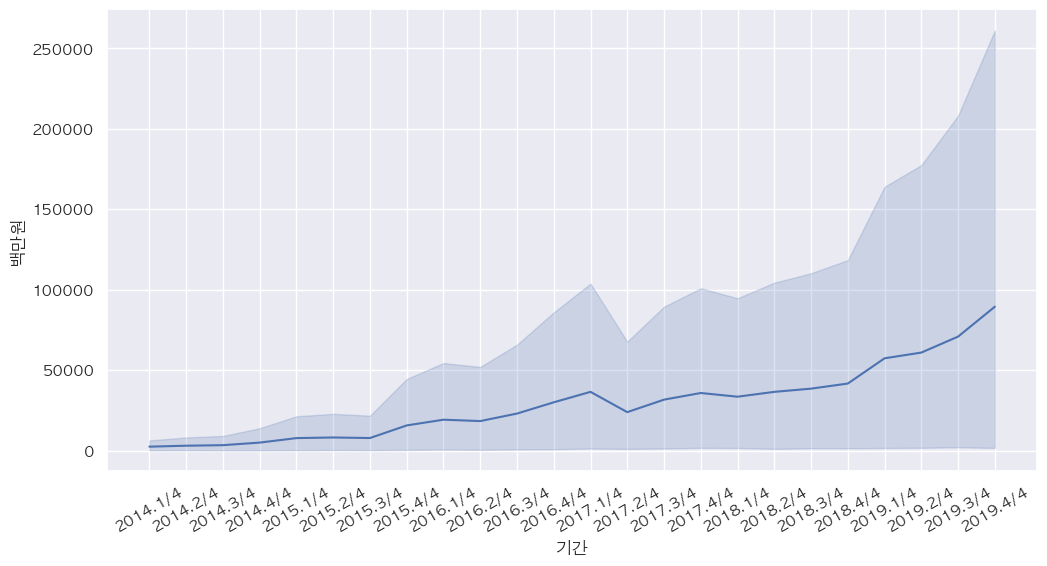
- 국가별 기간에 따른 화장품 판매액
- 화장품 판매액에서는 중국이 가장 높음
- 그 다음순으로 아세안, 중남미 순
plt.figure(figsize=(15,9))
plt.xticks(rotation=30)
sns.lineplot(data=df_cosmetic, x='기간', y='백만원', hue='국가(대륙)별')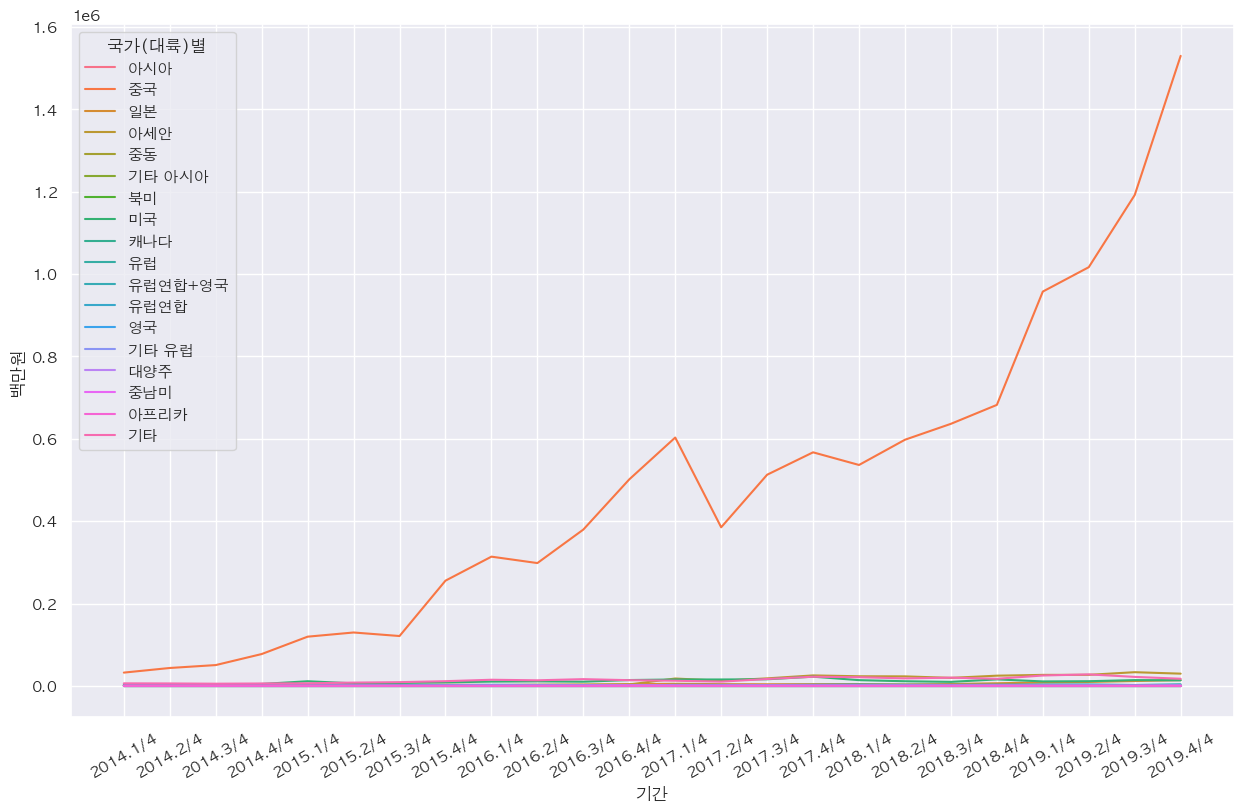
df_cosmetic_sub = df_cosmetic[df_cosmetic['국가(대륙)별'] != '중국']

plt.figure(figsize=(15,9))
plt.xticks(rotation=30)
sns.lineplot(data=df_cosmetic_sub, x='기간', y='백만원', hue='국가(대륙)별')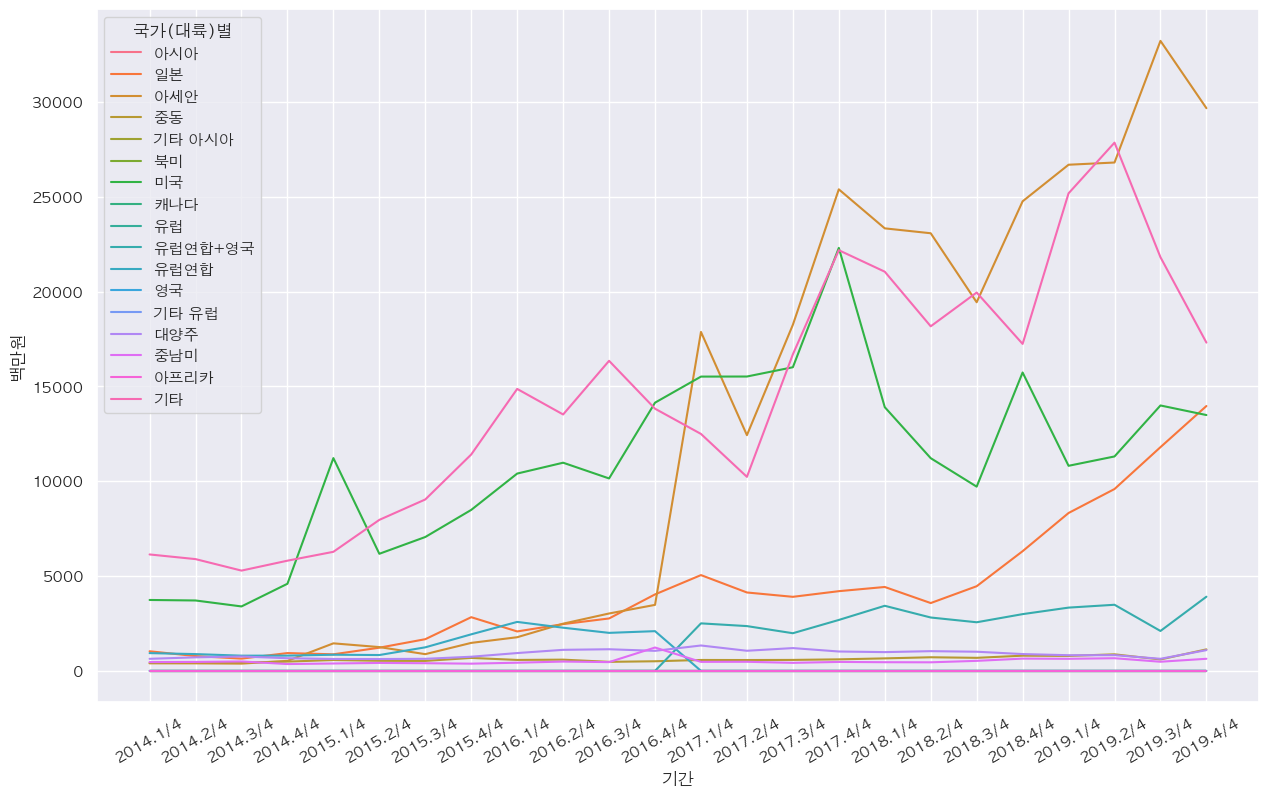
-
패션 의류 온라인 해외 직접 판매액 시각화
- 패션 의류 판매액 lineplot
- 중국, 일본, 미국, 아세안 순으로 직접판매액이 높음
df_fashion = df_new[(df_new['상품군별'] == '의류 및 패션 관련 상품') & (df_new['판매유형별'] == '계')]
plt.figure(figsize=(20, 8))
plt.xticks(rotation=30)
sns.lineplot(data=df_fashion, x="기간", y="백만원", hue="국가(대륙)별")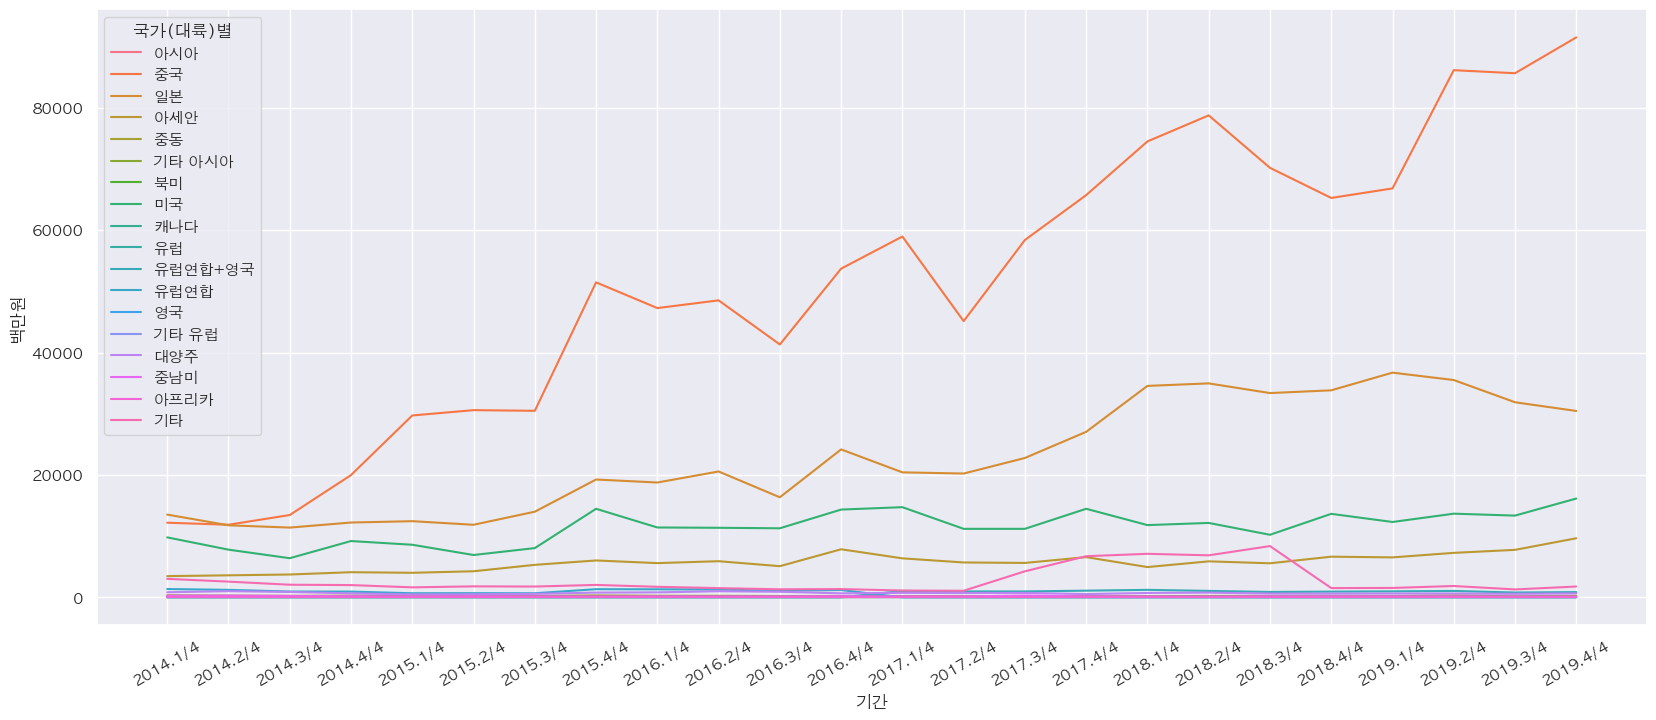
- 패션 의류 판매액 heatmap
- 중국이 가장 높음
- 일본과 미국은 점차 증가하는 것을 볼 수 있음
df_fashion = df_fashion[df_fashion['국가(대륙)별'].isin(['기타','대양주','미국','아세안','유럽연합','유럽연합+영국','일본','중국','중동'])]
result = df_fashion1.pivot_table(index="국가(대륙)별", columns="연도", values="백만원", aggfunc="sum")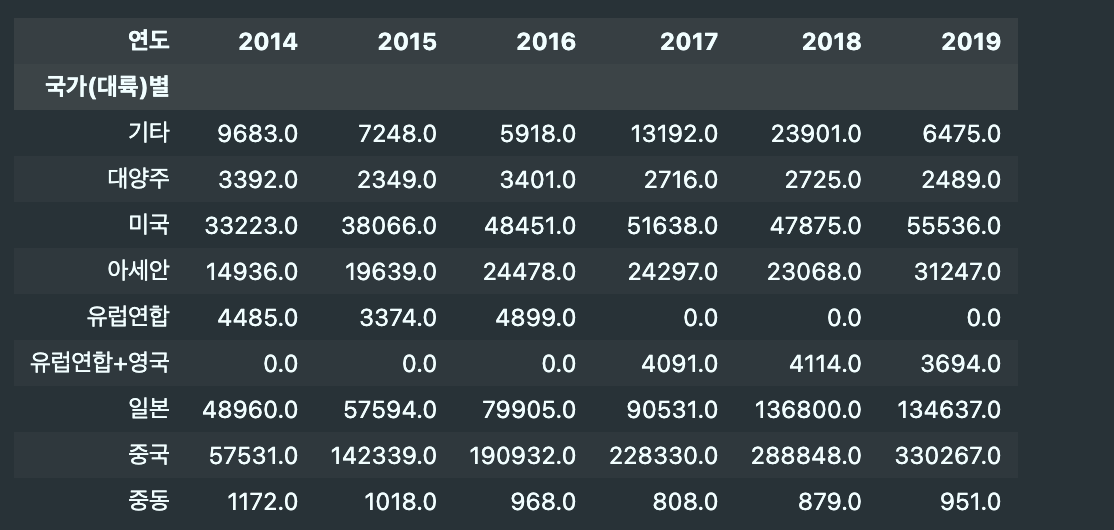
plt.figure(figsize=(10, 6))
sns.heatmap(result, cmap="Blues", annot=True, fmt=".0f")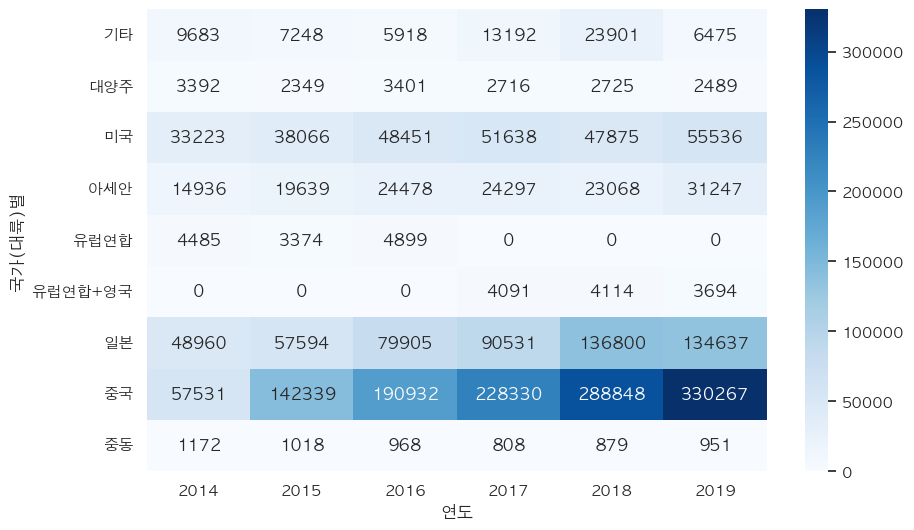
- 패션 의류 판매액 lineplot
4)
3. 정리
1) relplot
- 개념
참고블로그
2) isin
- 개념
참고블로그