221104~1106_광고 관리 플랫폼 대행사 센터 제작 48_대시보드 기능 기획 & 대시보드 기능 구현 - 대행사 대시보드 1
해당 게시글은 개인 프로젝트인 "광고 관리 플랫폼 대행사 센터 제작" 중
#133 "대시보드 기능 기획", #135 "대시보드 기능 구현 - 대행사 대시보드" 이슈를 다루고 있습니다.
1. 진행 사항
(1) 요약
- 대시보드 기능 기획
- 대시보드 기능 구현
- chart.js 테스트
- 대시보드 페이지 구현
- 대행사 대시보드
- 대시보드 통계 기능 구현
- 전체 일일 소진액
(2) 상세 내용
(2-1) 대시보드 기능 기획
- 대행사 대시보드
- 전체 일일 소진액 (일 단위, 월 단위)
- 예시 : 10/01 ~ 10/29 시 1~29일의 일일 전체 소진액 차트화 (일 단위)
예시 : 1월, 2월, 3월... 전체 소진액 차트화 (월 단위)
- 상위 탑 10 광고주 소진액 (기간 합계)
- 예시 : 10/01 ~ 10/29 일 간 광고주 별 총 소진액 중 탑 10위를 광고주 별로 나열
- 전체 일일 소진액 (일 단위, 월 단위)
- 그룹-에이전트 대시보드
- 그룹별 소진액 (기간 합계)
- 상위 탑 10 에이전트별 소진액 (기간 합계)
- 업종별 대시보드 (전체 업종별, 업종 내 광고주)
- 업종별 전체 소진액 대시보드 (기간 합계)
- 업종별 광고 실적 (기간 합계)
(2-2) 대시보드 기능 구현
- chart.js 테스트
- 대시보드 페이지 구현
- 대행사 대시보드 페이지 임시 구현
- 대시보드 통계 기능 구현
- 전체 일일 소진액 (일일) 통계 기능 구현
- chart.js 연동
2. 진행 현황 관련 상세 내용
(1) 대시보드 통계 기능 구현
- DashboardService에서 차트에 넣을 Dto 리스트 처리
    @Transactional(readOnly = true)
    public List<DashboardStatisticsDto> setTestDashboard(LocalDate startDate, LocalDate lastDate) {

        LocalDate defaultLastDate = LocalDate.parse(LocalDate.now().minusDays(1)
                .format(DateTimeFormatter.ofPattern("yyyy-MM-dd")));
        LocalDate startDateBeforeSevenDays = defaultLastDate.minusDays(6);
        LocalDate startDateBeforeThirtyDays = defaultLastDate.minusDays(30);

        if (lastDate == null) {
            lastDate = defaultLastDate;
        }

        if (startDate == null) {
            startDate = startDateBeforeThirtyDays;
        }

        return statisticsQueryRepository.dashboardTestQuery(startDate, lastDate);
}- DashboardService에서 테이블에 넣을 Dto 리스트 -> 페이지로 반환 처리
- Repository에서는 List로 반환하나 서비스에서 페이지로 반환 처리
- 차트 / 테이블을 분리한 이유는 차트는 오름차순, 테이블은 내림차순으로 정렬해야 하기 때문
(controller에서 @PageDefault에서 정렬을 따로 줬으나 적용이 안됨...)
    @Transactional(readOnly = true)
    public Page<DashboardStatisticsDto> setTestDashboardTable(LocalDate startDate, LocalDate lastDate, Pageable pageable) {

        LocalDate defaultLastDate = LocalDate.parse(LocalDate.now().minusDays(1)
                .format(DateTimeFormatter.ofPattern("yyyy-MM-dd")));
        LocalDate startDateBeforeSevenDays = defaultLastDate.minusDays(6);
        LocalDate startDateBeforeThirtyDays = defaultLastDate.minusDays(30);

        if (lastDate == null) {
            lastDate = defaultLastDate;
        }

        if (startDate == null) {
            startDate = startDateBeforeThirtyDays;
        }

        List<DashboardStatisticsDto> resultList =  statisticsQueryRepository.dashboardTestQuery2(startDate, lastDate);
        final int start = (int)pageable.getOffset();
        final int end = Math.min((start + pageable.getPageSize()), resultList.size());
        final Page<DashboardStatisticsDto> resultPage = new PageImpl<>(resultList.subList(start, end), pageable, resultList.size());

        return resultPage;
}- StatisticsQueryRepository
    public List<DashboardStatisticsDto> dashboardTestQuery(@Param("startDate") LocalDate startDate,
                                                           @Param("lastDate") LocalDate lastDate
    ) {
        List<DashboardStatisticsDto> results = jpaQueryFactory
                .select(Projections.fields(DashboardStatisticsDto.class,
                        performance.spend.sum().as("spend"),
						performance.createdAt.as("startDate")
                ))
                .from(performance)
                .leftJoin(performance.creative, creative)
                .where(
                        performance.createdAt.between(startDate, lastDate),
                        creative.deleted.eq(false)
                )
                .groupBy(performance.createdAt)
                .fetch();

        for (DashboardStatisticsDto result : results) {
            Long spend = result.getSpend();

            result.setSpendIndicator(spend);
        }

        return results;
    }

    public List<DashboardStatisticsDto> dashboardTestQuery2(@Param("startDate") LocalDate startDate,
                                                           @Param("lastDate") LocalDate lastDate
    ) {
        List<DashboardStatisticsDto> results = jpaQueryFactory
                .select(Projections.fields(DashboardStatisticsDto.class,
                        performance.spend.sum().as("spend"),
						performance.createdAt.as("startDate")
                ))
                .from(performance)
                .leftJoin(performance.creative, creative)
                .where(
                        performance.createdAt.between(startDate, lastDate),
                        creative.deleted.eq(false)
                )
                .groupBy(performance.createdAt)
                .orderBy(performance.createdAt.desc())
                .fetch();

        for (DashboardStatisticsDto result : results) {
            Long spend = result.getSpend();

            result.setSpendIndicator(spend);
        }

        return results;
    }
(2) 대시보드 페이지 구현
- DashboardController
    @GetMapping()
    public String dashboard(
            @RequestParam(required = false) @DateTimeFormat(iso = DateTimeFormat.ISO.DATE) LocalDate startDate,
            @RequestParam(required = false) @DateTimeFormat(iso = DateTimeFormat.ISO.DATE) LocalDate lastDate,
            Model model,
            ModelMap map,
            @PageableDefault(size = 10, sort = "startDate", direction = Sort.Direction.DESC) Pageable pageable
            ) {

        List<DashboardStatisticsDto> results = dashboardService.setTestDashboard(startDate, lastDate);
        Page<DashboardStatisticsDto> resultpages = dashboardService.setTestDashboardTable(startDate, lastDate, pageable);
        List<Integer> barNumbers = paginationService.getPaginationBarNumbers(pageable.getPageNumber(), resultpages.getTotalPages());

        model.addAttribute("results", results);
        model.addAttribute("resultpages", resultpages);
        map.addAttribute("paginationBarNumbers", barNumbers);

        return "dashboard/index";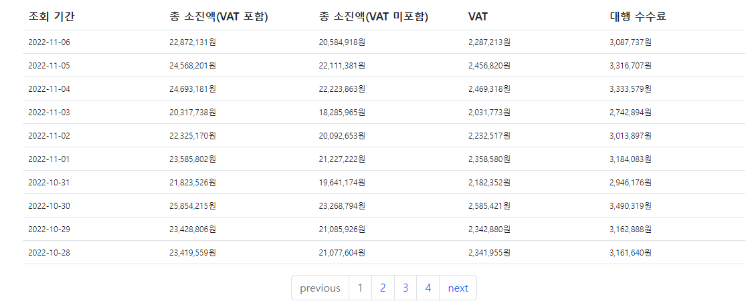
}- 소진액 데이터 페이징 기능 구현 완료
(3) chart.js 테스트 및 연동
- javascript 문법을 몰라서 1차 멘붕...
- 레퍼런스를 검색해보니 대부분 Thymeleaf가 아닌 MyBatis 기준으로 작성된 건이라 2차 멘붕...
- 대부분 정적으로 차트를 생성하는 예제나, ajax로 넘겨받은 JSON 데이터를 chart.js에 집어 넣는 예제가 많아서 3차 멘붕... (model로 받는데 ㅠㅠ)
- 일단 기존에는 html과 Thymeleaf 로직을 담은 xml 파일을 분리하여서 넣었으나 javascript 관련으로는 처음이라 html 내부에 넣었음
- 구글링 끝에 controller에서 전달한 model을 Thymeleaf를 통해 javascript에 직접 전달? 매핑? 하는 방법을 사용하였음
var data = /*[[ ${results} ]]*/[]; // controller에서 보낸 model - HTML + javascript + thymeleaf
<script type="text/javascript" th:inline="javascript">
    /*<![CDATA[*/
    $(document).ready(function () {
        var dayList = []; // x축
        var spendList = []; // y축

        var data = /*[[ ${results} ]]*/[]; // controller에서 보낸 model 'results'
		// 반복문으로 results 내의 startDate와 spend 데이터를 주입
        for (var i = 0; i < data.length; i++) {
            dayList.push(data[i].startDate);
            spendList.push(data[i].spend);
        }
        const ctx = document.getElementById('myChart').getContext('2d');
        const chart = new Chart(ctx, {
            type: 'bar', //chart 타입
            data: {
                labels: dayList,
                datasets: [{
                    fill: false,
                    data: spendList,
                    backgroundColor: [
                        'rgb(95,192,153)',
                    ],
                    borderColor: [
                        'rgba(125,134,173,0)',
                    ],
                    borderWidth: 1,
                    barPercentage: 0.5
                }]
            },
            options: {
				// 차트 범례 삭제
                plugins: {
                    legend: {
                        display: false
                    },
                },
                scales: {
                    y: {
                        grid: {
                            drawOnChartArea: true,  //선 지우기
                            drawTicks: false,   //축의 숫자 옆 눈금 지우기
                            drawBorder: true,
                            borderDash: [3, 3]	//y축 선 실선으로 길이 3,간격 3으로
                        },
                        ticks: {
                            padding: 10,
                            beginAtZero: true
                        }
                    },
                    x: {
                        grid: {
                            display: false,
                            drawBorder: false,
                            drawTicks: false
                        },
                        ticks: {
                            padding: 10
                        }
                    }
                }
            }
        });
    });
    /*]]>*/
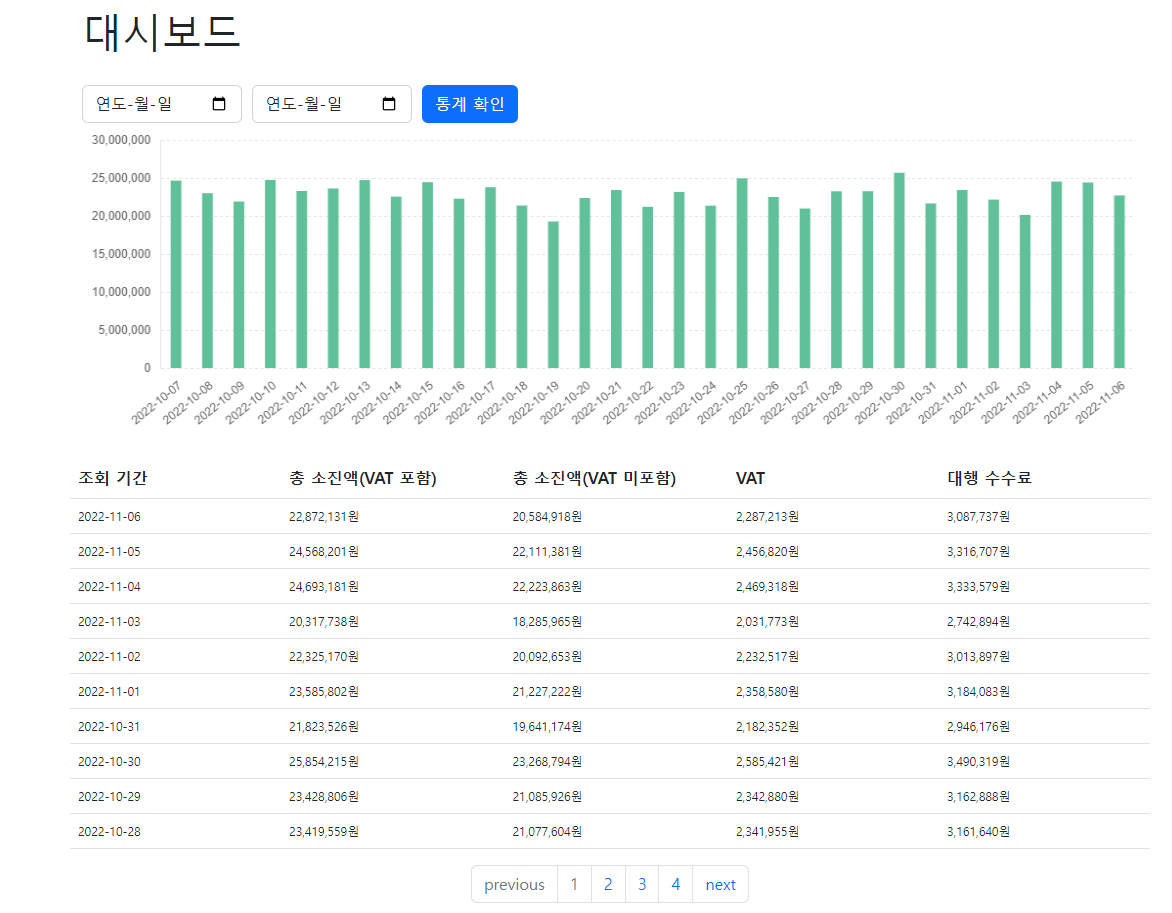
</script>- 대시보드 페이지 초기 접근 시 (최근 30일간 데이터 조회)
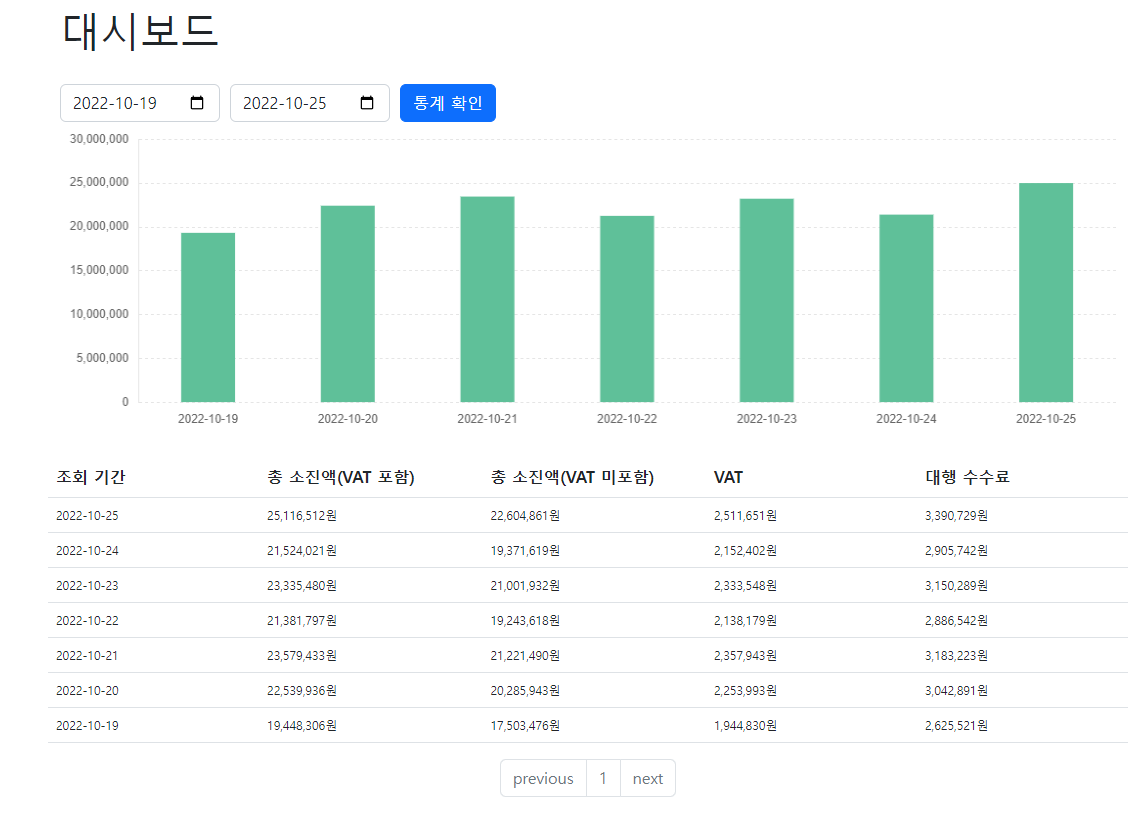
- 임의 기간 지정해서 조회
3. 추가 진행할 내용
- 전체 광고주 소진액 대시보드는 일단 구현 완료하였으니 다른 대시보드들도 만들어야겠다
- 다만 차트를 아예 새로 그리는 방식은... 아직은 어지러워서 그냥 대시보드 별로 페이지를 따로 만들 계획
- 조회된 차트 데이터에 대한 보고서를 다운로드 받는 기능도 구현 예정

공부했던 내용들을 모아둔 창고입니다.