[AAAI '21] Graph Neural Network-Based Anomaly Detection in Multivariate Time Series
Time series
1. Introduction
- Multivariate 시계열 데이터의 센서 간 상관관계를 잘 모델링 하기 위해 GNN 활용 가능
- BUT,
1) 센서별로 특징이 너무 다르기 때문에 그래도 node feature로 사용하는 건 별로임
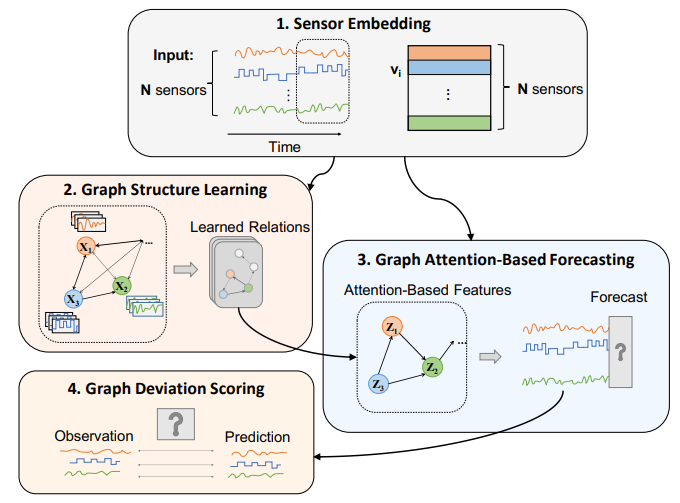
Sensor Embedding을 도입하고, 각 센서 임베딩을 initial node feature로 사용
2) 센서 간 연관성, 즉 graph connectivity는 애초에 알 수 없음
End-to-end training 말고, 학습을 두 단계로 나눔
1차 학습) 센서 임베딩과 함께 graph connectivity를 학습
2차 학습) 학습이 완료된 그래프를 바탕으로 attention을 도입하여 node feature representation 학습
2. Method
-
1차 학습) Sensor Embedding & Graph Structure Learning
각 센서 데이터 값은 d차원의 임베딩 벡터로 학습됨 sensors dimension
다변량 시계열은 directed graph 형태로 표현되고, edge, 즉 connectivity와 센서 임베딩이 학습됨
1. Connectivity prior info 없는 경우: Candidate sensors = {all} 중 센서 임베딩 벡터 간 코사인 유사도가 큰 top-K개의 센서가 연결되었다고 봄
2. Connectivity prior info 있는 경우: Candidate sensors = {prior} 이하 동일 -
2차 학습) Graph Attention-Based Forecasting
Input: sliding window size = w라고 할 때, t-w 부터 t-1 time step까지의 센서 데이터
Output: time step t에서의 예측된 센서 데이터
Attention score 기반으로 neighborhood aggregation을 진행하여 각 노드(센서)의 aggregated representation을 얻음 (attention score 계산시 센서 임베딩 함께 사용)
Fully connected layer을 통과시켜 time step t에서의 센서 데이터를 예측함 (예측시에도 센서 임베딩 함께 사용)
Loss: MSE -
Graph Deviation Scoring
Individual anomalousness
Overall anomalousness: Deviation 값의 스케일이 센서별로 매우 다를 수 있으므로 normalization 해서 max 값 취함
Threshold: (Fixed) Maximum anomaly score over the validation dataset
Experiment
- Dataset: SWaT, WADI
- Evaluation Metrics: Precision, Recall, F1-Score (Unbalanced 데이터셋이므로)
사담(타인의 의견이므로 사실여부는 모름....)
K 말로는 GDN은 end-to-end로 학습되며 학습시에는 오직 정상 데이터만을 사용한다고 한다.
논문에서는 forecasting이라는 용어를 썼는데 사실상 input graph를 reconstruction하여 output graph와 input graph의 deviation을 통해 이상치를 탐지한다고 한다 (실제 구현상에서는). 학습 과정에서 매 update마다 graph connectivity는 계속 바뀐다. 업데이트된 노드 임베딩에서 cosine similarity가 높은 top-K개의 센서들이 선택되는 것이겠지. 학습에 사용되는 모든 데이터는 정상으로 간주되며 학습 objective은 output과 input graph의 deviation을 적게끔, 즉 reconstruction이 잘 되도록 하는 것이다. Validation set으로 구한 graph deviation의 최댓값을 fixed threshold로 두고(그럼 validation set도 모두 정상으로 간주되어야 하겠지?), 추론시에 graph reconstruction을 통해 구한 deviation이 threshold를 넘으면 이상치로 탐지한다.

안녕하세요. 해당 논문 읽다가 이해가 안가는 부분이 있어서 댓글 남깁니다..
"Sensor Embedding을 도입하고, 각 센서 임베딩을 initial node feature로 사용" 이 부분이 무슨 의미인가요?? 센서 임베딩의 의미를 모르겠어요 ㅠ