Seaborn
seaborn 다운로드 후 import
%pip install seaborn

import seaborn as sns
꺾은선 그래프 Line Plot
sns.lineplot(x=[1,2,3,4], y=[4,3,2,1])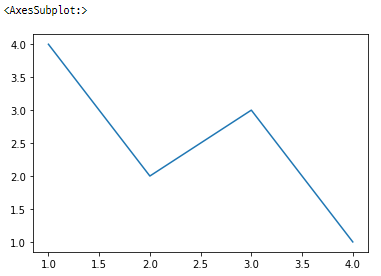
막대 그래프 Bar Plot
sns.barplot(x=[1,2,3,4], y=[0.7,0.2,0.1,0.05])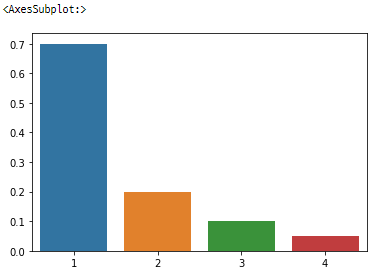
Plot의 속성
- matplotlib.pyplot import
import matplotlib.pyplot as plt- 제목 추가 : plt.title()
sns.barplot(x=[1,2,3,4], y=[0.7,0.2,0.1,0.05])
plt.title("Bar Plot")

plt.show()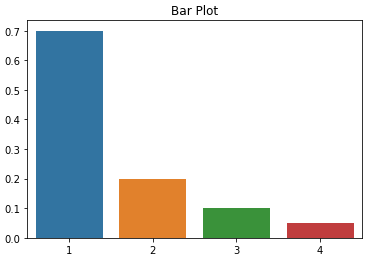
- x축, y축 설명 추가 : plt.xlabel(), plt.ylabel()
sns.barplot(x=[1,2,3,4], y=[0.7,0.2,0.1,0.05])
plt.xlabel("x")
plt.ylabel("y")

plt.show()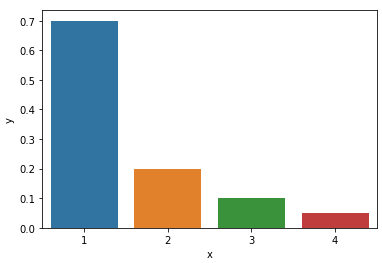
- 범위 지정 : plt.xlim(), plt.ylim()
sns.lineplot(x=[1, 3, 2, 4], y=[4, 3, 2, 1])
plt.ylim(2,3)

plt.show()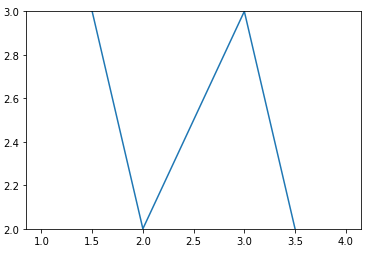
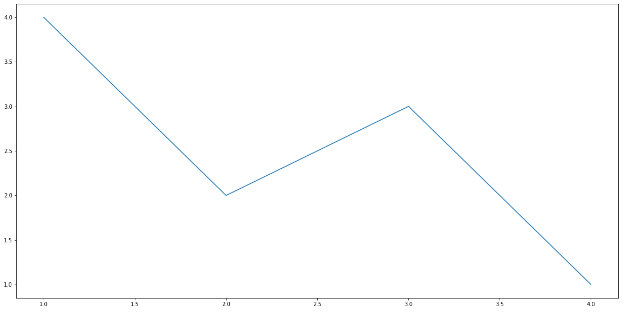
- 그래프 크기 지정 : plt.figure(figsize=(x,y))
plt.figure(figsize=(20,10))
sns.lineplot(x=[1, 3, 2, 4], y=[4, 3, 2, 1])

plt.show()