시나리오
pod에 문제가 생겨 지금 즉시 로그를 확인해야할 것같다.
어떻게 바로 확인할 수 있을까?
1. 로깅 아키텍쳐
노드가 컨테이너 로그를 처리하는 방법
- 컨테이너화 된 애플리케이션의 stdout(표준출력) 및 stderr(표준 에러) 스트림에 의해 생성된 모든 출력은 컨테이너 런타임이 처리
- 다양한 컨테이너 런타임들은 이를 각자 다른 방법으로 구현하였지만, kubelet과의 호환성은 CRI 로깅 포맷으로 표준화되어 있음.
- 기본적으로 컨테이너가 재시작하는 경우, kubelet은 종료된 컨테이너 하나의 로그와 함께 유지.
- 파드가 노드에서 축출되면, 해당하는 모든 컨테이너와 로그가 함께 축출
- kubelet은 쿠버네티스의 특정 API를 통해 사용자들에게 로그를 공개하며, 일반적으로 kubectl logs로 접근 가능.
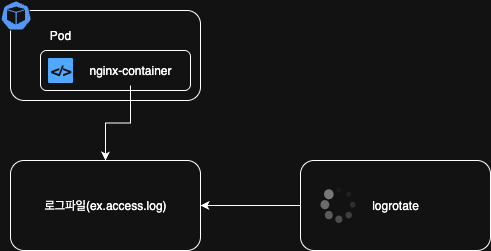
로그 로테이션
- kubelet이 로그를 자동으로 로테이트하도록 설정 가능. 로테이션을 구성해 놓으면, kubelet은 컨테이너 로그를 로테이트하고 로깅 경로 구조를 관리.
- kubelet은 이 정보를 컨테이너 런타임에 전송하고 (CRI를 사용), 런타임은 지정된 컨테이너 로그를 기록.
- kubelet 설정 파일을 사용하여 두 개의 kubelet 파라미터 containerLogMaxSize 및 containerLogMaxFiles를 설정 가능.
- 각 로그 파일의 최대 크기(기본값 10Mi)와 각 컨테이너에 허용되는 최대 파일 수 (5)를 각각 별도 구성 가능.
2. 로그 경로에 대한 개념
개념 이해를 위해 nginx 이미지의 pod를 띄워보자.
kubectl run po --image=nginx
kubectl logs po

>>>

/docker-entrypoint.sh: /docker-entrypoint.d/ is not empty, will attempt to perform configuration
/docker-entrypoint.sh: Looking for shell scripts in /docker-entrypoint.d/
/docker-entrypoint.sh: Launching /docker-entrypoint.d/10-listen-on-ipv6-by-default.sh
10-listen-on-ipv6-by-default.sh: info: Getting the checksum of /etc/nginx/conf.d/default.conf
10-listen-on-ipv6-by-default.sh: info: Enabled listen on IPv6 in /etc/nginx/conf.d/default.conf
/docker-entrypoint.sh: Sourcing /docker-entrypoint.d/15-local-resolvers.envsh
/docker-entrypoint.sh: Launching /docker-entrypoint.d/20-envsubst-on-templates.sh
/docker-entrypoint.sh: Launching /docker-entrypoint.d/30-tune-worker-processes.sh
/docker-entrypoint.sh: Configuration complete; ready for start up
2025/07/14 01:36:22 [notice] 1#1: using the "epoll" event method
2025/07/14 01:36:22 [notice] 1#1: nginx/1.29.0
2025/07/14 01:36:22 [notice] 1#1: built by gcc 12.2.0 (Debian 12.2.0-14+deb12u1)
2025/07/14 01:36:22 [notice] 1#1: OS: Linux 6.10.14-linuxkit
2025/07/14 01:36:22 [notice] 1#1: getrlimit(RLIMIT_NOFILE): 1048576:1048576
2025/07/14 01:36:22 [notice] 1#1: start worker processes
2025/07/14 01:36:22 [notice] 1#1: start worker process 29
2025/07/14 01:36:22 [notice] 1#1: start worker process 30
2025/07/14 01:36:22 [notice] 1#1: start worker process 31
2025/07/14 01:36:22 [notice] 1#1: start worker process 32
2025/07/14 01:36:22 [notice] 1#1: start worker process 33
2025/07/14 01:36:22 [notice] 1#1: start worker process 34
2025/07/14 01:36:22 [notice] 1#1: start worker process 35
2025/07/14 01:36:22 [notice] 1#1: start worker process 36
2025/07/14 01:36:22 [notice] 1#1: start worker process 37
2025/07/14 01:36:22 [notice] 1#1: start worker process 38
2025/07/14 01:36:22 [notice] 1#1: start worker process 39
2025/07/14 01:36:22 [notice] 1#1: start worker process 40
파드로 들어가서 curl 명령어를 사용하고 pod에 로그가 찍히는지 보도록 하자.
### pod 내부로 이동
k exec po -it -- /bin/bash

### 명령어 수행
root@po:/# curl localhost
<!DOCTYPE html>
<html>
<head>
<title>Welcome to nginx!</title>
<style>
html { color-scheme: light dark; }
body { width: 35em; margin: 0 auto;
font-family: Tahoma, Verdana, Arial, sans-serif; }
</style>
</head>
<body>
<h1>Welcome to nginx!</h1>
<p>If you see this page, the nginx web server is successfully installed and
working. Further configuration is required.</p>

<p>For online documentation and support please refer to
<a href="http://nginx.org/">nginx.org</a>.<br/>
Commercial support is available at
<a href="http://nginx.com/">nginx.com</a>.</p>

<p><em>Thank you for using nginx.</em></p>
</body>
</html>

### pod에서 나오기 (node로 이동)
root@po:/# exit
exit

### 로그 출력
k logs po
>>
....
...
..
..
127.0.0.1 - - [14/Jul/2025:01:38:54 +0000] "GET / HTTP/1.1" 200 615 "-" "curl/7.88.1" "-" ### 여기에 curl 명령어에 대한 로그가 나온다.
근데 재미있는 점이 있다. 바로 아래를 보자.
root@po:/# cd /var/log/
root@po:/var/log# cd nginx/
root@po:/var/log/nginx# ls -l
total 0
lrwxrwxrwx 1 root root 11 Jul  1 03:10 access.log -> /dev/stdout
lrwxrwxrwx 1 root root 11 Jul  1 03:10 error.log -> /dev/stderr
pod 내부에서 nginx 로그를 보면 access.log, error.log가 /dev/stdout. /dev/stderr에
심볼릭 링크가 걸려있다. 왜 심볼릭 링크가 걸려있냐면,
# forward request and error logs to docker log collector
    && ln -sf /dev/stdout /var/log/nginx/access.log \
    && ln -sf /dev/stderr /var/log/nginx/error.log \
이렇게 nginx의 도커파일에 심볼릭 링크가 걸리도록 되어있기 때문이다.
Nginx 도커파일
/dev/stdout가 어디로 링크 되어있는지를 보자.
lrwxrwxrwx 1 root root 15 Jul 14 01:36 /dev/stdout -> /proc/self/fd/1와우 /proc/self/fd/1이 뭐지?
여기서 proc는 프로세스를 의미하고, self란 pid 1번을 말한다.
원래 리눅스의 pid 1번은 기본적으로 systemd이지만, 도커 컨테이너에서는 다르다.
root@po:/var/log/nginx# apt udpate
root@po:/var/log/nginx# apt install procps -y
root@po:/var/log/nginx# ps -ef
UID        PID  PPID  C STIME TTY          TIME CMD
root         1     0  0 01:36 ?        00:00:00 nginx: master process nginx -g daemon off;
nginx       29     1  0 01:36 ?        00:00:00 nginx: worker process
nginx       30     1  0 01:36 ?        00:00:00 nginx: worker process
nginx       31     1  0 01:36 ?        00:00:00 nginx: worker process
nginx       32     1  0 01:36 ?        00:00:00 nginx: worker process
nginx       33     1  0 01:36 ?        00:00:00 nginx: worker process
nginx       34     1  0 01:36 ?        00:00:00 nginx: worker process
nginx       35     1  0 01:36 ?        00:00:00 nginx: worker process
nginx       36     1  0 01:36 ?        00:00:00 nginx: worker process
nginx       37     1  0 01:36 ?        00:00:00 nginx: worker process
nginx       38     1  0 01:36 ?        00:00:00 nginx: worker process
nginx       39     1  0 01:36 ?        00:00:00 nginx: worker process
nginx       40     1  0 01:36 ?        00:00:00 nginx: worker process
root        48     0  0 01:40 pts/0    00:00:00 /bin/bash
root       243    48  0 01:47 pts/0    00:00:00 ps -ef
즉, 1번 pid의 프로세스를 말하고 fd/1이라는 것은 stdout을 의미한다.
stdin은 0, stdout은 1 stderr는 2이다.
그렇다면 /proc/self/fd/1을 한 번 더 보자
root@po:/var/log/nginx# ls -al /proc/1/fd/1
l-wx------ 1 root root 64 Jul 14 01:36 /proc/1/fd/1 -> 'pipe:[286870]'
오마이갓 'pipe:'가 뭔데?
컨테이너 로그를 수집하거나 systemd에서 journald 로그를 수집하거나 등등
결론적으로, nginx의 로그가 컨테이너 로그로 수집되고 출력된다는 것이다.
그럼 로그 파일을 내가 직접 만들어보자.
root@po:/var/log/nginx# echo test log > test.log
root@po:/var/log/nginx# ls
access.log  error.log  test.log

root@po:/var/log/nginx# cat test.log
test log
root@po:/var/log/nginx# exit
exit

k logs po
>>>
...
...
..
..
2025/07/14 01:36:22 [notice] 1#1: start worker process 40
127.0.0.1 - - [14/Jul/2025:01:38:54 +0000] "GET / HTTP/1.1" 200 615 "-" "curl/7.88.1" "-"
test 로그를 만들고 파드의 로그를 찍어보면 아무 것도 나오지 않는다. 왜냐?
표준 출력, 표준 에러로 심볼릭 링크가 되어있지 않기 때문이다. <- 이게 매우매우 중요하다.
그럼 한 번 로그가 나오도록 해보자
k exec po -it -- /bin/bash
>>>
root@po:/# echo Mytest! >> /proc/1/fd/1
root@po:/# exit
exit

k logs po
>>>
2025/07/14 01:36:22 [notice] 1#1: start worker process 37
2025/07/14 01:36:22 [notice] 1#1: start worker process 38
2025/07/14 01:36:22 [notice] 1#1: start worker process 39
2025/07/14 01:36:22 [notice] 1#1: start worker process 40
127.0.0.1 - - [14/Jul/2025:01:38:54 +0000] "GET / HTTP/1.1" 200 615 "-" "curl/7.88.1" "-"
Mytest!
오 마이갓 Mytest! 로그가 /proc/1/fd/1 표준 출력으로 들어가서 파드 로그에 찍혔다.

포폴 및 이력서 : https://upbeat-suede-20b.notion.site/2265782662ce8071aeb7f67163e63467?source=copy_link