Isolation Forest
Isolation Forest
- 2008 IEEE International Conference on Data Mining
Introduction
Isolation Forest(IF)는 anomaly의 정량적 특성을 사용하여 nomal과 anomaly를 구분
1) Anomalies are the minority consisting of fewer instances
2) Anomalies have attribute-values that are very differnt from those of normal instance
➡ few and different : more susceptible to isolation than normal points
abnormal points : isolated closer to the root of the tree
normal points : isolated at the deeper end of the tree
IF는 tree 구조를 사용하여 point를 분리하고, 이런 tree의 ensemble(Forest)로 구성
저자는 time complexity가 linear하기 때문에 data의 양이 늘어나도 computational cost가 data 양에 비례하여 늘어남 ➞ large dataset or high-dimensional data에도 충분히 적용 가능
Isolation Trees and Forest
isolation의 의미 : separating an instance from the rest of the instances
즉, 어떤 data point가 단 하나의 구역에 존재하게 되는 상황
➡ 이상치는 정상 데이터에 비하여 isolation에 민감
Isolation tree
IF는 iTree를 사용하는 tree ensemble model
모든 point가 isolation될 때까지 재귀적으로 랜덤 이진 분할
- normal point : isolation까지 많은 split이 필요 ➞ 깊은 depth
- abnormal point : normal point와 비교했을 때 더 적은 split으로 isolation ➞ 얕은 depth
➡ split 횟수(path length)를 normal과 anomaly를 구분하는 measure로 사용
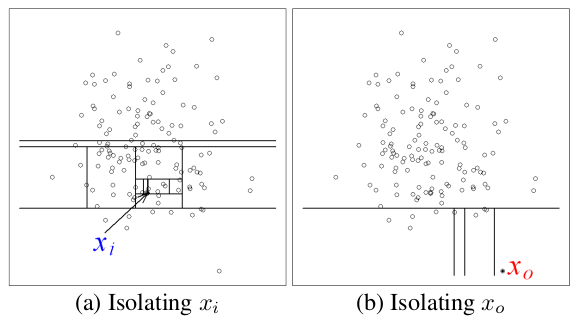
정상 데이터의 분포에 속해있는 와 비교했을 때, anomaly point 가 더 적은 split으로 isolation 됨
➡ 각 point를 고립시키는 것은 이상치가 정상 데이터보다 쉬움
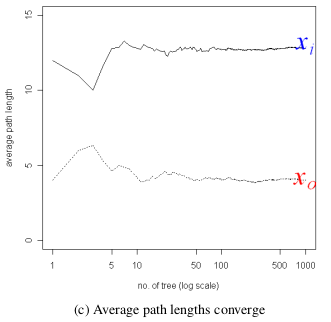
normal point 와 abnormal point 를 isolation 하는데 사용된 split 수(path length)가 iTree의 개수가 증가함에 따라 수렴
➡ ensemble하면 robust한 모델을 만들 수 있음
- 추가
일반적으로 sample의 크기가 클 수록 더 나은 성능을 보여주는 기존 anomaly detection 방법들과 달리 IF는 sampling size를 작게 유지할 때 가장 잘 작동
➞ 많은 data를 사용할 때, sub-sample을 사용하면 성능에는 큰 차이가 존재하지 않지만 computational complexity는 충분히 줄어들 수 있음
Anomaly Score
dataset = {}
: point 의 path length(isolation에 사용된 split 수)
: 의 path length의 평균(모든 iTree에서 사용된 path length의 평균)
anomaly score =
은 average path length of unsuccessful search in Binary Searcg Tree(BST), 를 normalize 하기 위해 사용(iTree의 평균 경로 길이)
anomaly score는 1에 가까울수록 point 가 anomaly에 가까움을 나타냄
가 0에 가까워진다는 것은 를 isolation 시키기 위한 평균 split 횟수가 0에 가까워 진다는 것
Algorithm
iForest
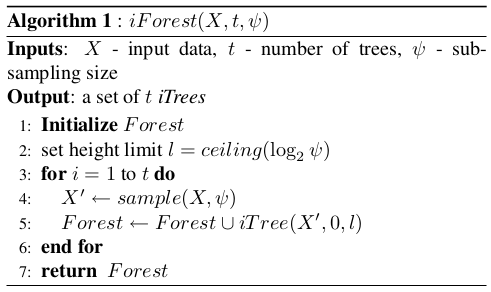
: input data
: number or trees
: sub-sampling size
parameters
- sub-sampling size
- train data의 size를 관리
- 적절한 값으로 결정하면 anomaly를 보다 안정적으로 탐지할 수 있음
- 너무 큰 size로 선택하면 성능과 상관 없이 processing time과 memory size를 크게 증가시킴
본 논문에서는 로 설정 ➞ anomaly를 detection하기에 충분한 size
- number of trees
- ensemble size 제어
- 본 논문에서 100보다 전에 수렴한다는 것을 확인
tree의 heigh limit :
➞ 대략적인 average tree length
➞ node가 개인 complete binary tree의 height는
➞ average tree length까지 tree를 성장시키는 이유 : anomaly는 average path length가 normal에 비하여 더 짧음 ( 전에 isolation 될 것)
iTree
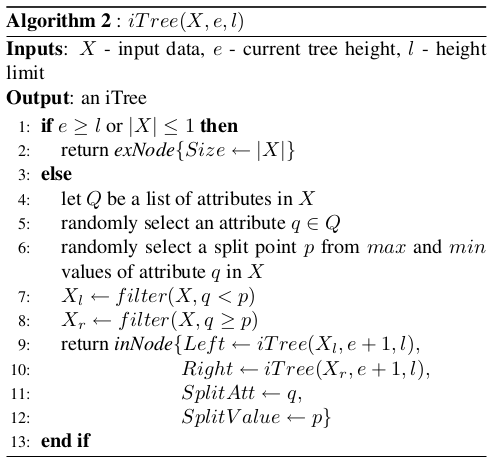
: input data
: current tree height
: height limit
	1. input data가 isolation or tree height가 height limit에 도달하면 external node로 return
    4-5. X의 attribute 중 하나를 randomly select ➞ q
    6. q의 범위 내에서 split에 사용할 point p를 randomly choice
    7-8. input data의 q의 value가 p보다 작으면 left branch로, 크거나 같으면 right branch로 할당
    9. 모든 data point가 isolation 될 때까지 tree 생성을 반복하고 q와 p의 정보를 저장
Evaluation stage
t개의 iTree에 대해 모든 data point 의 path length를 계산하고 이를 기반으로 각 data point의 anomaly score를 도출
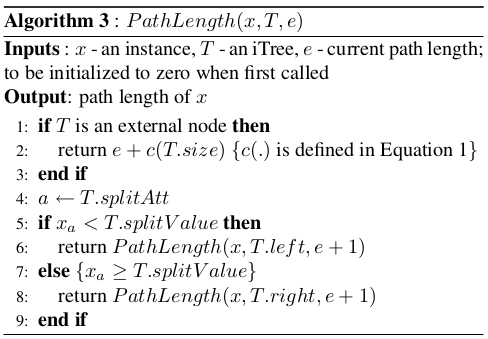
PathLength를 사용해서 point 가 root node에서 leaf node로 가는 edge 수를 구함
각 tree의 path length의 평균으로 point 의 anomaly score를 산출
1. (normal) x가 external node인 경우 current path length에 split을 계속했을 때
   기대되는 path length를 더함
4-8. split value와 x의 a attribute의 value를 비교
	 criteria보다 작으면 left node로 크면 right node로 보내 다시 알고리즘 적용
Conclusion
anomaly의 'few and different' 특징을 사용해서 abnormal point를 탐지
➞ anomaly는 normal과 비교했을 때 tree의 root에 더 가까운 위치에서 isolation
train data의 일부를 사용하여 생성한 tree들의 ensemble을 통해 이상치를 탐지하는 효과적인 모델 구축
linear time complexity ➞ large dataset에도 적용 가능
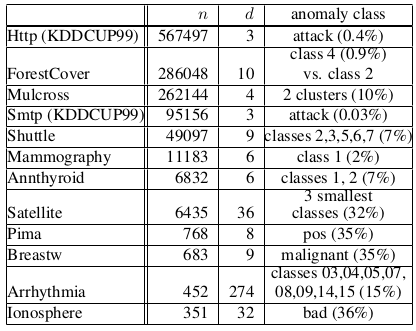
Dataset
본 논문에서 사용한 dataset list