Matplot 기초
1. Matplotlib, Seaborn
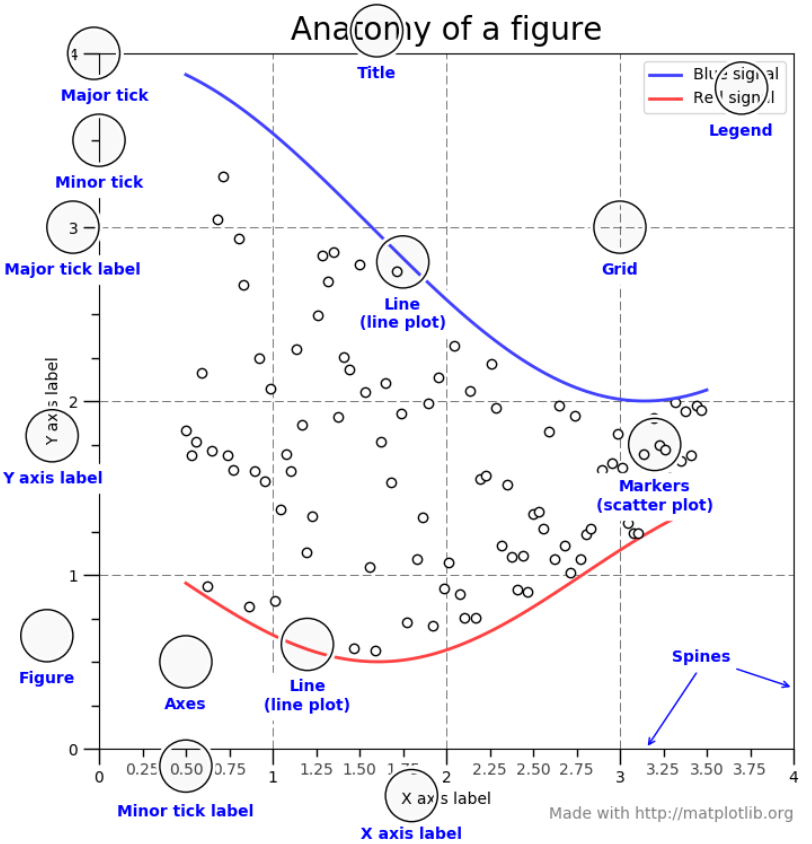
- Matplotlib
- python 프로그래밍 언어 및 수학적 확장 NumPy 라이브러리를 활용한 라이브러리
- 데이터 시각화와 2D 그래프 플롯에 사용된다.
- Seaborn
- matplotlib 기반의 파이썬 데이터 시각화 라이브러리.
2. Matplotlib
2-1. Matplotlib 기본 사용
import numpy as np
import matplotlib.pyplot as plt

plt.show()
plt.plot([x 값], [y값])    # 값 지정 후넣기
plt.plot([],[], data = data_dict)  # 데이터 딕셔너리형태
plt.xlabel("x축",loc="위치")         # x 축 레이블 설정
plt.legend(loc='위치')              # 범례 표시
plt.xlim(범위 지정)                  # x축의 범위를 지정한다
                                   # (지정하지 않으면 자동으로 지정)
plt.fill_between(x[1:3],y[1:3])    # 1,(1,1)~(3,3)을 잇는 영역이 채워짐
plt.xscale('log')                  # x스케일을 log로 변환
plt.grid(True,axis='x')            # x축 격자 생성(axis가 없으면 둘다 격자 생성)
plt.title("타이틀이름")               # 타이틀 생성

###이외에도 수직선/수평선 긋기 눈금표시, 마커지정, 색상지정, 폰트지정 등 이있다.
### 그래프 다수 그리기
fig=plt.figure()
fig.subplot(2,2,1) # subplot안에 2,2는 그래프가 들어갈 공간
# 2,2를 만들고 마지막 parameter가 그 인덱스 번호.
plt.subplot(2,2,2) # 2,2 공간에 2번째자리
# figure()은 Figure인스턴스를 생성하는데 Figure인스턴스의 역할은
# 이미지 전체의 영역을 확보하는 것이다.- 참고로 그래프는 중첩이 가능하다.
2-2. bar graph(막대 그래프)
- 범주가 있는 데이터 값을 막대로 표현하는 그래프
### 기본
ax = plt.bar(x,y)
### 라벨
plt.bar_label(ax, labels =[f'{x:,.0f}' for x in ax.datavalues] , label_type) # 여기서ㅏ datavalue는 y값을 의미한다.
###수평 막대
plt.barh(x,y)

###예제
subject = ['English', 'Math', 'Korean', 'Science', 'Computer']
points = [40, 90, 50, 60, 100]
plt.barh(subject,points)
2-3. line graph(선 그래프)
plt.plot(x,y)- style를 통해서 선 모양을 설정가능
2-4. Scatter (산점도)
plt.scatter(x,y)

### 크기와 색상 지정
plt.scatter(x,y, s = area , c = color)
### 투명도와 컬러맵
plt(x,y,alpha = 0.5,cmap = 'spectral')
2-5. histogram
### 기본
plt.hist(value1 , value2)

###가로축 개수 지정
plt.hist(value, bins = 2)     #가로축 2개
2-6. Pie chart
###기본
plt.plot(value,labels = , autopct = '어느자리 숫자 까지 표시')
2-7. heatmap
- 다양한 값을 갖는 숫자 데이터를 열분포 형태와 같이 색상을 이용해 시각화한 것
plt.matshow(df)
plt.colorbar()               # 컬러바
#또는
plt.pcolor(df)
plt.colorbar()                # 컬러바

###색상지정
plt.clim(-3,0,3.0)
전공자 학생