일간/ 주간
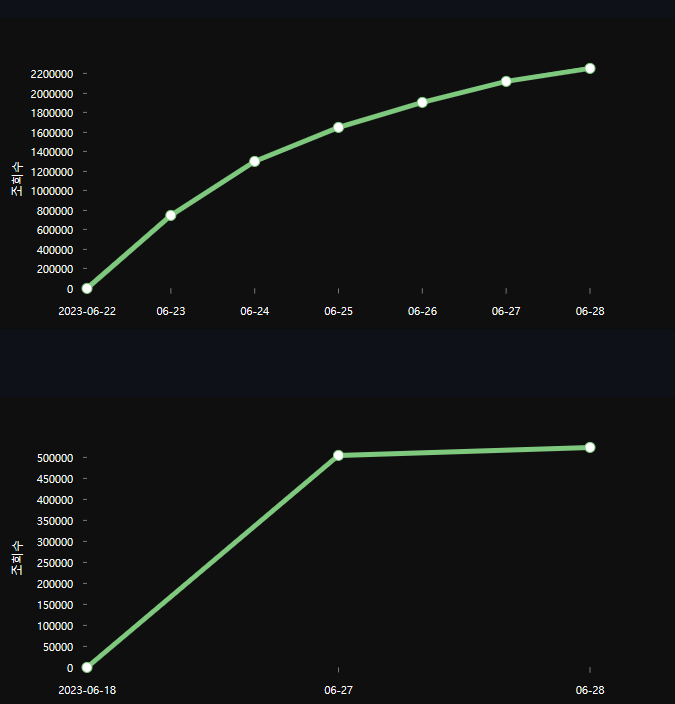
아무래도 일별로 계속 데이터를 받다보면, 그래프가 흉측해진다.. (nivo chart 를 사용중인데 x축 레이블이 겹치면 생략되는 옵션이 있었나..? 찾아봐야겠다.) 7일치 데이터가 쌓이면
데이터를 받은 시점부터. 주간별로 조회수가 집계되도록 수정!
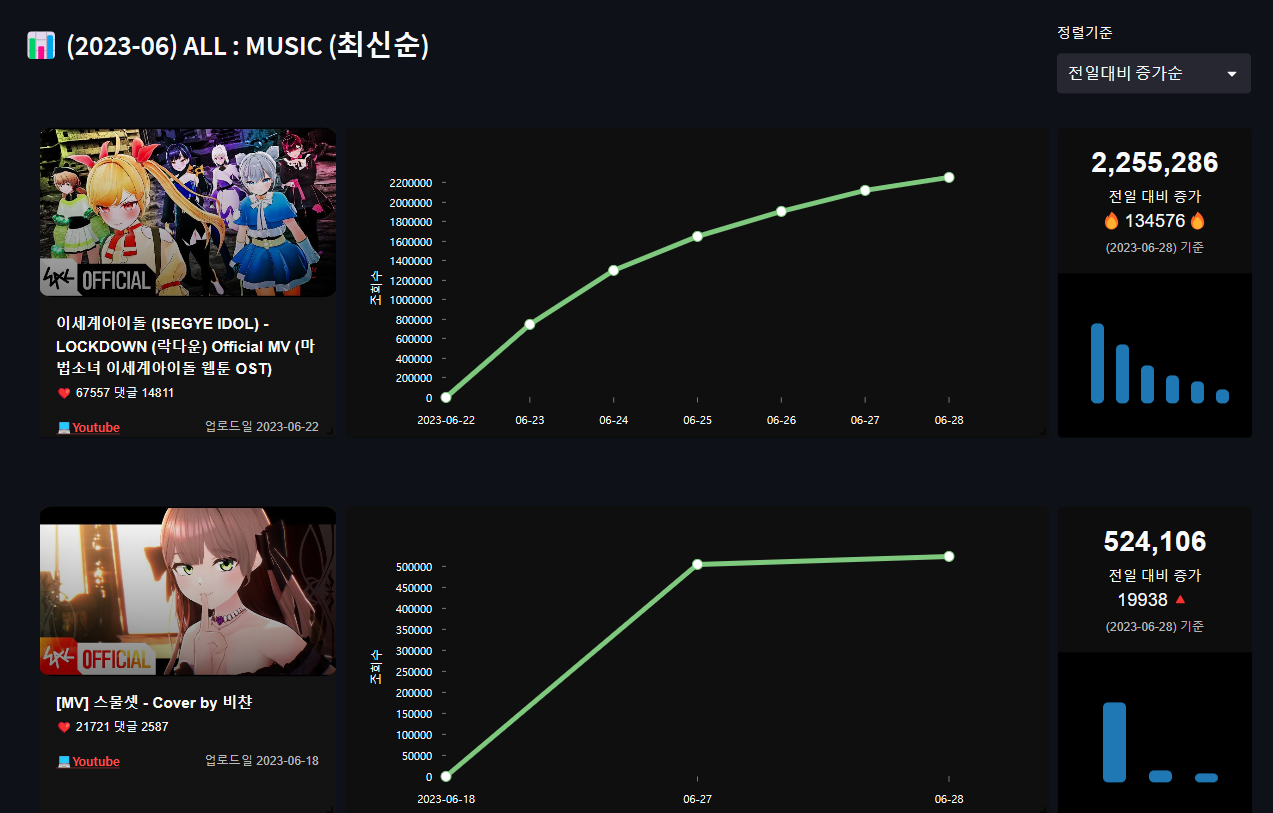
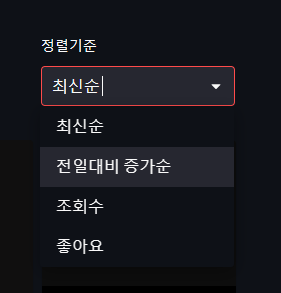
정렬기준 옵션
streamlit 의 selectbox를 이용하여 '최신순(업로드일)' , '전일대비 조회수 증가' ,'조회수', '좋아요' 순으로 영상 정렬옵션을 추가했습니다.
# sort 옵션
with st.container():
col1,col2,_ = st.columns([10,2,0.1])
with col1:
st.subheader(f"📊 ({year_option}) {list_option} " )
with col2:
sort_option_count = st.selectbox('정렬기준', ['최신순','전일대비 증가순','조회수','좋아요'], key='sort_count')
if sort_option_count == '최신순':
main_data = sorted(main_data, key=lambda x: x['publishedAt'], reverse=True)
elif sort_option_count == '전일대비 증가순':
main_data = sorted(main_data, key=lambda x: x['view_count_diff'], reverse=True)
elif sort_option_count == '조회수':
main_data = sorted(main_data, key=lambda x: x['view_count'], reverse=True)
elif sort_option_count == '좋아요':
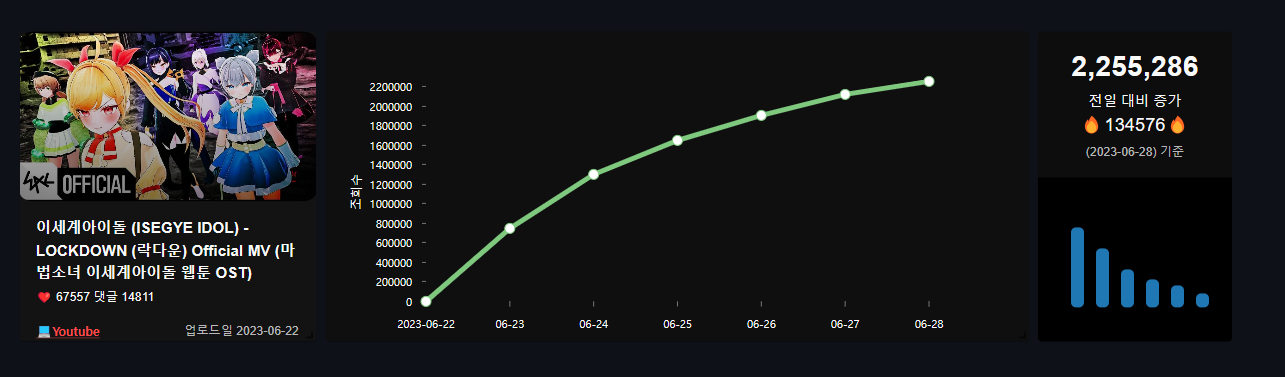
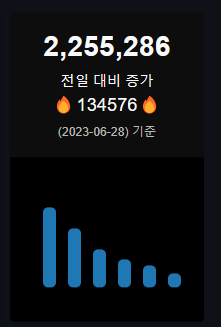
main_data = sorted(main_data, key=lambda x: x['like_count'], reverse=True)현재 총 조회수 + 전일대비 조회수 증가량
조회수 100,000 이상시 이모지가 다르게 🔥/🔺 표현
마찬가지로 8일이 넘어가는 경우 주간으로 집계됨

다양한 컨텐츠가 있는 곳을 좋아합니다. 시리즈를 참고하시면 편하게 글을 보실 수 있습니다🫠