https://www.kaggle.com/competitions/spaceship-titanic
Explain
Welcome to the year 2912, where your data science skills are needed to solve a cosmic mystery. We've received a transmission from four lightyears away and things aren't looking good.
The Spaceship Titanic was an interstellar passenger liner launched a month ago. With almost 13,000 passengers on board, the vessel set out on its maiden voyage transporting emigrants from our solar system to three newly habitable exoplanets orbiting nearby stars.
While rounding Alpha Centauri en route to its first destination—the torrid 55 Cancri E—the unwary Spaceship Titanic collided with a spacetime anomaly hidden within a dust cloud. Sadly, it met a similar fate as its namesake from 1000 years before. Though the ship stayed intact, almost half of the passengers were transported to an alternate dimension!
To help rescue crews and retrieve the lost passengers, you are challenged to predict which passengers were transported by the anomaly using records recovered from the spaceship’s damaged computer system.
Help save them and change history!
RandomForest
library
library(tidyr)
library(scales)
library(Hmisc)
library(ggplot2)
library(dplyr)
library(randomForest)
library(caret)
library(tidyverse)


> library(tidyverse)
-- Attaching packages ----------------------------------------------------------------- tidyverse 1.3.1 --v tibble  3.1.6     v stringr 1.4.0
v readr   2.1.2     v forcats 0.5.1
v purrr   0.3.4
-- Conflicts -------------------------------------------------------------------- tidyverse_conflicts() --x readr::col_factor()     masks scales::col_factor()
x randomForest::combine() masks dplyr::combine()
x purrr::discard()        masks scales::discard()
x dplyr::filter()         masks stats::filter()
x dplyr::lag()            masks stats::lag()
x purrr::lift()           masks caret::lift()
x randomForest::margin()  masks ggplot2::margin()
x dplyr::src()            masks Hmisc::src()
x dplyr::summarize()      masks Hmisc::summarize()
Warning messages:
1: package 'tidyverse' was built under R version 4.1.3
2: package 'tibble' was built under R version 4.1.3
3: package 'readr' was built under R version 4.1.3
4: package 'purrr' was built under R version 4.1.3
5: package 'stringr' was built under R version 4.1.3
6: package 'forcats' was built under R version 4.1.3
데이터 구조
-
train.csv - 승객의 약 3분의 2(~8700명)에 대한 개인 기록으로, 훈련 데이터로 사용됩니다.
PassengerId: 각 승객의 고유 ID입니다. 각 Id는ggg_pp형식을 취합니다. 여기서gggg는 승객과 함께 여행하는 그룹을 나타내고 pp는 그룹 내에서 승객의 번호입니다. 그룹의 사람들은 종종 가족 구성원이지만 항상 그렇지는 않습니다.HomePlanet: 승객이 출발한 행성, 일반적으로 영구 거주지의 행성입니다.CryoSleep: 승객이 항해 중 수면상태로 전환되도록 선택했는지 여부를 나타냅니다. 극저온 수면 중인 승객들은 객실에 갇혀 있습니다.
-Cabin: 승객이 묵고 있는 객실 번호.deck/num/side형태를 취합니다. 여기서side는 좌현의 경우P, 우현의 경우S일 수 있습니다.
-Destination: 승객이 내리는 도착지.Age: 승객의 나이VIP: 승객이 항해 중 특별 VIP 서비스에 대한 비용을 지불했는지 여부RoomService,FoodCourt,ShoppingMall,Spa,VRDeck: 승객들이 우주선 타이타닉의 많은 고급 편의시설 각각에 청구한 금액입니다.Name: 승객의 성 및 이름Transported: 승객이 다른 차원으로 운송되었는지 여부. 예측하려는 열인 목표값입니다.
-
test.csv : 남은 승객의 1/3(약 4300명)에 대한 개인 기록으로, 테스트 데이터로 사용됩니다. 이 세트의 승객에 대한 Transported 값을 예측하는 것이 작업입니다.
-
sample_submission.csv - 제출 파일 형식의 예시입니다.
PassengerId: 각 승객에 대한 ID입니다.Transported: 목표값 입니다. 승객에 따라True또는False를 예측합니다.
데이터 호출
# test data have not 'Transported' column
train = read.csv(
    file = 'train.csv',
    encoding = 'UTF-8',
    na.strings = c("", "na", "NA"),
    stringsAsFactor = TRUE
)

test = read.csv(
    file = 'test.csv',
    encoding = 'UTF-8',
    na.strings = c("", "na", "NA"),
    stringsAsFactor = TRUE
)
>str(train)
'data.frame': 8693 obs. of 14 variables:
$ PassengerId : Factor w/ 8693 levels "0001_01","0002_01",..: 1 2 3 4 5 6 7 8 9 10 ...
$ HomePlanet : Factor w/ 3 levels "Earth","Europa",..: 2 1 2 2 1 1 1 1 1 2 ...
$ CryoSleep : logi FALSE FALSE FALSE FALSE FALSE FALSE ...
$ Cabin : Factor w/ 6560 levels "A/0/P","A/0/S",..: 150 2185 2 2 2187 2184 3426 4560 3566 151 ...
$ Destination : Factor w/ 3 levels "55 Cancri e",..: 3 3 3 3 3 2 3 3 3 1 ...
$ Age : int 39 24 58 33 16 44 26 28 35 14 ...
$ VIP : logi FALSE FALSE TRUE FALSE FALSE FALSE ...
$ RoomService : int 0 109 43 0 303 0 42 0 0 0 ...
$ FoodCourt : int 0 9 3576 1283 70 483 1539 0 785 0 ...
$ ShoppingMall: int 0 25 0 371 151 0 3 0 17 0 ...
$ Spa : int 0 549 6715 3329 565 291 0 0 216 0 ...
$ VRDeck : int 0 44 49 193 2 0 0 NA 0 0 ...
$ Name : Factor w/ 8473 levels "Aard Curle","Aarjel Jaff",..: 5253 4503 458 7150 8320 6879 1156 1454 557 2865 ...
$ Transported : logi FALSE TRUE FALSE FALSE TRUE TRUE ...
> str(test)
'data.frame': 4277 obs. of 13 variables:
$ PassengerId : Factor w/ 4277 levels "0013_01","0018_01",..: 1 2 3 4 5 6 7 8 9 10 ...
$ HomePlanet : Factor w/ 3 levels "Earth","Europa",..: 1 1 2 2 1 1 2 2 2 1 ...
$ CryoSleep : logi TRUE FALSE TRUE FALSE FALSE FALSE ...
$ Cabin : Factor w/ 3265 levels "A/1/P","A/105/S",..: 2785 1868 258 260 1941 2099 121 464 464 2100
...
$ Destination : Factor w/ 3 levels "55 Cancri e",..: 3 3 1 3 3 3 1 3 1 1 ...
$ Age : int 27 19 31 38 20 31 21 20 23 24 ...
$ VIP : logi FALSE FALSE FALSE FALSE FALSE FALSE ...
$ RoomService : int 0 0 0 0 10 0 0 0 0 0 ...
$ FoodCourt : int 0 9 0 6652 0 1615 NA 0 0 639 ...
$ ShoppingMall: int 0 0 0 0 635 263 0 0 0 0 ...
$ Spa : int 0 2823 0 181 0 113 0 0 0 0 ...
$ VRDeck : int 0 0 0 585 0 60 0 0 0 0 ...
$ Name : Factor w/ 4176 levels "Aard Backo","Aard Kraie",..: 2913 2407 3377 2712 669 2250 72 18 1136 1342 ...train 과 test의 전체 비율 확인 후 하나의 데이터로 통합
scales::percent(nrow(train) / total) # "67%"
scales::percent(nrow(test) / total) # "33%"

> scales::percent(nrow(train) / total)
[1] "67%"
> scales::percent(nrow(test) / total)
[1] "33%"
train데이터와 test데이터의 결측값 처리와 형변환의 편의성을 위해서 전체 데이터로 통합 후 전처리를 실행
# all데이터 하나로 통합
test$Transported <- NA
all <- rbind(train, test)
str(all)
all <- all %>% select(-Name, -PassengerId)
하나의 데이터로 통합하기 위해서 test데이터에 Tranported 컬럼을 추가 후 rbind로 연결
Name과 PassengerId는 특별히 필요하지 않기 때문에 제거
결측값 확인 및 처리
CryoSleep 과 Cabin을 factor형으로 바꾸고 결측치 확인
# 결측치 제거 및 형변환
all$CryoSleep <- as.factor(all$CryoSleep)
all$Cabin <- as.character(all$Cabin)

sapply(all, function(x) {
    sum(is.na(x))
})
  HomePlanet    CryoSleep        Cabin  Destination          Age          VIP
         288          310          299          274          270          296
 RoomService    FoodCourt ShoppingMall          Spa       VRDeck  Transported
         263          289          306          284          268         4277
확인된 결측치 대체
all$Age <- impute(all$Age, mean)
all$CryoSleep <- impute(all$CryoSleep, mean)
all$VRDeck <- impute(all$VRDeck, mean)
all$ShoppingMall <- impute(all$ShoppingMall, mean)
all$RoomService <- impute(all$RoomService, mean)
all$FoodCourt <- impute(all$FoodCourt, mean)
all$VIP <- impute(all$FoodCourt, median)
all$Spa <- impute(all$Spa, mean)
all$HomePlanet <- impute(all$HomePlanet, mean)
all <- all%>%fill(Destination,Cabin,HomePlanet,CryoSleep, .direction="updown")
  HomePlanet    CryoSleep        Cabin  Destination          Age          VIP
           0            0            0            0            0            0
 RoomService    FoodCourt ShoppingMall          Spa       VRDeck  Transported
           0            0            0            0            0         4277
예측하기
다시 train데이터와 test데이터로 분리
분리 기준은 Transported 컬럼이 NA 값인 행은 모두 test데이터 셋으로 분리 나머지는 train 데이터 셋
test <- all %>% filter( is.na(Transported)  )
train <- all %>% filter( !is.na(Transported)  )
nrow(train)
nrow(test)
> nrow(train)
[1] 8693
> nrow(test)
[1] 4277
Transported 컬럼을 1과 0의 값으로 변환 후 randomforest학습 진행
train$Transported <- ifelse(
    train$Transported == 'TRUE',
    train$Transported <- 1,
    train$Transported <- 0
)


train$Transported <- as.factor(as.character(train$Transported))
table(train$Transported)


md_rf <- randomForest(
    Transported ~ .,
    train,
    do.trace = TRUE,
    ntree = 500
)
> table(train$Transported )

   0    1
4315 4378


> md_rf

Call:
 randomForest(formula = Transported ~ ., data = train, do.trace = TRUE,      ntree = 500)
               Type of random forest: regression
                     Number of trees: 500
No. of variables tried at each split: 3

          Mean of squared residuals: 0.1365587
                    % Var explained: 45.37
랜덤포레스트모델로 값을 예측해보겠습니다.
md_rf.pred <- predict(
    md_rf,
    newdata = test
)

head(md_rf.pred)
> head(md_rf.pred)
         1          2          3          4          5          6
0.71248501 0.02795992 0.98936932 0.92243904 0.54748967 0.72793143
이제 이 값을 0.5이상은 "True", 미만은 "False"로 지정해서 factor형으로 변경하겠습니다.
md_rf.pred <- ifelse(
    md_rf.pred >= 0.5,
    md_rf.pred <- "True",
    md_rf.pred <- "False"
)

md_rf.pred <- as.factor(md_rf.pred)
head(md_rf.pred)
valid데이터를 sample_submission으로 가져와서, 해당 데이터의 PassengerId를 index값으로 사용해서 dataframe을 만들어 결과 csv파일로 제출합니다.
valid <- read.csv("sample_submission.csv")
result <- data.frame(
    valid$PassengerId,
    md_rf.pred
)


names(result) <- c("PassengerId", "Transported")
write.csv(result, "randomForest_predict.csv", row.names = FALSE)
result2 <- read.csv("result.csv")
head(result2)
> head(result2)
PassengerId Transported
1 0013_01 True
2 0018_01 False
3 0019_01 True
4 0021_01 True
5 0023_01 True
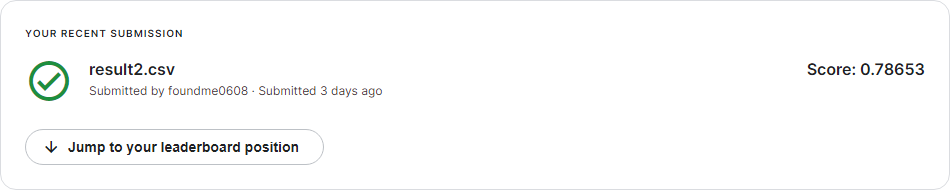
6 0027_01 True결과