import data
from sklearn.datasets import load_diabetes
diabetes = load_diabetes()
# 442x10개의 (2차원) data와
# 442개의 (1차원) target 이 있음Scatter()
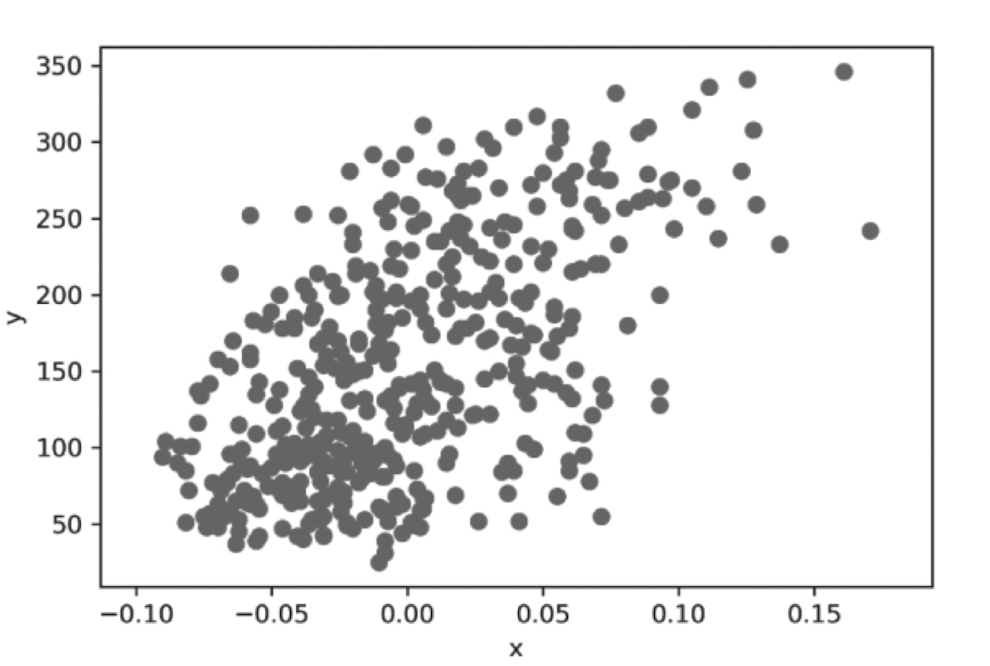
scatter plot : 산점도
산점도를 표시한다.
import matplotlib.pyplot as plt
plt.scatter(diabetes.data[:, 2], diabetes.target) # 3번째 data와 target 가져옴
plt.xlabel('x') # x축 이름
plt.ylabel('y') # y축 이름
plt.show( )