
6주차: 6/5/2023 - 6/11/2023
1. Background
- Goal
- 1. Identify depopulation areas
- 2. Visualize depopulation areas
- 3. Use cartogram
2. Depopulation areas
import numpy as np
import pandas as pd

import matplotlib.pyplot as plt
import seaborn as sns
import koreanize_matplotlib
%matplotlib inline

import warnings
warnings.filterwarnings(action="ignore")
fillna()
datas = {
    "A": np.random.randint(1, 45, 8),
    "B": np.random.randint(1, 45, 8),
    "C": np.random.randint(1, 45, 8)
}

datas

fillna_df = pd.DataFrame(datas)
fillna_df

fillna_df.loc[2:4, ["A"]] = np.nan
fillna_df.loc[3:5, ["B"]] = np.nan
fillna_df.loc[4:7, ["C"]] = np.nan
fillna_df- method: backfill/bfill, pad/ffill
- axis: 0 for horizontal, 1 for vertical
fillna_df.fillna(method="pad")Reading data
population = pd.read_excel("../data/07_population_raw_data.xlsx", header=1)
population.fillna(method="pad", inplace=True)
population

# Change column name
population.rename(
    columns={
        "행정구역(동읍면)별(1)": "광역시도",
        "행정구역(동읍면)별(2)": "시도",
        "계": "인구수"
    }, inplace=True
)
population.tail()

# Remove 소계
population = population[population["시도"] != "소계"]
population.head()

population.is_copy = False

population.rename(
    columns={"항목": "구분"}, inplace=True
)population.loc[population["구분"] == "총인구수 (명)", "구분"] = "합계"
population.loc[population["구분"] == "남자인구수 (명)", "구분"] = "남자"
population.loc[population["구분"] == "여자인구수 (명)", "구분"] = "여자"Identifing depopulation areas
# Data for depopulation areas

population["Age 20-39"] = (
    population["20 - 24세"] + population["25 - 29세"] + population["30 - 34세"] + population["35 - 39세"]
)

population["Age > 65"] = (
    population["65 - 69세"] +
    population["70 - 74세"] +
    population["75 - 79세"] +
    population["80 - 84세"] +
    population["85 - 89세"] +
    population["90 - 94세"] +
    population["95 - 99세"] +
    population["100+"]
)
# pivot_table
pop = pd.pivot_table(
data=population,
index=["광역시도", "시도"],
columns=["구분"],
values=["인구수", "Age 20-39", "Age > 65"]
)
pop# Depopulation ratio
pop["Depopulation ratio"] = pop["Age 20-39", "여자"] / (pop["Age > 65", "합계"] / 2)
pop.tail()
# Depopulation area column
pop["Depopulation area"] = pop["Depopulation ratio"] < 1.0
pop
# Identify depopulation areas
pop[pop["Depopulation area"] == True].index.get_level_values(1)
pop.reset_index(inplace=True)
pop.head()
tmp_columns = [
pop.columns.get_level_values(0)[n] + pop.columns.get_level_values(1)[n]
for n in range(0, len(pop.columns.get_level_values(0)))
]
pop.columns = tmp_columns
pop.head()3. Area ID for map visualization
tmp_gu_dict = {
    "수원": ["장안구", "권선구", "팔달구", "영통구"],
    "성남": ["수정구", "중원구", "분당구"],
    "안양": ["만안구", "동안구"],
    "안산": ["상록구", "단원구"],
    "고양": ["덕양구", "일산동구", "일산서구"],
    "용인": ["처인구", "기흥구", "수지구"],
    "청주": ["상당구", "서원구", "흥덕구", "청원구"],
    "천안": ["동남구", "서북구"],
    "전주": ["완산구", "덕진구"],
    "포항": ["남구", "북구"],
    "창원": ["의창구", "성산구", "진해구", "마산합포구", "마산회원구"],
    "부천": ["오정구", "원미구", "소사구"]
}
(1) 일반 시 이름과 세종시, 광역시도 일반 구 정리
si_name = [None] * len(pop)
si_name

for idx, row in pop.iterrows():
    if row["광역시도"][-3:] not in ["광역시", "특별시", "자치시"]:
        si_name[idx] = row["시도"][:-1]
    elif row["광역시도"] == "세종특별자치시":
        si_name[idx] = "세종"
    else:
        if len(row["시도"]) == 2:
            si_name[idx] = row["광역시도"][:2] + " " + row["시도"]
        else:
            si_name[idx] = row["광역시도"][:2] + " " + row["시도"][:-1]
(2) 행정구
for idx, row in pop.iterrows():
    if row["광역시도"][-3:] not in ["광역시", "특별시", "자치시"]:
        for keys, values in tmp_gu_dict.items():
            if row["시도"] in values:
                if len(row["시도"]) == 2:
                    si_name[idx] = keys + " " + row["시도"]
                elif row["시도"] in ["마산합포구", "마산회원구"]:
                    si_name[idx] = keys + " " + row["시도"][2:-1]
                else:
                    si_name[idx] = keys + " " + row["시도"][:-1]
(3) 고성군
for idx, row in pop.iterrows():
    if row["광역시도"][-3:] not in ["광역시", "특별시", "자치시"]:
        if row["시도"][:-1] == "고성" and row["광역시도"] == "강원도":
            si_name[idx] = "고성(강원)"
        elif row["시도"][:-1] == "고성" and row["광역시도"] == "경상남도":
si_name[idx] = "고성(경남)"pop["ID"] = si_name
del pop["Age 20-39남자"]
del pop["Age > 65남자"]
del pop["Age > 65여자"]4. Draw the map (cartogram)
draw_korea_raw = pd.read_excel("../data/07_draw_korea_raw.xlsx")
draw_korea_raw

draw_korea_raw_stacked = pd.DataFrame(draw_korea_raw.stack())
draw_korea_raw_stacked

draw_korea_raw_stacked.reset_index(inplace=True)
draw_korea_raw_stacked

draw_korea_raw_stacked.rename(
    columns={
        "level_0": "y",
        "level_1": "x",
        0: "ID"
    }, inplace=True
)
draw_korea_raw_stacked

draw_korea = draw_korea_raw_stacked
BORDER_LINES = [
[(5, 1), (5, 2), (7, 2), (7, 3), (11, 3), (11, 0)], # 인천
[(5, 4), (5, 5), (2, 5), (2, 7), (4, 7), (4, 9), (7, 9), (7, 7), (9, 7), (9, 5), (10, 5), (10, 4), (5, 4)], # 서울
[(1, 7), (1, 8), (3, 8), (3, 10), (10, 10), (10, 7), (12, 7), (12, 6), (11, 6), (11, 5), (12, 5), (12, 4), (11, 4), (11, 3)], # 경기도
[(8, 10), (8, 11), (6, 11), (6, 12)], # 강원도
[(12, 5), (13, 5), (13, 4), (14, 4), (14, 5), (15, 5), (15, 4), (16, 4), (16, 2)], # 충청남도
[(16, 4), (17, 4), (17, 5), (16, 5), (16, 6), (19, 6), (19, 5), (20, 5), (20, 4), (21, 4), (21, 3), (19, 3), (19, 1)], # 전라북도
[(13, 5), (13, 6), (16, 6)], # 대전시
[(13, 5), (14, 5)], # 세종시
[(21, 2), (21, 3), (22, 3), (22, 4), (24, 4), (24, 2), (21, 2)], # 광주
[(20, 5), (21, 5), (21, 6), (23, 6)], # 전라남도
[(10, 8), (12, 8), (12, 9), (14, 9), (14, 8), (16, 8), (16, 6)], # 충청북도
[(14, 9), (14, 11), (14, 12), (13, 12), (13, 13)], # 경상북도
[(15, 8), (17, 8), (17, 10), (16, 10), (16, 11), (14, 11)], # 대구
[(17, 9), (18, 9), (18, 8), (19, 8), (19, 9), (20, 9), (20, 10), (21, 10)], # 부산
[(16, 11), (16, 13)],
[(27, 5), (27, 6), (25, 6)]
]def plot_text_simple(draw_korea):
for idx, row in draw_korea.iterrows():
if len(row["ID"].split()) == 2:
dispname = "{}\n{}".format(row["ID"].split()[0], row["ID"].split()[1])
elif row["ID"][:2] == "고성":
dispname = "고성"
else:
dispname = row["ID"]
if len(dispname.splitlines()[-1]) >= 3:
fontsize, linespacing = 9.5, 1.5
else:
fontsize, linespacing = 11, 1.2
plt.annotate(
dispname,
(row["x"] + 0.5, row["y"] + 0.5),
weight="bold",
fontsize=fontsize,
linespacing=linespacing,
ha="center", # Align horizontally
va="center", # Align vertically
)def simpleDraw(draw_korea):
plt.figure(figsize=(8, 11))
plot_text_simple(draw_korea)
for path in BORDER_LINES:
ys, xs = zip(*path)
plt.plot(xs, ys, c="black", lw=1.5)
plt.gca().invert_yaxis()
plt.axis("off")
plt.tight_layout()
plt.show()
simpleDraw(draw_korea)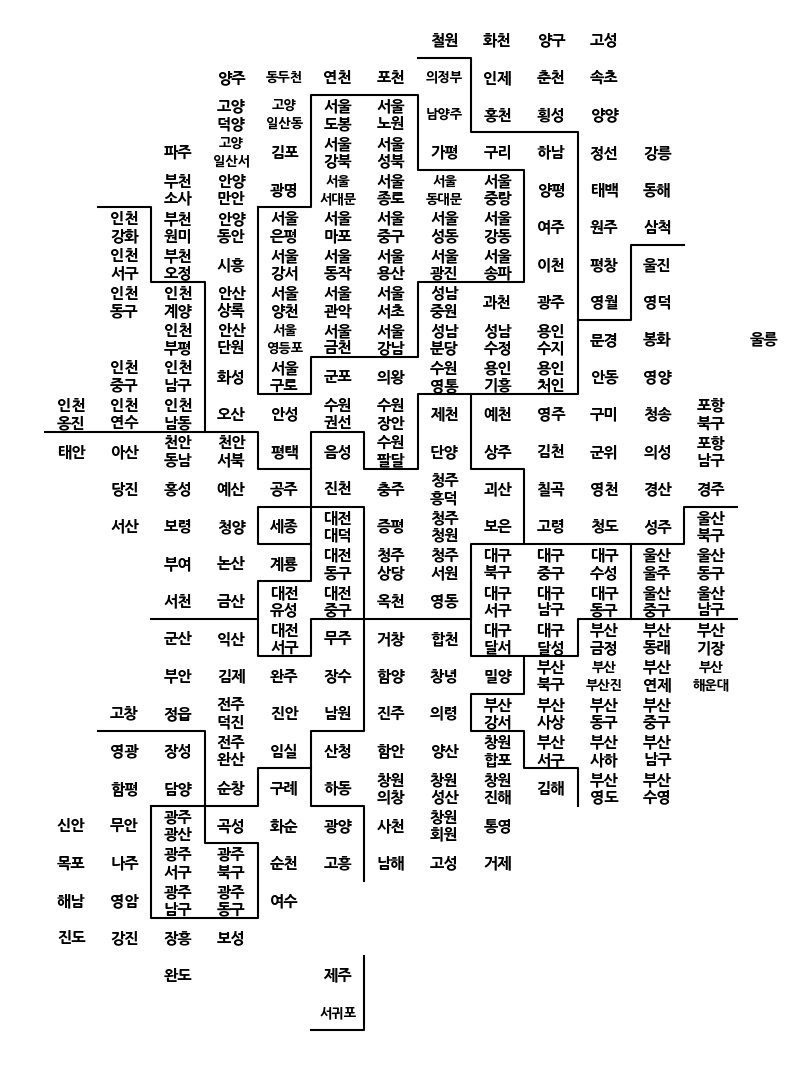
Validation
set(draw_korea["ID"].unique()) - set(pop["ID"].unique())

set(pop["ID"].unique()) - set(draw_korea["ID"].unique())

tmp_list = list(set(pop["ID"].unique()) - set(draw_korea["ID"].unique()))

for tmp in tmp_list:
    pop = pop.drop(pop[pop["ID"] == tmp].index)
print(set(pop["ID"].unique()) - set(draw_korea["ID"].unique()))
Merge
pop = pd.merge(pop, draw_korea, how="left", on="ID")
pop.head()
Function to get data to draw the map
- Set white to show min
- blockedMap: pop
- targetData: column to show on the map
def get_data_info(targetData, blockedMap):
    whitelabelmin = (
        max(blockedMap[targetData]) - min(blockedMap[targetData])
    ) * 0.25 + min(blockedMap[targetData])
    vmin = min(blockedMap[targetData])
    vmax = max(blockedMap[targetData])

    mapdata = blockedMap.pivot_table(index="y", columns="x", values=targetData)

    return mapdata, vmax, vmin, whitelabelmin
def get_data_info_for_zero_center(targetData, blockedMap):
whitelabelmin = 5
tmp_max = max(
np.abs(min(blockedMap[targetData])), np.abs(max(blockedMap[targetData]))
)
vmin, vmax = -tmp_max, tmp_max
mapdata = blockedMap.pivot_table(index="y", columns="x", values=targetData)
return mapdata, vmax, vmin, whitelabelmindef plot_text(targetData, blockedMap, whitelabelmin):
for idx, row in blockedMap.iterrows():
if len(row["ID"].split()) == 2:
dispname = "{}\n{}".format(row["ID"].split()[0], row["ID"].split()[1])
elif row["ID"][:2] == "고성":
dispname = "고성"
else:
dispname = row["ID"]
if len(dispname.splitlines()[-1]) >= 3:
fontsize, linespacing = 9.5, 1.5
else:
fontsize, linespacing = 11, 1.2
annocolor = "white" if np.abs(row[targetData]) > whitelabelmin else "black"
plt.annotate(
dispname,
(row["x"] + 0.5, row["y"] + 0.5),
weight="bold",
color=annocolor,
fontsize=fontsize,
linespacing=linespacing,
ha="center", # Align horizontally
va="center", # Align vertically
)def drawKorea(targetData, blockedMap, cmapname, zeroCenter=False):
if zeroCenter:
masked_mapdata, vmax, vmin, whitelabelmin = get_data_info_for_zero_center(targetData, blockedMap)
if not zeroCenter:
masked_mapdata, vmax, vmin, whitelabelmin = get_data_info(targetData, blockedMap)
plt.figure(figsize=(8, 11))
plt.pcolor(masked_mapdata, vmin=vmin, vmax=vmax, cmap=cmapname, edgecolor="#aaaaaa", linewidth=0.5)
plot_text(targetData, blockedMap, whitelabelmin)
for path in BORDER_LINES:
ys, xs = zip(*path)
plt.plot(xs, ys, c="black", lw=1.5)
plt.gca().invert_yaxis()
plt.axis("off")
plt.tight_layout()
cb = plt.colorbar(shrink=0.1, aspect=10)
cb.set_label(targetData)
plt.show()Draw the maps
drawKorea("인구수합계", pop, "Blues")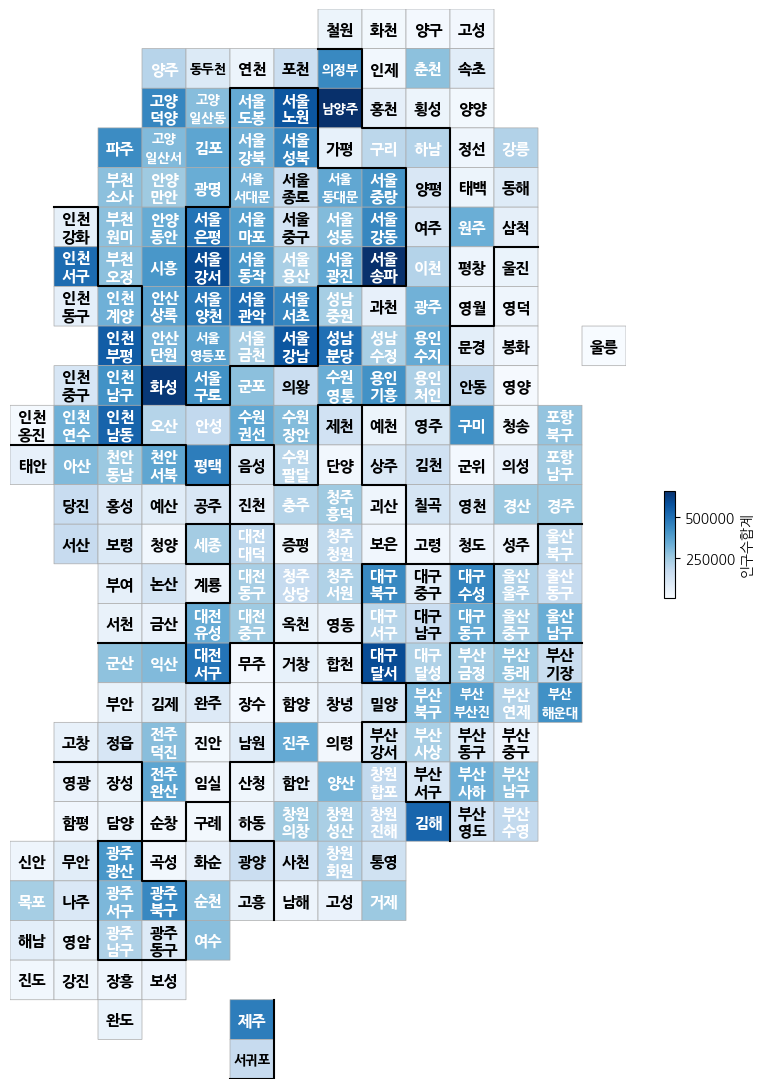
pop["Depopulation area"] = [1 if con else 0 for con in pop["Depopulation area"]]
drawKorea("Depopulation area", pop, "Reds")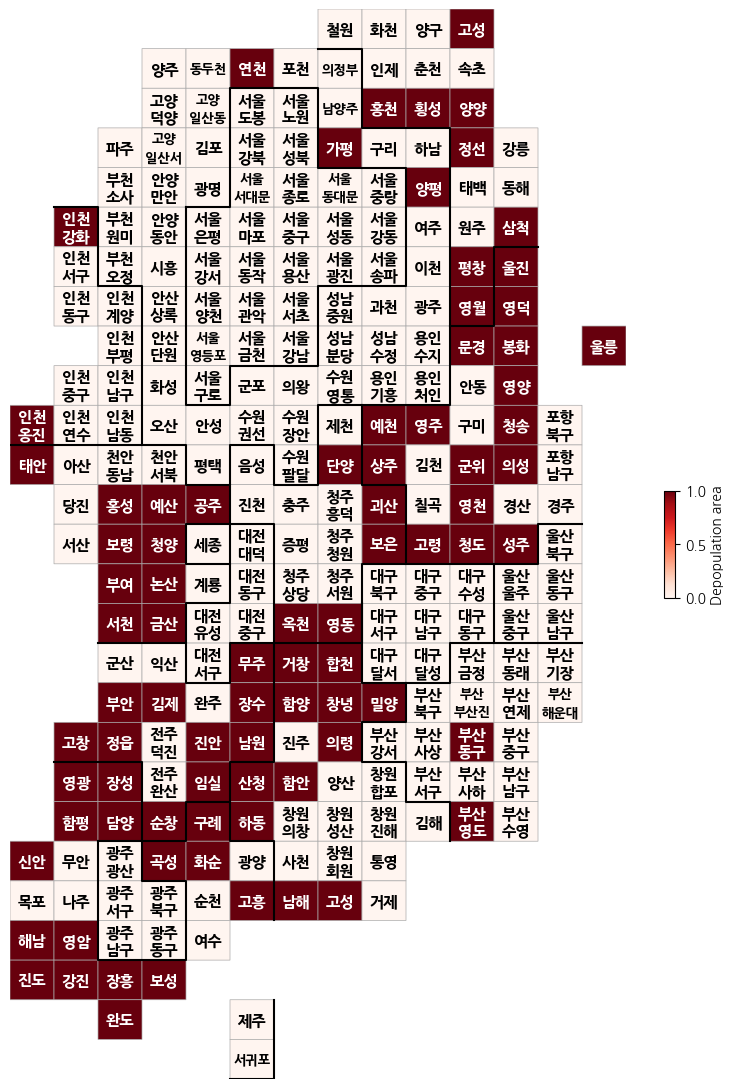
pop["Female ratio"] = (pop["인구수여자"] / pop["인구수합계"] - 0.5) * 100
drawKorea("Female ratio", pop, "RdBu", zeroCenter=True)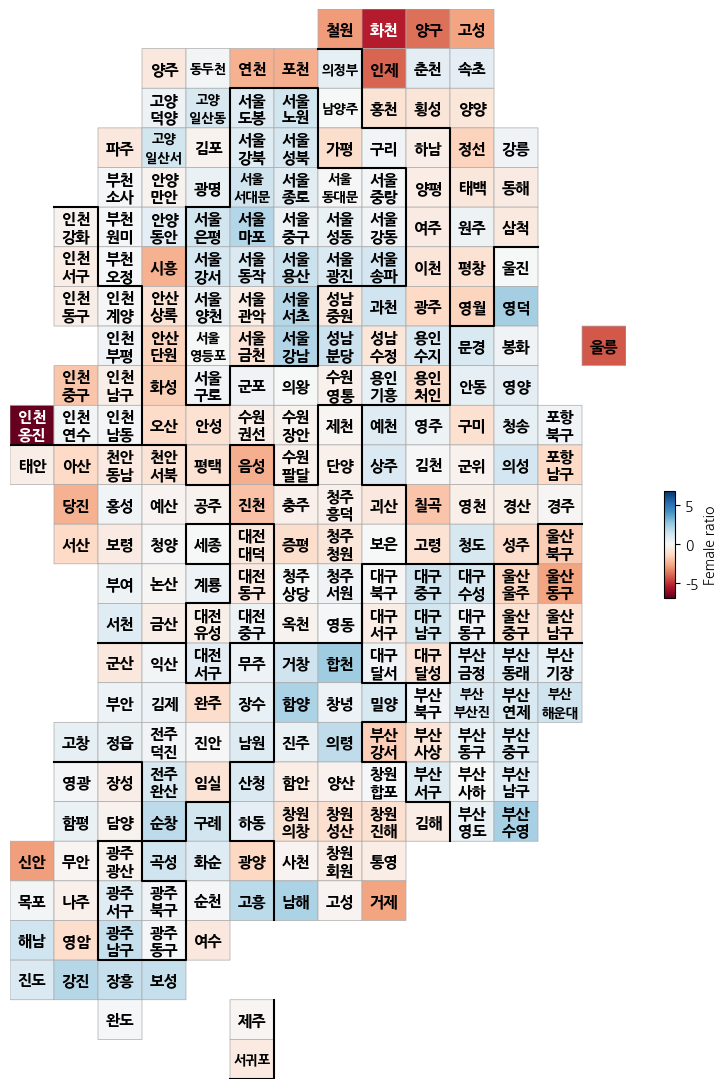
pop["20-39 Female ratio"] = (pop["Age 20-39여자"] / pop["Age 20-39합계"] - 0.5) * 100
drawKorea("20-39 Female ratio", pop, "RdBu", zeroCenter=True)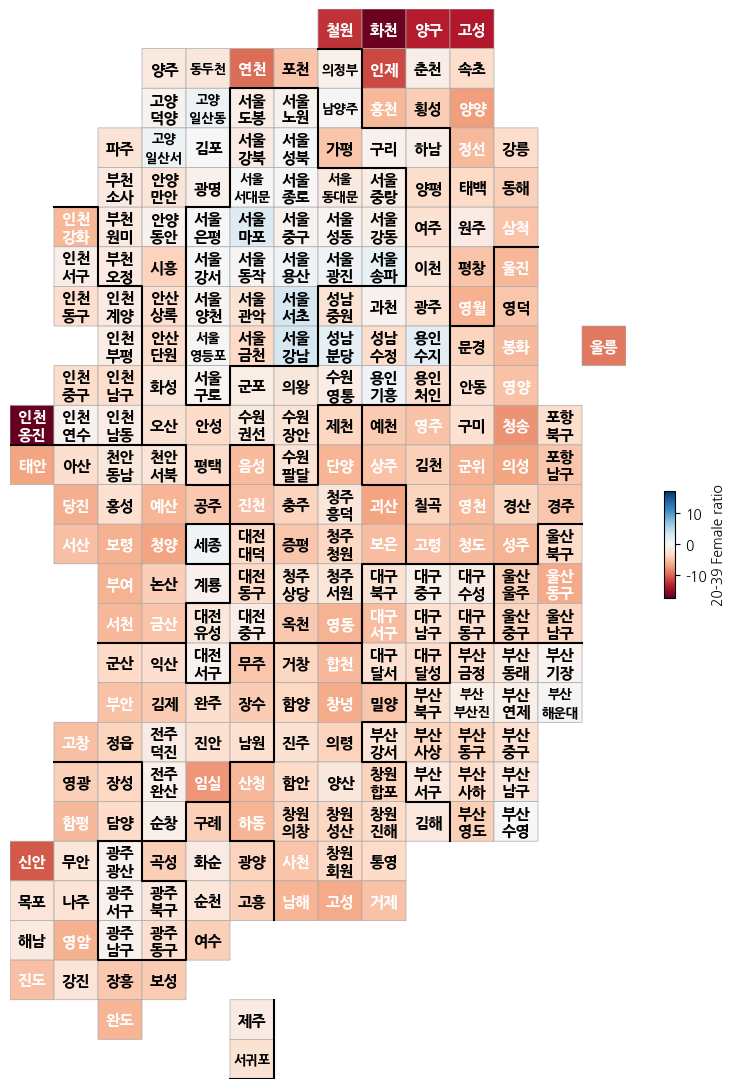
5. Draw the map (geographic)
import folium
import json

pop_folium = pop.set_index("ID")
pop_folium.head()
geo_path = "../data/07_skorea_municipalities_geo_simple.json"
geo_str = json.load(open(geo_path, encoding="utf-8"))
mymap = folium.Map(location=[36.2002, 127.054], zoom_start=7)
mymap.choropleth(
geo_data=geo_str,
data=pop_folium["인구수합계"],
key_on="feature.id",
columns=[pop_folium.index, pop_folium["인구수합계"]],
fill_color="YlGnBu"
)
mymap# Visualization of depopulation areas
mymap = folium.Map(location=[36.2002, 127.054], zoom_start=7)
mymap.choropleth(
geo_data=geo_str,
data=pop_folium["Depopulation area"],
key_on="feature.id",
columns=[pop_folium.index, pop_folium["Depopulation area"]],
fill_color="PuRd"
)
mymapSave data
# Save data
draw_korea.to_csv("../data/07_draw_korea.csv", encoding="utf-8", sep=",")
데이터 분석 공부하고 있습니다