
6주차: 6/5/2023 - 6/11/2023
- Are self gas stations really cheaper?
Get data
- https://www.opinet.co.kr/searRgSelect.do
- Check the website structure
- Target data
- Brand
- Price
- Self
- Location
Use Selenium
from selenium import webdriver

from selenium.webdriver.common.by import By
from selenium.webdriver.chrome.service import Service
from webdriver_manager.chrome import ChromeDriverManager

url = "https://www.opinet.co.kr/searRgSelect.do"
driver = webdriver.Chrome(service=Service(ChromeDriverManager().install()))
driver.get(url)
import time
def main_get():
# Access the page
url = "https://www.opinet.co.kr/searRgSelect.do"
driver = webdriver.Chrome(service=Service(ChromeDriverManager().install()))
driver.get(url)
time.sleep(3)
main_get()# Area: City/Province
sido_list_raw = driver.find_element(By.ID, 'SIDO_NM0')
sido_list_raw.text
len(sido_list_raw.find_elements(By.TAG_NAME, 'option'))
sido_list = sido_list_raw.find_elements(By.TAG_NAME, 'option')
len(sido_list), sido_list[1].text
sido_list[1].get_attribute("value")# 1.
sido_names = []
for option in sido_list:
sido_names.append(option.get_attribute("value"))
sido_names
# 2.
sido_names = [option.get_attribute("value") for option in sido_list]
sido_names[:5]
sido_names = sido_names[1:]
sido_names
sido_names[0]# District
gu_list_raw = driver.find_element(By.ID, 'SIGUNGU_NM0') # parent element
gu_list = gu_list_raw.find_elements(By.TAG_NAME, 'option') # child element
gu_names = [option.get_attribute("value") for option in gu_list]
gu_names = gu_names[1:]
gu_names[:5], len(gu_names)
gu_list_raw.send_keys(gu_names[15])# Save as excel
driver.find_element(By.CSS_SELECTOR, '#glopopd_excel').click()
driver.find_element(By.XPATH, '//*[@id="glopopd_excel"]').click()
element_get_excel = driver.find_element(By.ID, 'glopopd_excel')
element_get_excel.click()import time
from tqdm import tqdm_notebook
for gu in tqdm_notebook(gu_names):
element = driver.find_element(By.ID, 'SIGUNGU_NM0')
element.send_keys(gu)
time.sleep(3)
element_get_excel = driver.find_element(By.XPATH, '//*[@id="glopopd_excel"]').click()
time.sleep(3)Data cleaning
import pandas as pd
from glob import glob

# Bring the file list
glob("../data/지역_*.xls")

# Save file names
stations_files = glob("../data/지역_*.xls")
stations_files[:5]

# Read one file
tmp = pd.read_excel(stations_files[0], header=2)
tmp.tail(2)

tmp_raw = []

for file_name in stations_files:
    tmp = pd.read_excel(file_name, header=2)
tmp_raw.append(tmp)- concat: use when the files with identical format need to be merged
stations_raw = pd.concat(tmp_raw)
stations_raw

stations = pd.DataFrame({
    "Station Name": stations_raw["상호"],
    "Address": stations_raw["주소"],
    "Price": stations_raw["휘발유"],
    "Self": stations_raw["셀프여부"],
    "Brand": stations_raw["상표"]
})
stations.tail()

for eachAddress in stations["Address"]:
    print(eachAddress.split()[1])

stations["District"] = [eachAddress.split()[1] for eachAddress in stations["Address"]]
stations

stations["District"].unique(), len(stations["District"].unique())
# Stations with no price info
stations[stations["Price"] == "-"]
# Use only stations with price info
stations = stations[stations["Price"] != "-"]
stations.tail()
# Typecast price data
stations["Price"] = stations["Price"].astype("float")# Reset index
stations.reset_index(inplace=True)
stations.tail()
# del stations["index"]
# del stations["level_0"]
stations.head()Gas price visualization
import matplotlib.pyplot as plt
import seaborn as sns
import platform
from matplotlib import font_manager, rc

get_ipython().run_line_magic("matplotlib", "inline")

path = "C:/Windows/Fonts/malgun.ttf"

if platform.system() == "Darwin":
    rc("font", family="Arial Unicode MS")
elif platform.system() == "Windows":
    font_name = font_manager.FontProperties(fname=path).get_name()
    rc("font", family=font_name)
else:
    print("Unknown system")
# boxplot with pandas
stations.boxplot(column="Price", by="Self", figsize=(12, 8));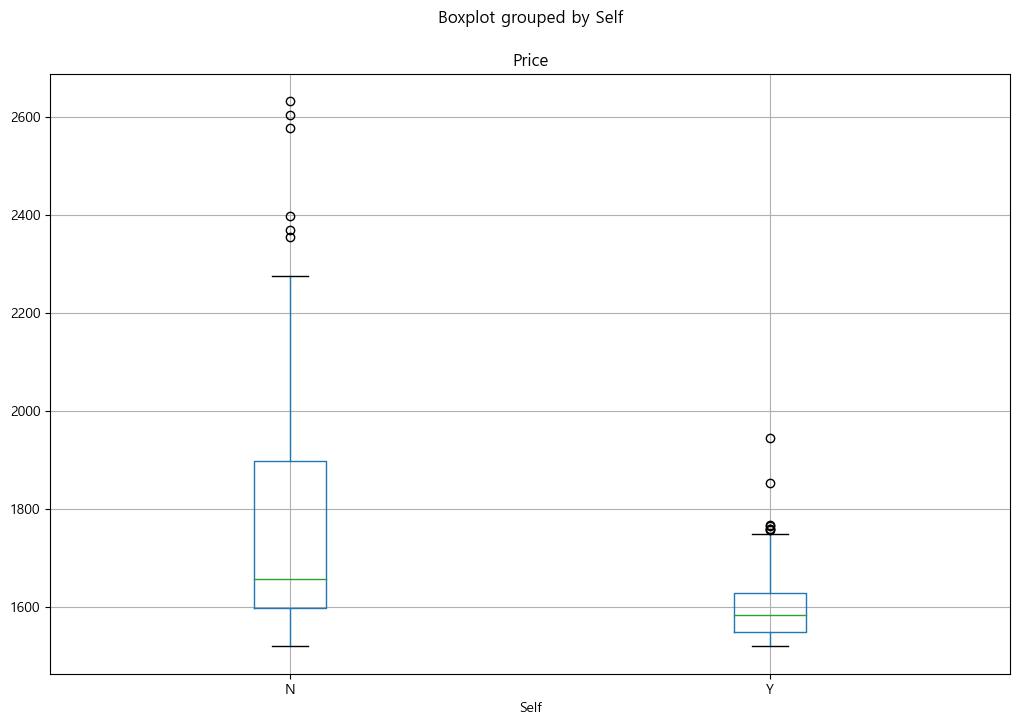
# boxplot with seaborn

plt.figure(figsize=(12, 8))
sns.boxplot(x="Self", y="Price", data=stations, palette="Set3")
plt.grid(True)
plt.show()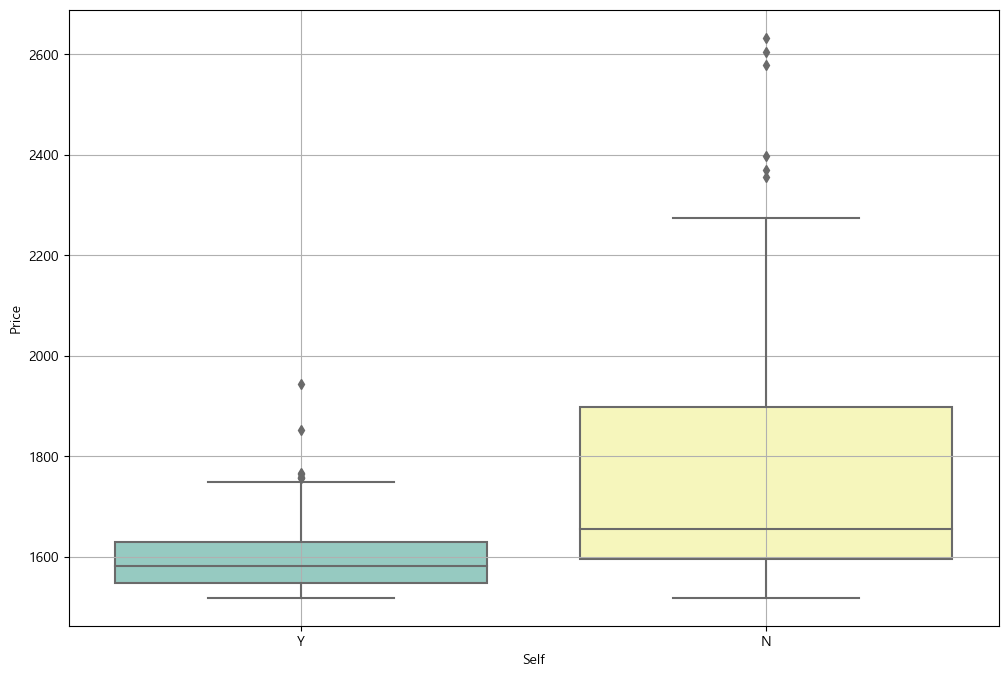
# boxplot with seaborn

plt.figure(figsize=(12, 8))
sns.boxplot(x="Brand", y="Price", hue="Self", data=stations, palette="Set3")
plt.grid(True)
plt.show()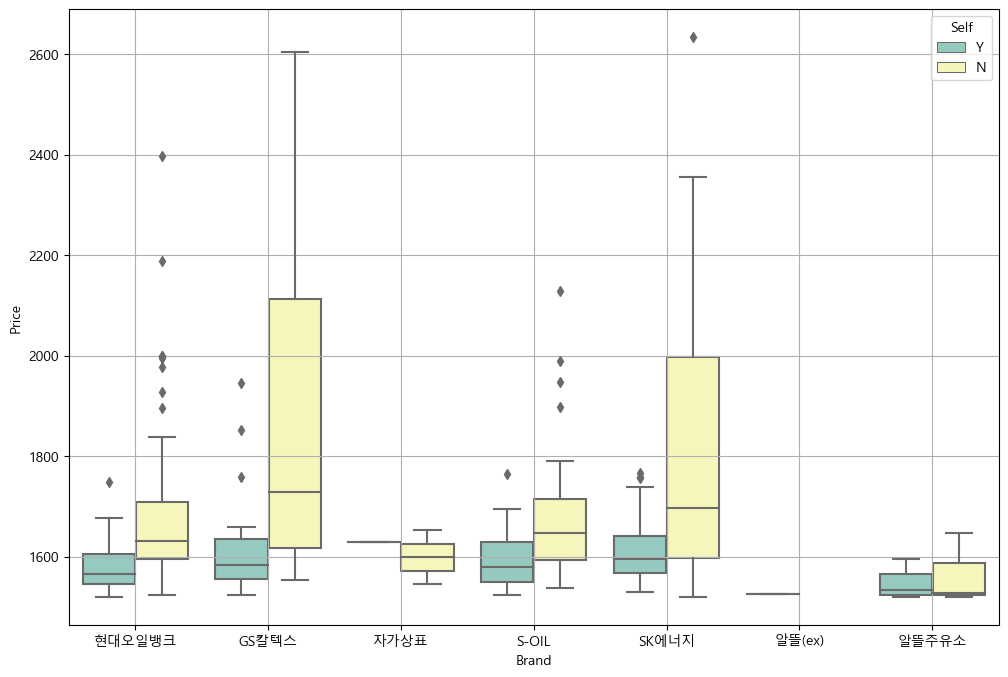
Map visualization
import json
import folium
import warnings
warnings.simplefilter(action="ignore", category=FutureWarning)
import numpy as np
gu_data = pd.pivot_table(
data=stations,
index="District",
values="Price",
aggfunc=np.mean
)
gu_data.head()geo_path = "../data/02. skorea_municipalities_geo_simple.json"
geo_str = json.load(open(geo_path, encoding="utf-8"))
my_map = folium.Map(location=[37.5502, 126.982], zoom_start=10.5, tiles="Stamen Toner")
my_map.choropleth(
geo_data=geo_str,
data=gu_data,
columns=[gu_data.index, "Price"],
key_on="feature.id",
fill_color="PuRd"
)
my_map
데이터 분석 공부하고 있습니다