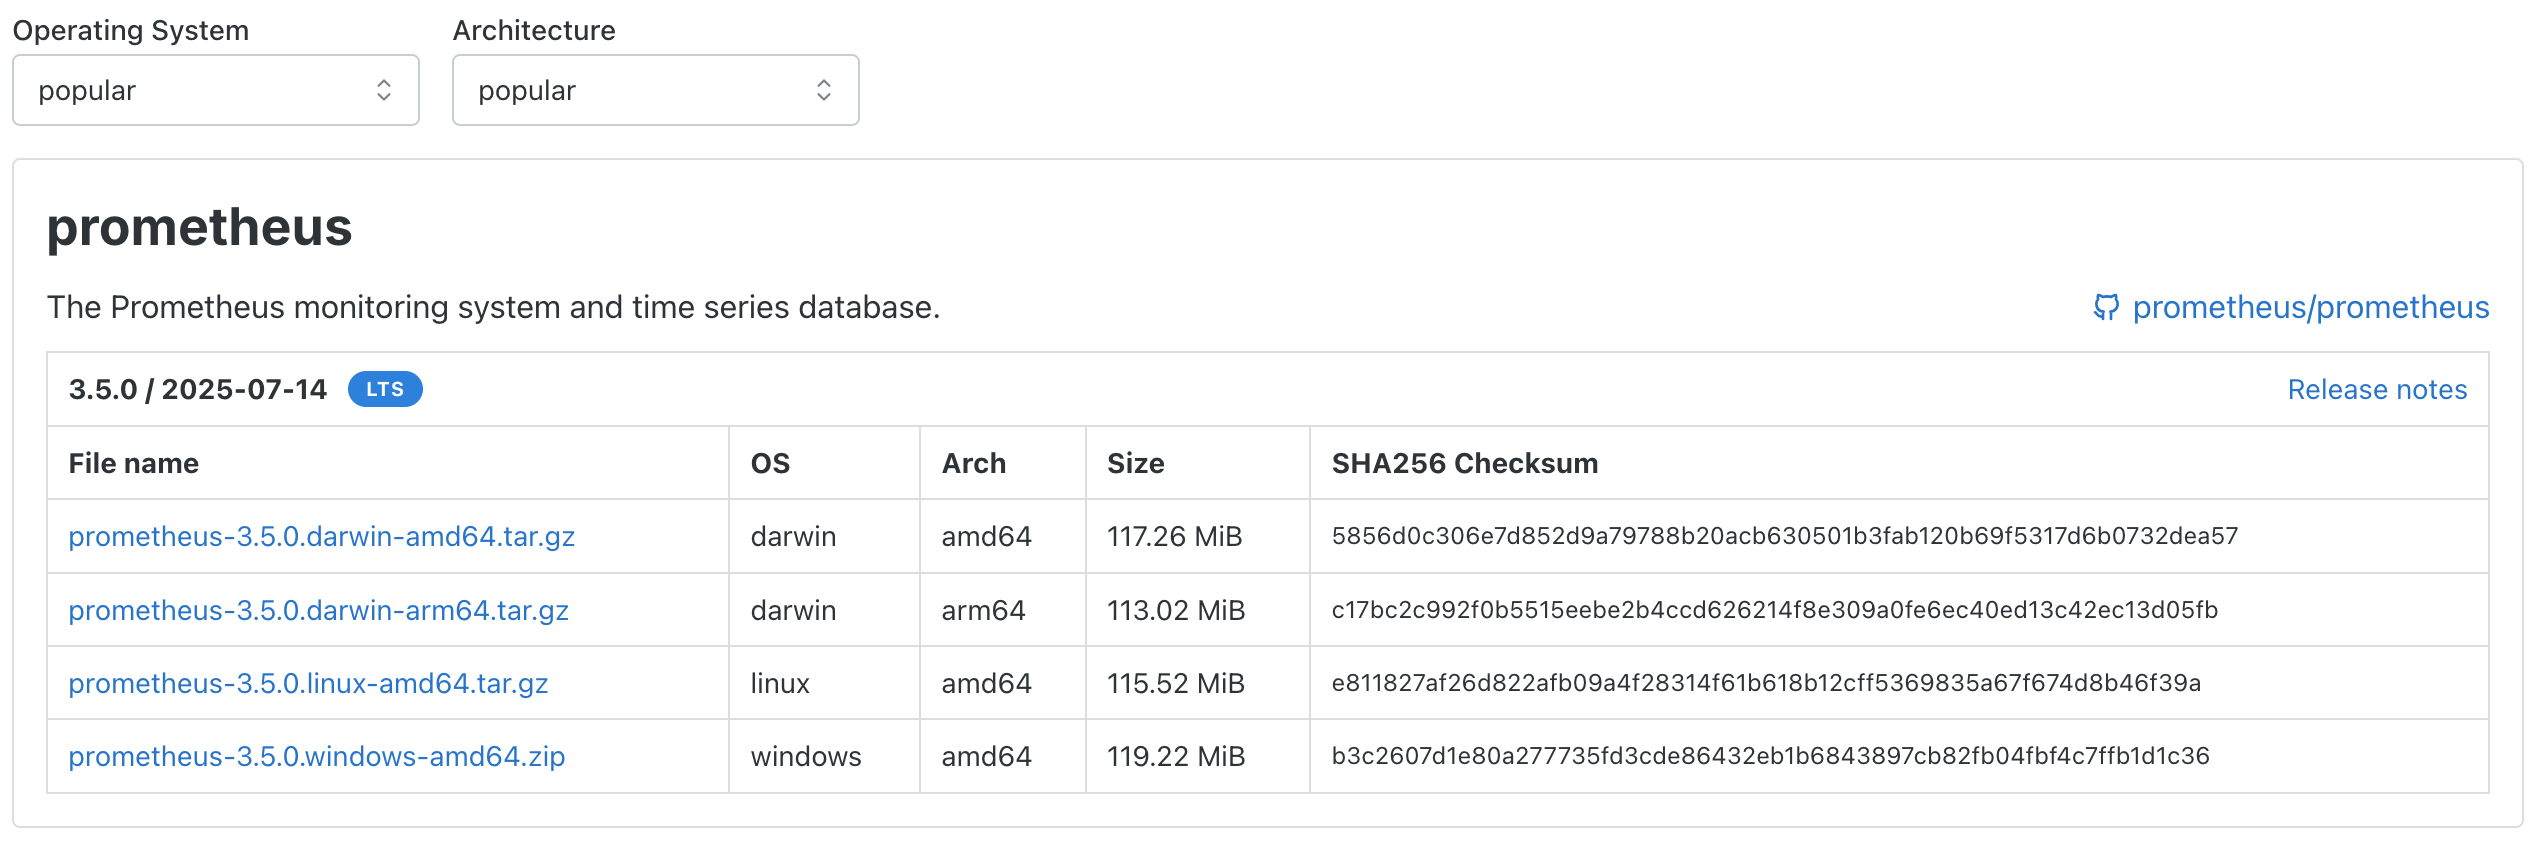
1. 최신 버전의 프로메테우스 다운
https://prometheus.io/download/
>> uname -m
x86_64
흠... x86_64이니까...Intel amd64을 선택
>> tar xvfz prometheus-*.tar.gz
>> cd prometheus-3.5.0.darwin-amd64
>> ls
LICENSE		NOTICE		prometheus	prometheus.yml	promtool
2. prometheus.yml 수정
global:
  scrape_interval: 15s # By default, scrape targets every 15 seconds.

  # Attach these labels to any time series or alerts when communicating with
  # external systems (federation, remote storage, Alertmanager).
  external_labels:
    monitor: 'codelab-monitor'

# A scrape configuration containing exactly one endpoint to scrape:
# Here it's Prometheus itself.
scrape_configs:
  # The job name is added as a label 'job=<job_name>' to any timeseries scrapped from this config.
  - job_name: 'prometheus'

    # Override the global default and scrape targets from this job every 5 seconds.
    scrape_interval: 5s

    static_configs:
      - targets: ['localhost:9090']
3. Prometheus 실행하기
디폴트로, Prometheus는 데이터베이스를 ./data (flag --storage.tsdb.path)에 저장한다.
./prometheus --config.file=prometheus.yml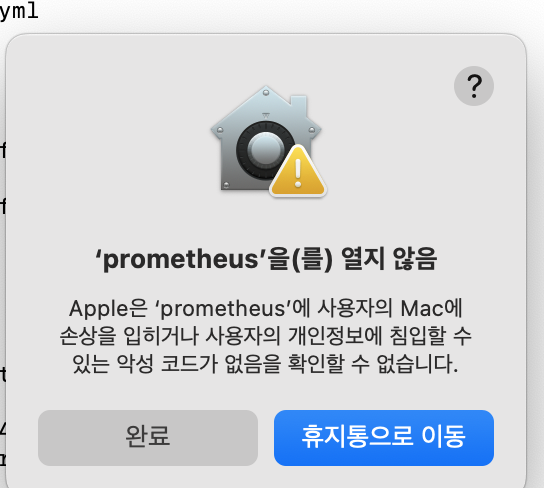
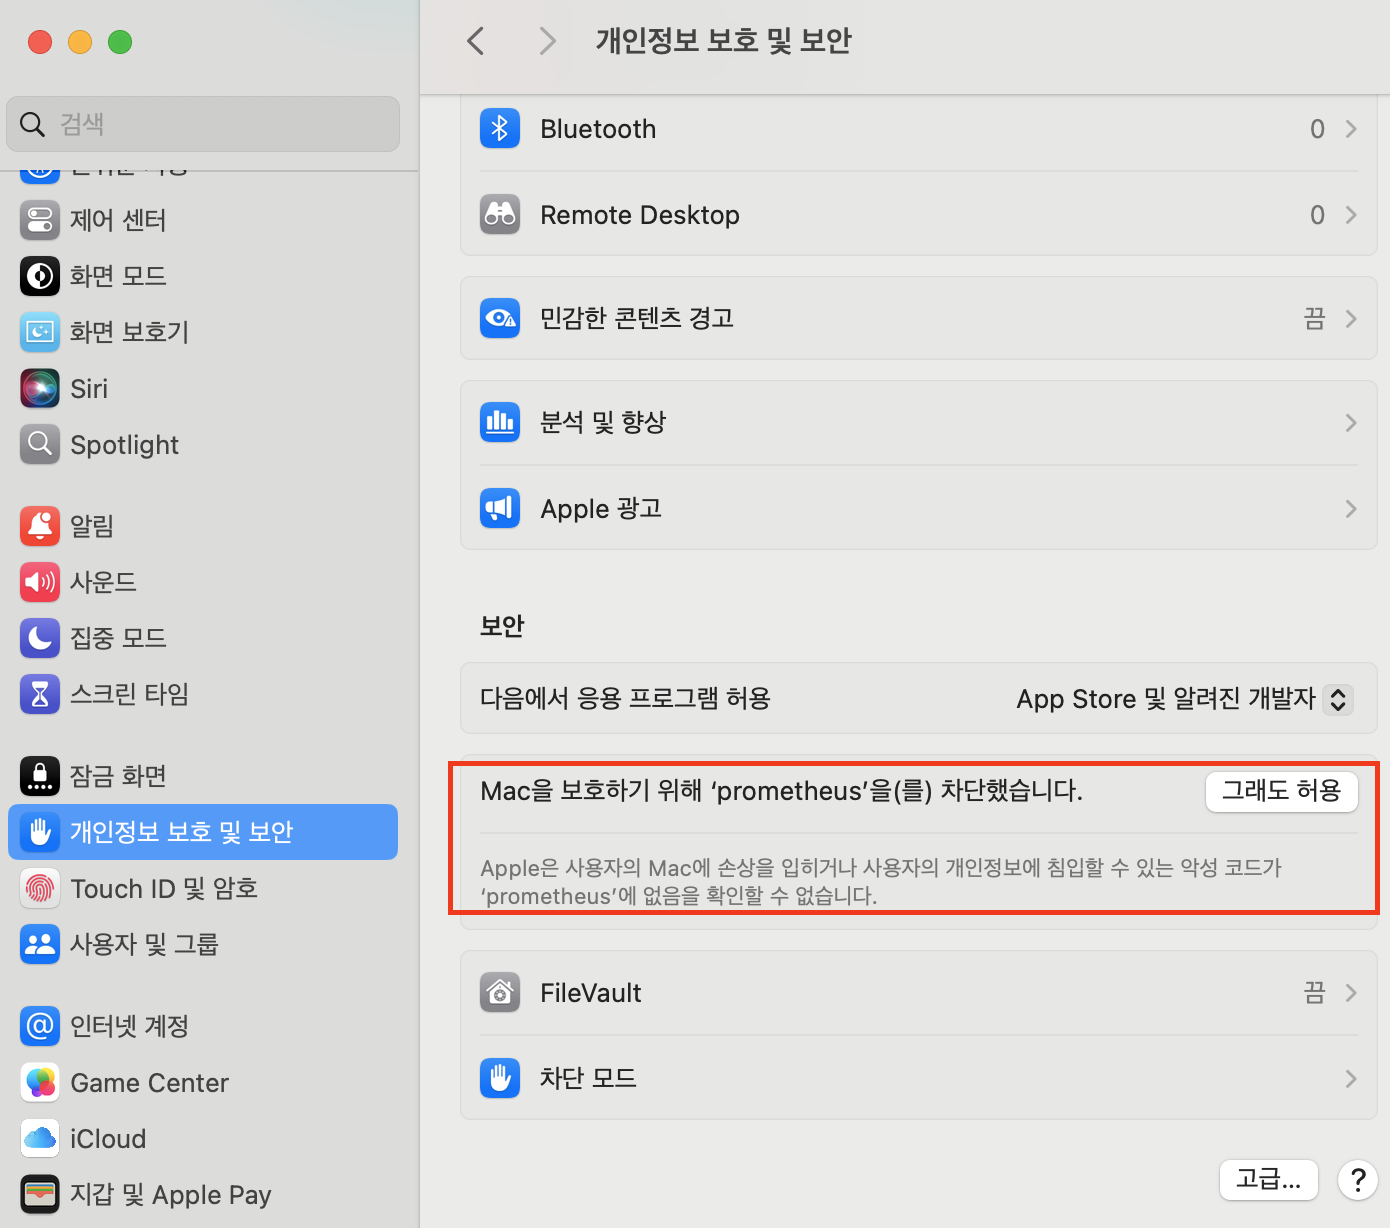
시스템 설정 -> 개인정보 보호 및 보안 -> 아래 스크롤
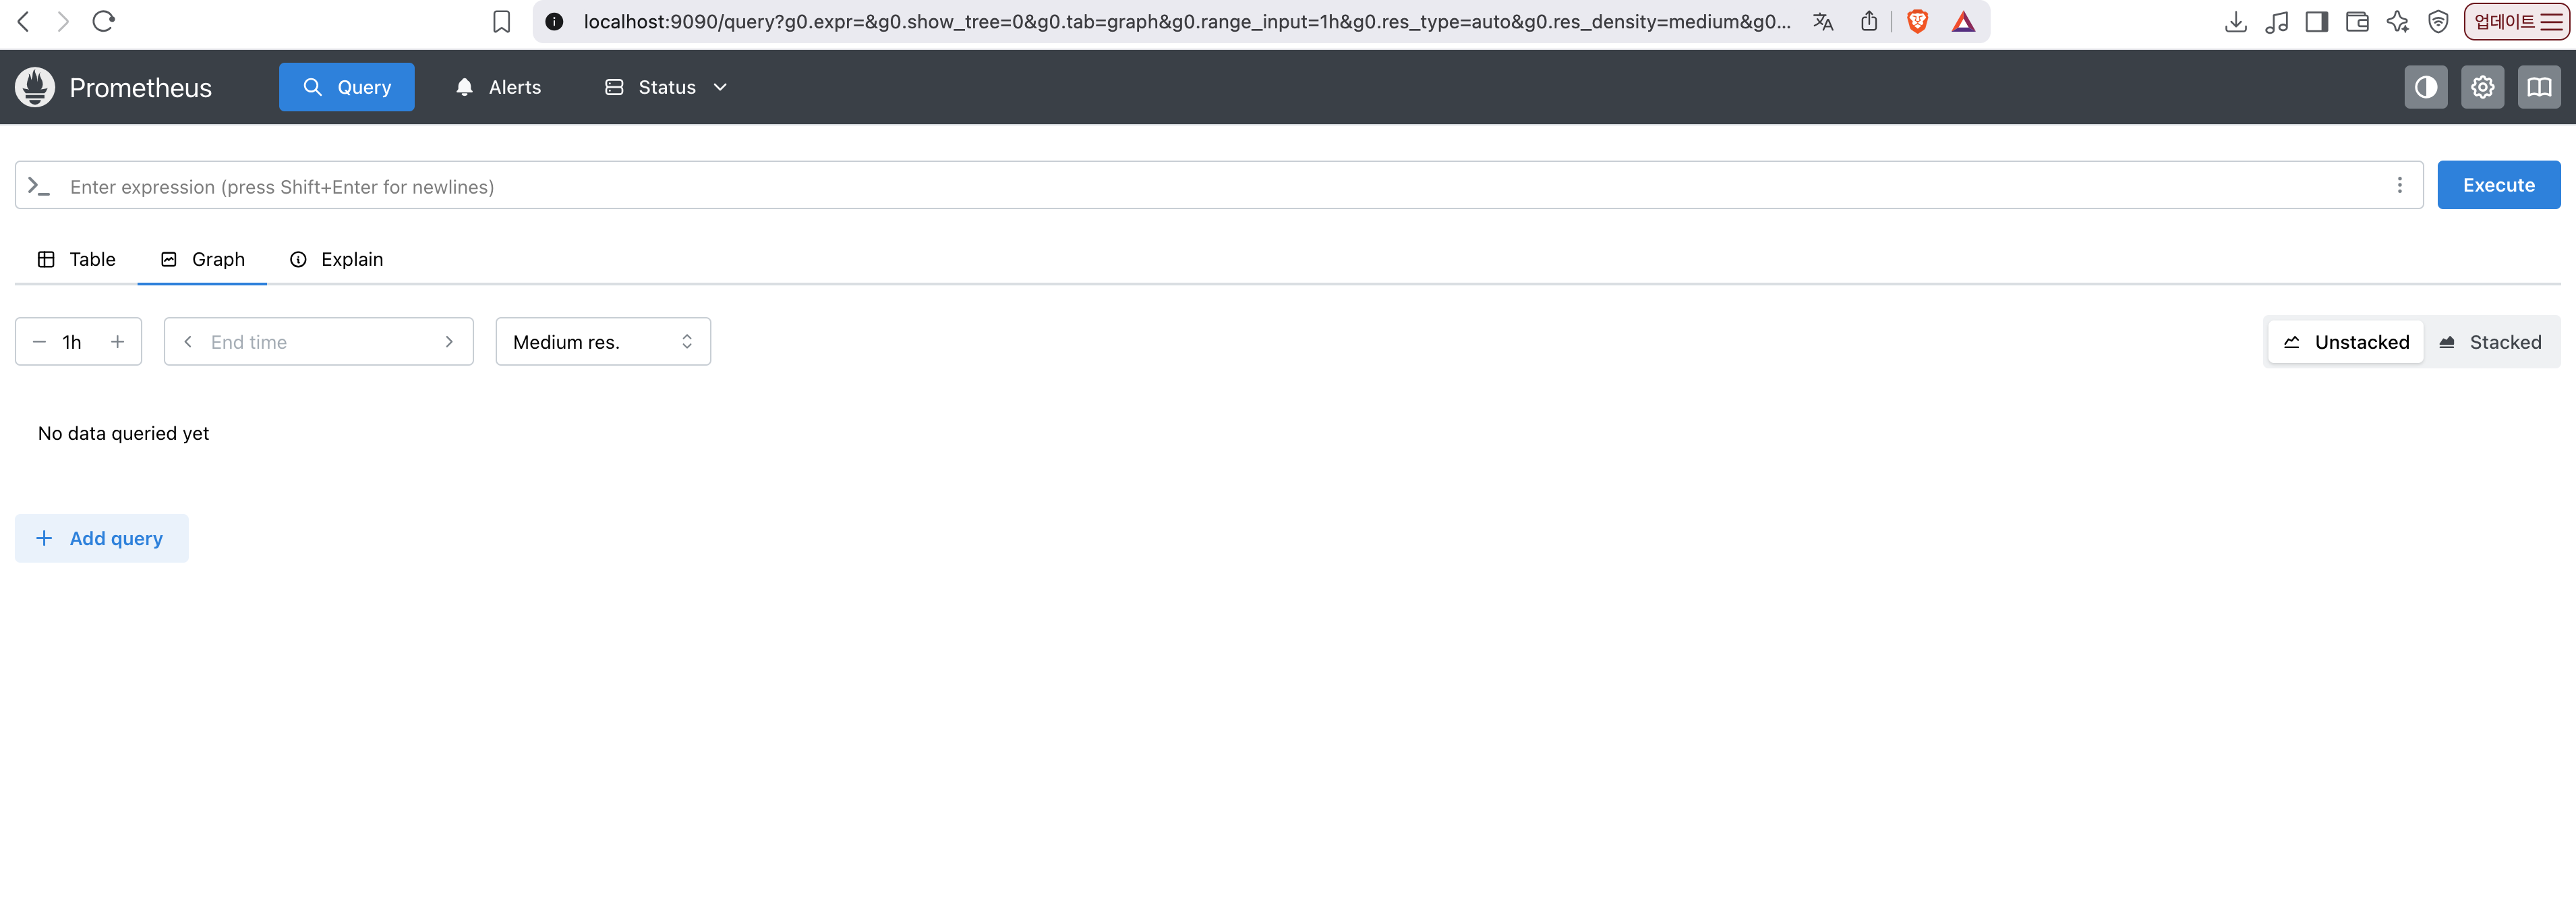
localhost:9090, localhost:9090/metrics 접속
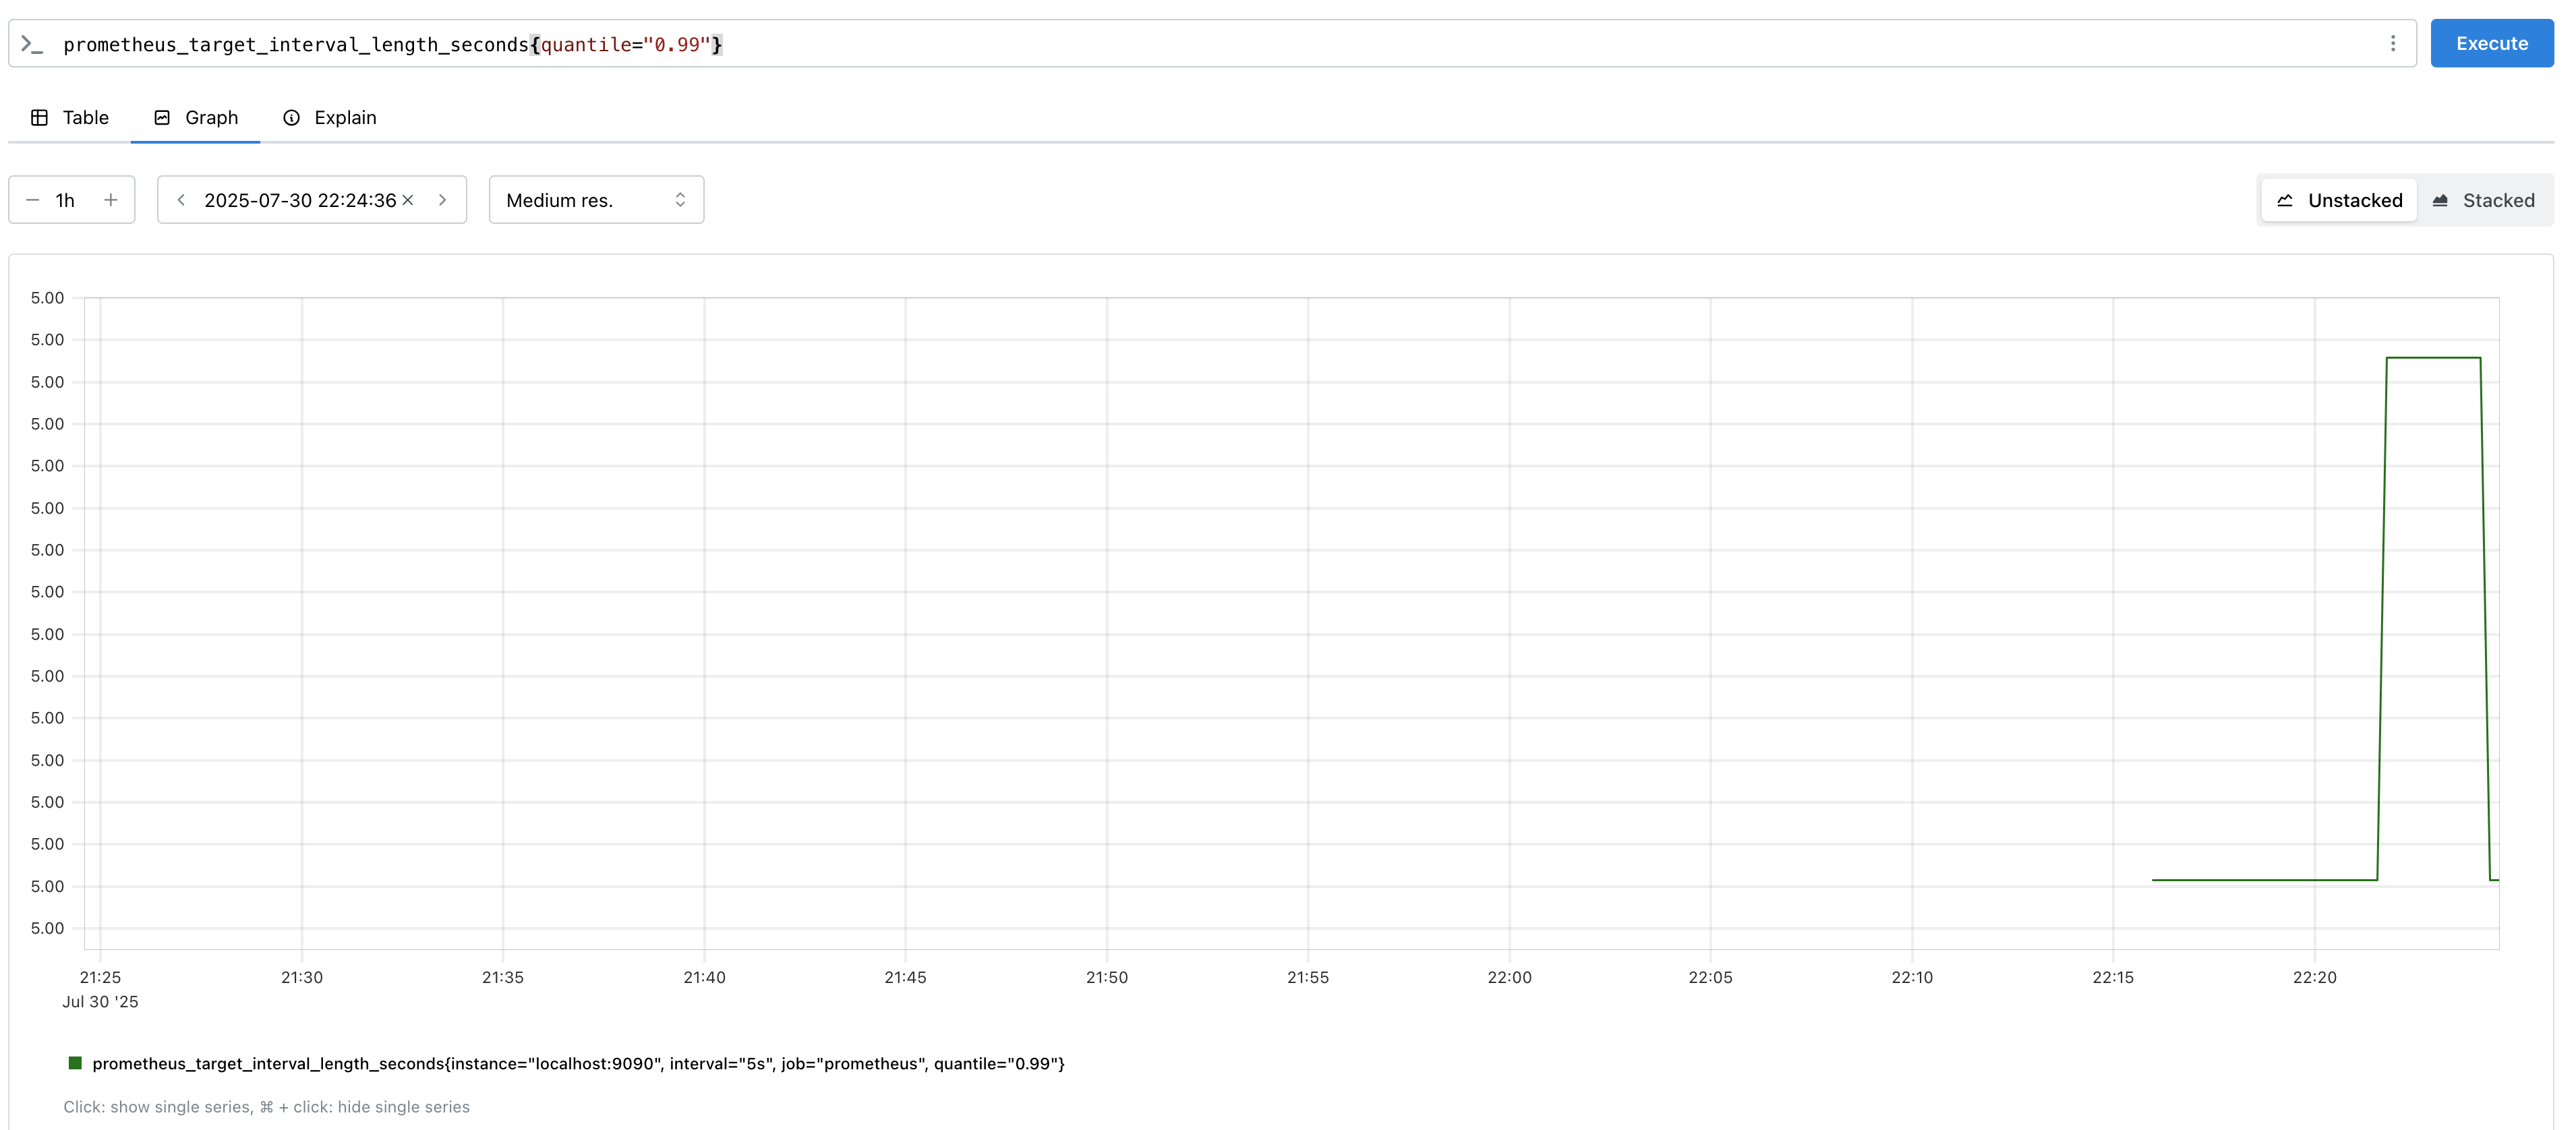
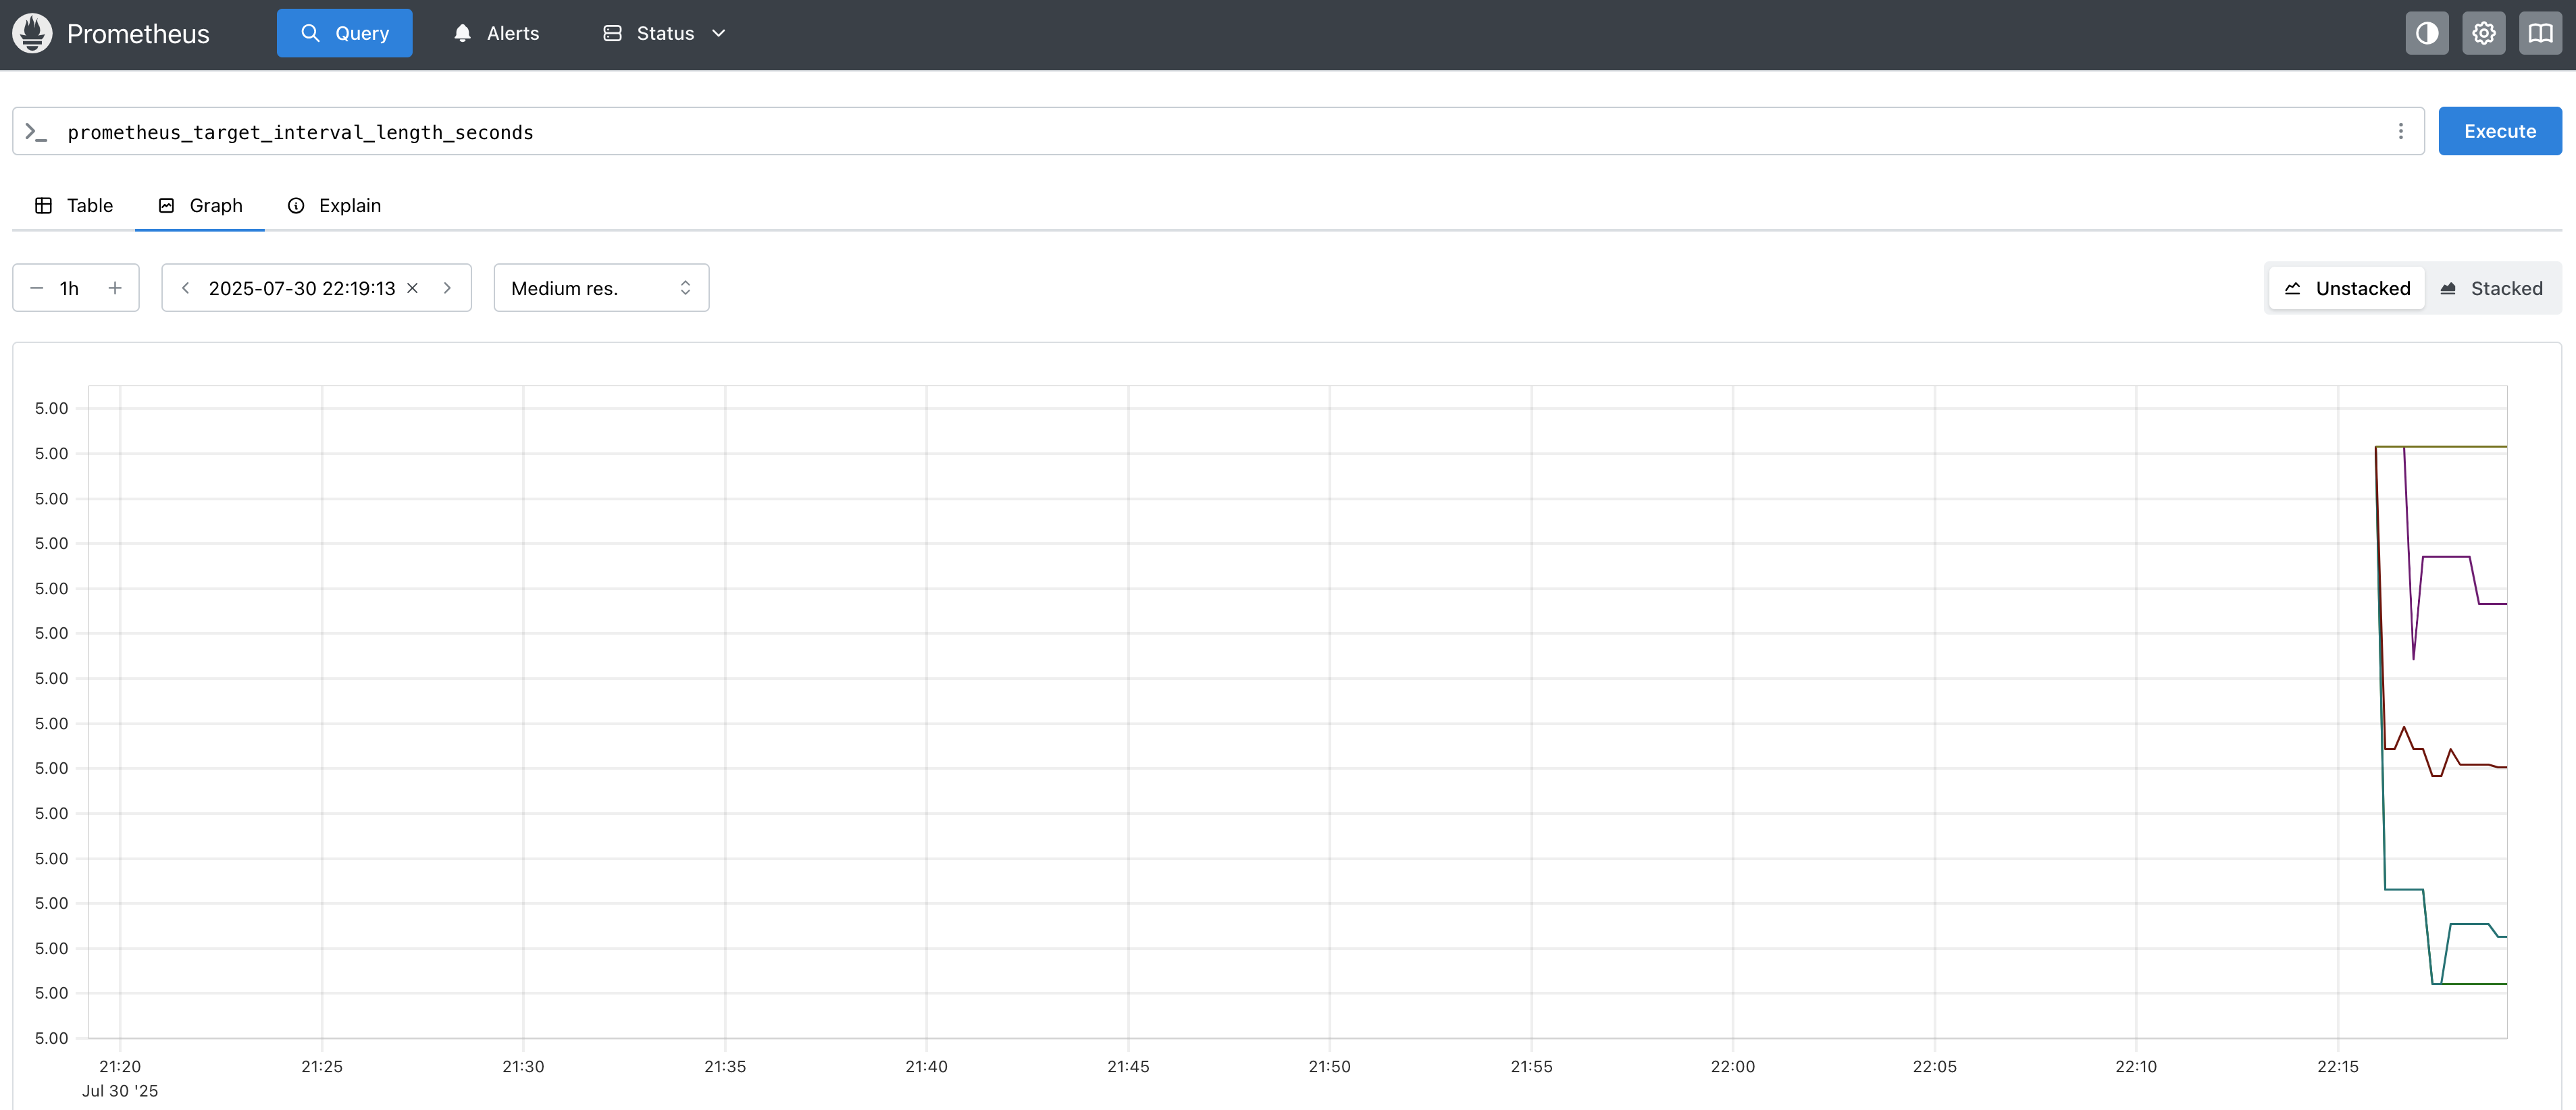
Prometheus가 자체적으로 내보내는 지표 중에 하나는 prometheus_target_interval_length_seconds 다.
쿼리로 조회해보자.
99번째 백분위(latency) 지연 시간에만 관심이 있다면