[diary #8] three feature visualize
😁START
I want visualize three features.
example data : titanic
purpose : Pclass, Survived, Sex
plt.figure(figsize=(12,5))
sns.barplot(x='Pclass',y='Survived', hue='Sex',data=titanic , estimator=np.mean) # data check
plt.show()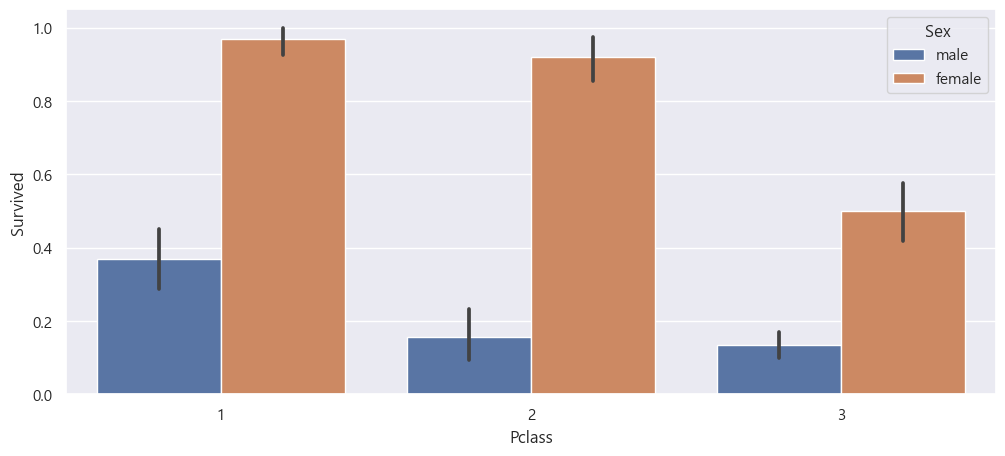
😂END
2022.11.26. first commit
chase free