
🔎 서울시 범죄 현황 분석
1. 서울시 범죄현황 데이터 시각화
import matplotlib.pyplot as plt
import seaborn as sns
from matplotlib import rc

plt.rcParams['axes.unicode_minus']=False
get_ipython().run_line_magic('matplotlib','inline')
rc('font',family='Malgun Gothic')

crime_anal_norm.head()| - | 강도 | 살인 | 강간 | 절도 | 폭력 | 강간검거율 | 강도검거율 | 살인검거율 | 절도검거율 | 폭력검거율 | 인구수 | CCTV | 범죄 | 검거 |
|---|---|---|---|---|---|---|---|---|---|---|---|---|---|---|
| 구별 | ||||||||||||||
| 강남구 | 1.000000 | 0.357143 | 1.000000 | 0.977118 | 0.733773 | 80.038760 | 100.000000 | 100.000000 | 53.470867 | 88.130935 | 534988 | 3238 | 0.813607 | 84.328112 |
| 강동구 | 0.358974 | 0.285714 | 0.310078 | 0.477799 | 0.463880 | 95.000000 | 92.857143 | 100.000000 | 51.425314 | 86.996047 | 464490 | 1010 | 0.379289 | 85.255701 |
| 강북구 | 0.128205 | 0.500000 | 0.420543 | 0.332879 | 0.509351 | 73.271889 | 80.000000 | 85.714286 | 54.991817 | 89.344852 | 298622 | 831 | 0.378196 | 76.664569 |
| 관악구 | 0.307692 | 0.428571 | 0.624031 | 0.572868 | 0.593143 | 81.987578 | 83.333333 | 100.000000 | 44.555397 | 83.678516 | 500750 | 2109 | 0.505261 | 78.710965 |
| 광진구 | 0.282051 | 0.285714 | 0.540698 | 0.718060 | 0.438577 | 83.870968 | 54.545455 | 100.000000 | 40.098634 | 84.071906 | 351073 | 878 | 0.453020 | 72.517393 |
# pairplot 강도, 살인, 폭력에 대한 상관관계 확인

sns.pairplot(data=crime_anal_norm, vars=['살인','강도','폭력'],kind='reg',height=3 )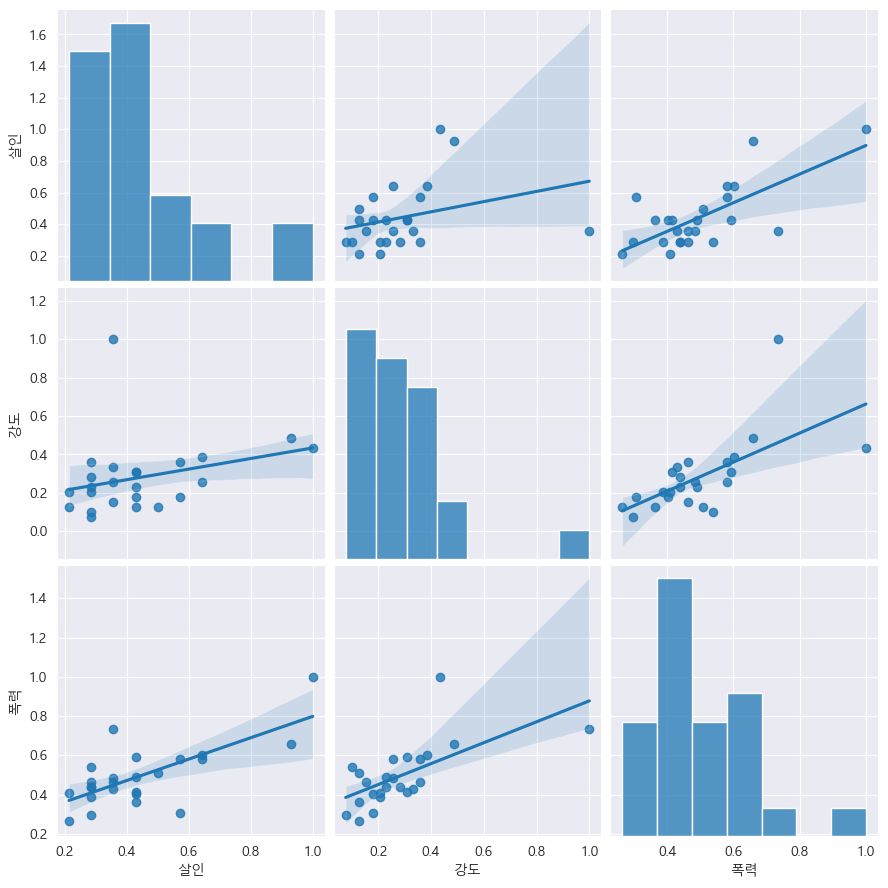
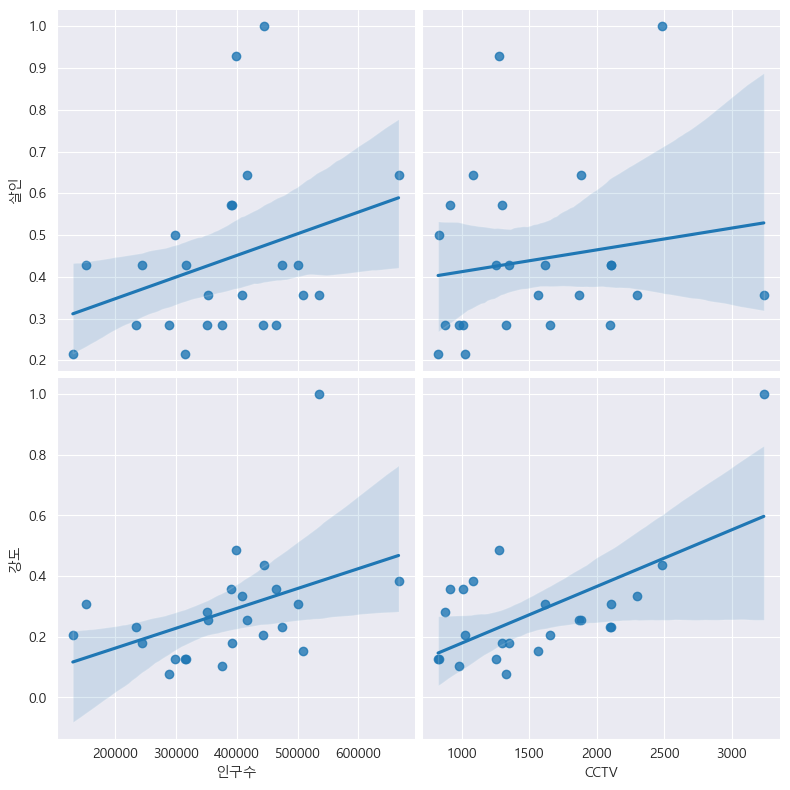
# '인구수', 'cctv' 와 '살인', '강도' 상관관계
def drawGraph():
    sns.pairplot(
        data=crime_anal_norm,
        x_vars=['인구수','CCTV'],
        y_vars=['살인','강도'],
        kind='reg',
        height=4
    )
    plt.show()

drawGraph()
#'인구수','cctv' 와 '실인검거율', '폭력검거율의 상관관계'
def drawGraph():
    sns.pairplot(
        data=crime_anal_norm,
        x_vars=['인구수','CCTV'],
        y_vars=['살인검거율','강도검거율'],
        kind='reg',
        height=4
    )
    plt.show()

drawGraph()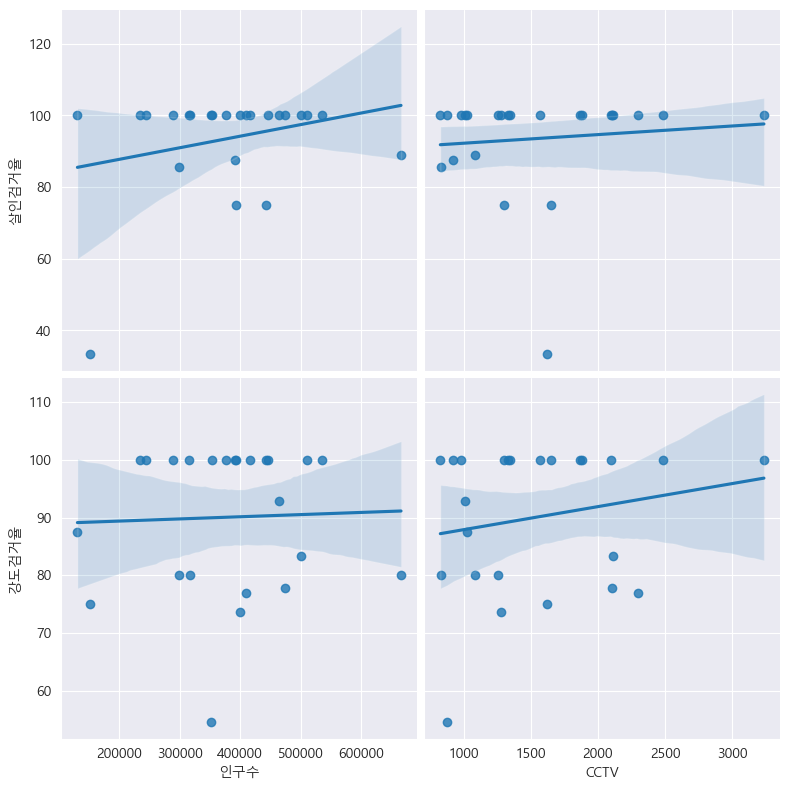
#검거율 heatmap
# '검거'라는 컬럼을 기준으로 정렬
# 위에서 삭제한 감가 컬럼 추가

def drawGraph():


    #데이터 프레임 생성
    target_col=['강간검거율','강도검거율','살인검거율','절도검거율','폭력검거율','검거']
    crime_anal_norm_sort=crime_anal_norm.sort_values(by='검거',ascending=False)

    #그래프 설정
    plt.figure(figsize=(10,10))
    sns.heatmap(
        data=crime_anal_norm_sort[target_col],
        annot=True, #데이터값 표시
        fmt='f', #실수형
        linewidths=1, #간격설정
        cmap='RdPu'

    )
    plt.title('범죄 검거 비율(정규화된 검거의 합으로 정렬)')
    plt.show()

drawGraph()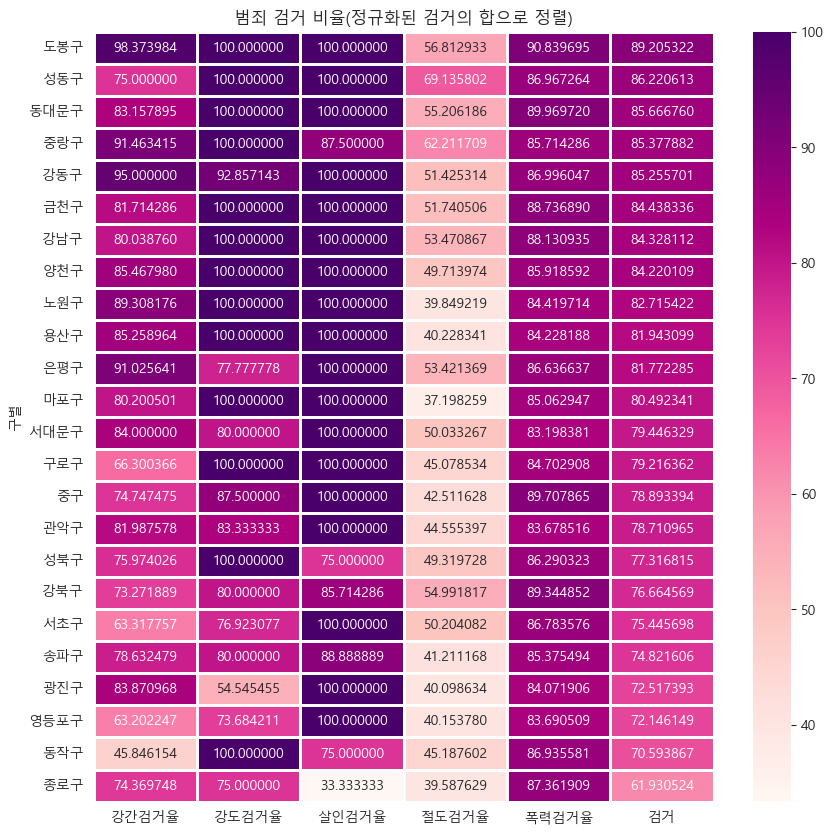
# 범죄발생 건수 heatmap
# 범죄 컬럼 기준 정렬

def drawGraph():
    #데이터 설정
    target_col=['살인','강도','강간','절도','폭력','범죄']
    crime_anal_norm_sort=crime_anal_norm[target_col].sort_values(by='범죄',ascending=False)
    #그래프 그리기
    plt.figure(figsize=(10,10))
    sns.heatmap(
         data=crime_anal_norm_sort[target_col],
        annot=True, #데이터값 표시
        fmt='f', #실수형
        linewidths=1, #간격설정
        cmap='RdPu'
    )
    plt.title('범죄 발생 비율(정규화된 범죄의 합으로 정렬)')
    plt.show()

drawGraph()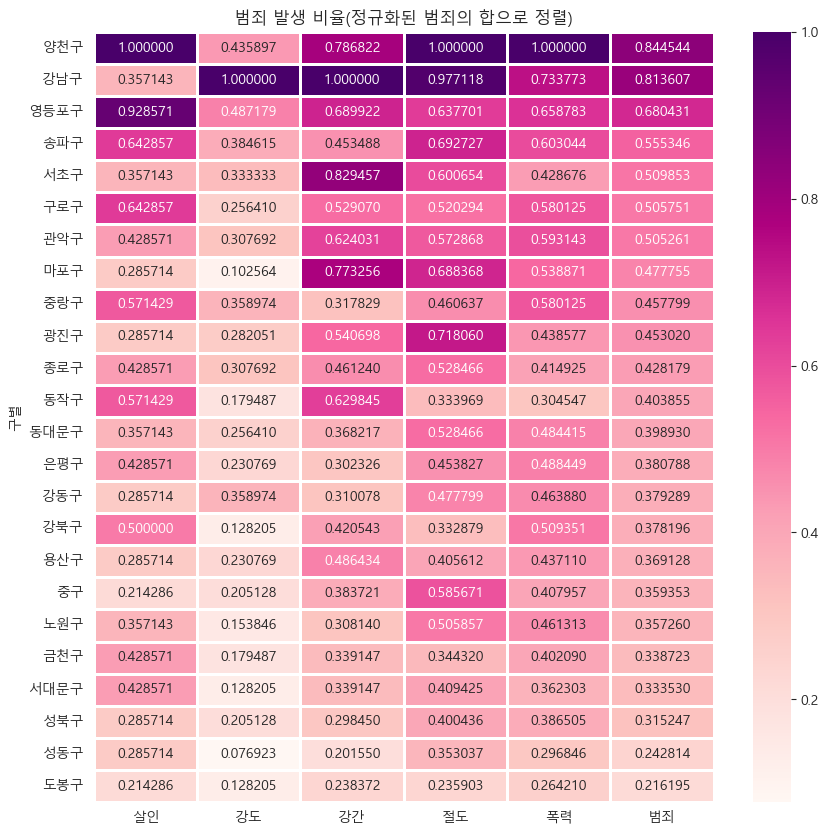
### folium
#folium 설치
!pip install folium
import folium
import pandas as pd
import jsonfolium.Map()
Examples
>>> m = folium.Map(location=[45.523, -122.675], width=750, height=500)
>>> m = folium.Map(location=[45.523, -122.675], tiles="cartodb positron")
>>> m = folium.Map(
...     location=[45.523, -122.675],
...     zoom_start=2,
...     tiles="https://api.mapbox.com/v4/mapbox.streets/{z}/{x}/{y}.png?access_token=mytoken",
...     attr="Mapbox attribution",
... )folium.Map(location=[45.523, -122.675], width=750, height=500)
m=folium.Map(location=[37.5094853,127.1020849], #석촌호수
            zoom_start=16) #0 - 18

m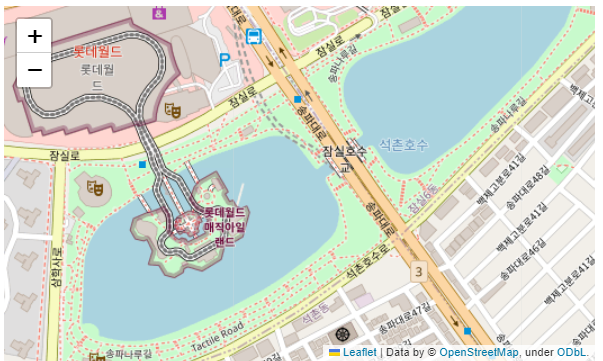
tiles option
to Folium. Pass any of the following to the "tiles" keyword:
- "OpenStreetMap"
- "Mapbox Bright" (Limited levels of zoom for free tiles)
- "Mapbox Control Room" (Limited levels of zoom for free tiles)
- "Stamen" (Terrain, Toner, and Watercolor)
- "Cloudmade" (Must pass API key)
- "Mapbox" (Must pass API key)
- "CartoDB" (positron and dark_matter)
m=folium.Map(location=[37.5094853,127.1020849],
            zoom_start=16,#0 - 18
            tiles='Stamen Watercolor' #지도스타일
            )

m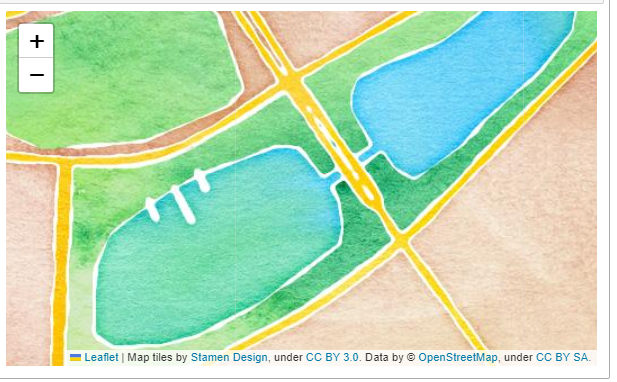
m=folium.Map(location=[37.5094853,127.1020849],
            zoom_start=16,#0 - 18
            tiles='CartoDB positron' #지도스타일
            )

m
folium.Maker()
-
지도에 표시 생성
    Init signature:
    folium.Marker(
        location=None,
        popup=None,
        tooltip=None,
        icon=None,
        draggable=False,
        **kwargs,
    )
    Docstring:
    Create a simple stock Leaflet marker on the map, with optional
    popup text or Vincent visualization.

    Parameters
    ----------
    location: tuple or list
        Latitude and Longitude of Marker (Northing, Easting)
    popup: string or folium.Popup, default None
        Label for the Marker; either an escaped HTML string to initialize
        folium.Popup or a folium.Popup instance.
    tooltip: str or folium.Tooltip, default None
        Display a text when hovering over the object.
    icon: Icon plugin
        the Icon plugin to use to render the marker.
    draggable: bool, default False
        Set to True to be able to drag the marker around the map.

        Examples
    --------
    >>> Marker(location=[45.5, -122.3], popup="Portland, OR")
    >>> Marker(location=[45.5, -122.3], popup=Popup("Portland, OR"))
    # If the popup label has characters that need to be escaped in HTML
    >>> Marker(
    ...     location=[45.5, -122.3],
    ...     popup=Popup("Mom & Pop Arrow Shop >>", parse_html=True),
... )
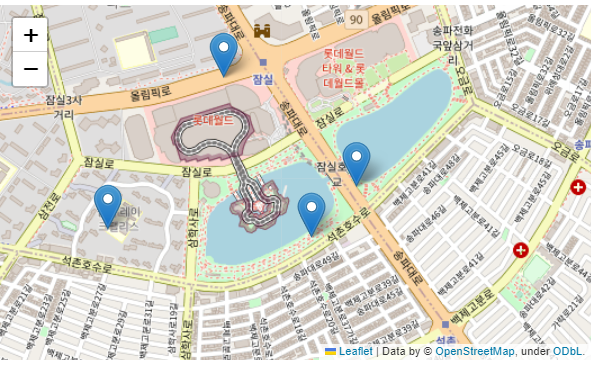
m=folium.Map(location=[37.5094853,127.1020849], #석촌호수
            zoom_start=15,#0 - 18
            tiles="OpenStreetMap"
            )

folium.Marker(location=[37.5088511,127.0995137],
             popup=folium.Popup("<center>롯데월드 매직아일랜드</center>", min_width=150, max_width=150), #html 문법 가능
             tooltip='<i>Magic Island</i>'
             ).add_to(m)


m 
folium.Marker(location=[37.5088511,127.0995137],
             popup=folium.Popup("<center><a href= 'https://goo.gl/maps/QzbYbRKfAnUv136K8' target=_'blink'>매직아일랜드</a></center>",
                                min_width=150,
                               max_width=150), #html 문법 가능
             tooltip='<i>매직아일랜드 info</i>'
             ).add_to(m)


m 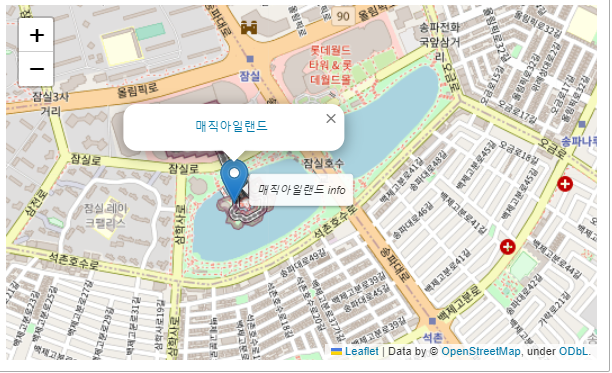
folium.Icon()
Init signature:
folium.Icon(
    color='blue',
    icon_color='white',
    icon='info-sign',
    angle=0,
    prefix='glyphicon',
    **kwargs,
)
Docstring:
Creates an Icon object that will be rendered
using Leaflet.awesome-markers.

Parameters
----------
color : str, default 'blue'
    The color of the marker. You can use:

        ['red', 'blue', 'green', 'purple', 'orange', 'darkred',
         'lightred', 'beige', 'darkblue', 'darkgreen', 'cadetblue',
         'darkpurple', 'white', 'pink', 'lightblue', 'lightgreen',
         'gray', 'black', 'lightgray']

icon_color : str, default 'white'
    The color of the drawing on the marker. You can use colors above,
    or an html color code.
icon : str, default 'info-sign'
    The name of the marker sign.
    See Font-Awesome website to choose yours.
    Warning : depending on the icon you choose you may need to adapt
    the `prefix` as well.
angle : int, default 0
    The icon will be rotated by this amount of degrees.
prefix : str, default 'glyphicon'
    The prefix states the source of the icon. 'fa' for font-awesome or
    'glyphicon' for bootstrap 3.
folium.Marker(location=[37.5088511,127.0995137],
             popup=folium.Popup("<center><a href= 'https://goo.gl/maps/QzbYbRKfAnUv136K8' target=_'blink'>매직아일랜드</a></center>",
                                min_width=150,
                               max_width=150), #html 문법 가능
             tooltip='<i>매직아일랜드 info</i>',
            icon=folium.Icon(
                color='lightblue',
                icon_color='black',
                icon='cloud'

            )
             ).add_to(m)


m 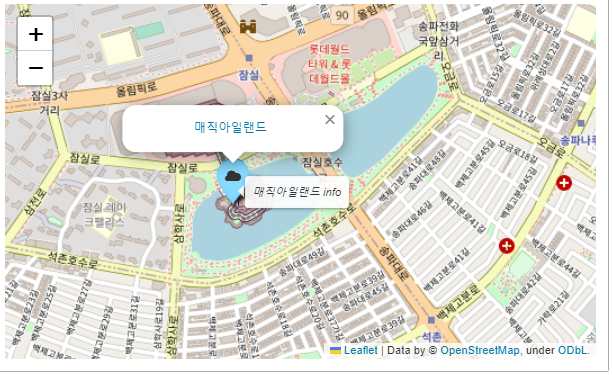
# icon custom
# icon - list >>> https://getbootstrap.com/docs/3.3/components/
custom_icon=folium.Icon(
    color='blue',
    icon_color='yellow',
    icon='star'

)
custom_popup=folium.Popup(
    "<center><a href= 'https://goo.gl/maps/QzbYbRKfAnUv136K8' target=_'blink'>매직아일랜드</a></center>",
                                min_width=150,
                               max_width=150
)

folium.Marker(location=[37.5088511,127.0995137],
             popup=custom_popup,
             tooltip='<i>매직아일랜드 info</i>',
             icon=custom_icon
).add_to(m)


m 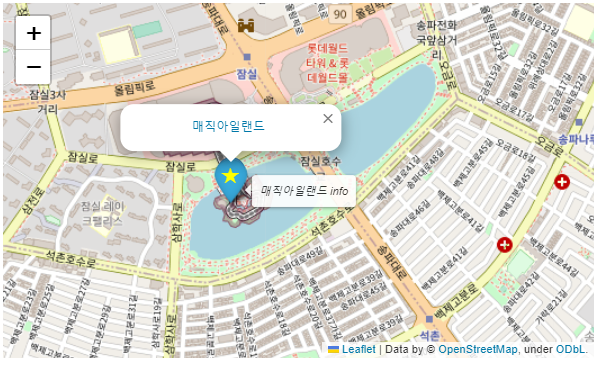
- fontawesome Icon 사이트
- frefix = 'fa'
# icon custom , frefix = 'fa'
# icon - list >>> https://fontawesome.com/search?m=free&o=r
custom_icon=folium.Icon(
    color='blue',
    icon_color='white',
    icon='ghost',
    prefix='fa'

)
custom_popup=folium.Popup(
    "<center><a href= 'https://goo.gl/maps/QzbYbRKfAnUv136K8' target=_'blink'>매직아일랜드</a></center>",
                                min_width=150,
                               max_width=150
)

folium.Marker(location=[37.5088511,127.0995137],
             popup=custom_popup,
             tooltip='<i>매직아일랜드 info</i>',
             icon=custom_icon
).add_to(m)


m 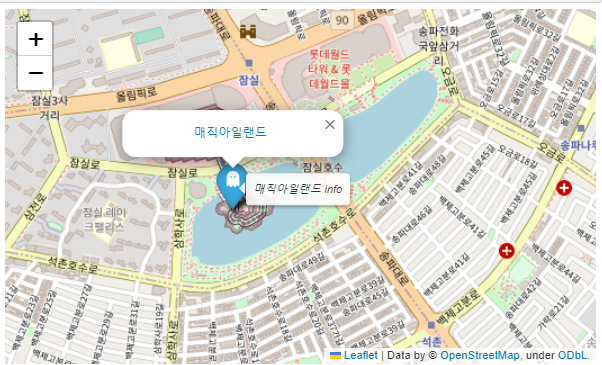
folium.ClickForMarker()
- 지도위에 마우스를 클릭했을 때 마커 생성 m=folium.Map(location=[37.5094853,127.1020849], #석촌호수
zoom_start=15,#0 - 18
tiles="OpenStreetMap"
)
m.add_child(folium.ClickForMarker(
popup='ClickForMarker'
))
m
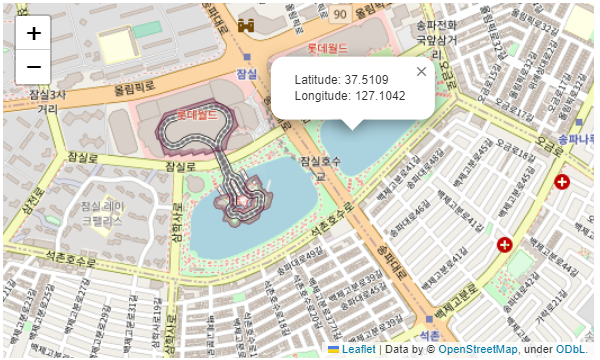
folium.LatLngPopup()
- 지도를 클릭했을 때 위도 걍도 정보를 반환한다
folium.Circle(), folium.CircleMarker()
Init signature: folium.Circle(location=None, radius=50, popup=None, tooltip=None, **kwargs)
Docstring:
Class for drawing circle overlays on a map.

It's an approximation and starts to diverge from a real circle closer to
the poles (due to projection distortion).

See :func:`folium.vector_layers.path_options` for the `Path` options.

Parameters
----------
location: tuple[float, float]
    Latitude and Longitude pair (Northing, Easting)
popup: string or folium.Popup, default None
    Input text or visualization for object displayed when clicking.
tooltip: str or folium.Tooltip, default None
    Display a text when hovering over the object.
radius: float
    Radius of the circle, in meters.
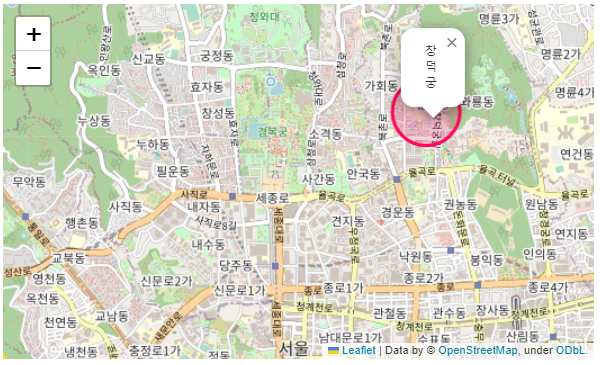
m=folium.Map(location=[37.5749373,126.9786355], #종로구
         zoom_start=14,#0 - 18
            tiles="OpenStreetMap"
            )

#circle
folium.Circle(
     location=[37.565643683342, 126.95524147826], #경복궁
     radius=100,
     fill=True,
     color='#ffd324',
     fill_color='#ffd324',
     popup='경복궁',
     toltip='Circle'

).add_to(m)

#circleMarker
folium.CircleMarker(
     location=[37.580888310281, 126.98838803559 ], #창덕궁
     radius=30,
     fill=True,
     color='#ff085a',
     fill_color='#ff085a',
     popup='창덕궁',
     toltip='CircleMarker'

).add_to(m)

m
folium.Choropleth
Init signature:
folium.Choropleth(
    geo_data,
    data=None,
    columns=None,
    key_on=None,
    bins=6,
    fill_color=None,
    nan_fill_color='black',
    fill_opacity=0.6,
    nan_fill_opacity=None,
    line_color='black',
    line_weight=1,
    line_opacity=1,
    name=None,
    legend_name='',
    overlay=True,
    control=True,
    show=True,
    topojson=None,
    smooth_factor=None,
    highlight=None,
    use_jenks=False,
    **kwargs,
)
Docstring:
Apply a GeoJSON overlay to the```
folium.Choropleth(
    geo_data='../data/02. us-states.json', #경계선 좌표가 담긴 데이터
    data=state_data, # Series or DataFrame
    columns=['State','Unemployment'],
    key_on='feature.id',
    fill_color='BuPu',
    fill_opacity=0.8, #0-1
    line_opacity=0.8, #0-1
    legend_name='Unemployment rate (#)'
).add_to(m)


m map.

```python
import json

state_data=pd.read_csv('../data/02. US_Unemployment_Oct2012.csv', encoding='utf-8')
state_data.tail(2)| - | State | Unemployment |
|---|---|---|
| 48 | WI | 6.8 |
| 49 | WY | 5.1 |
m=folium.Map([43,-102],zoom_start=3)

folium.Choropleth(
    geo_data='../data/02. us-states.json', #경계선 좌표가 담긴 데이터
    data=state_data, # Series or DataFrame
    columns=['State','Unemployment'],
    key_on='feature.id',
    fill_color='BuPu',
    fill_opacity=0.8, #0-1
    line_opacity=0.8, #0-1
    legend_name='Unemployment rate (#)'
).add_to(m)


m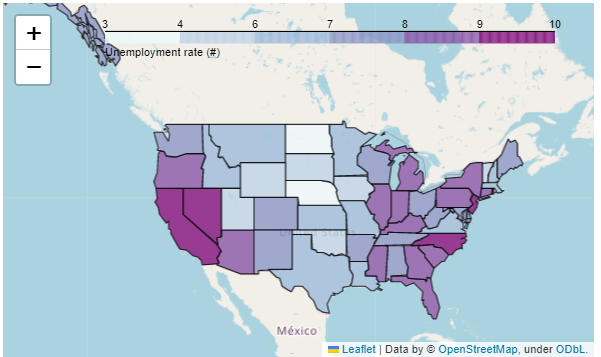
아파트 유형 지도 시각화
- 공공데이터 포털
df=pd.read_csv('../data/02. 서울특별시 동작구_주택유형별 위치 정보 및 세대수 현황_20210825.csv',encoding='euc-kr') # 한글 파일은 euc-kr . cp949로 인코딩
df.head()
| - | 연번 | 분류 | 건물명 | 행정동 | 주소 | 세대수 | 위도 | 경도 |
|---|---|---|---|---|---|---|---|---|
| 0 | 1 | 아파트 | 노량진우성 | 노량진1동 | 서울특별시 동작구 만양로8길 50 | 901 | 37.510304 | 126.946866 |
| 1 | 2 | 아파트 | 노량진삼익 | 노량진1동 | 서울특별시 동작구 만양로 84 | 175 | 37.511367 | 126.945226 |
| 2 | 3 | 아파트 | 신동아리버파크(분양 1,696,임대 925) | 노량진1동 | 서울특별시 동작구 만양로 19 | 2621 | 37.507073 | 126.945718 |
| 3 | 4 | 아파트 | 노량진쌍용예가 | 노량진1동 | 서울특별시 동작구 장승배기로16길 134 | 299 | 37.510265 | 126.943676 |
| 4 | 5 | 아파트 | 형인한강 | 노량진1동 | 서울특별시 동작구 만양로 36 | 73 | 37.507664 | 126.948235 |
df.info()<class 'pandas.core.frame.DataFrame'>
RangeIndex: 167 entries, 0 to 166
Data columns (total 8 columns):
# Column Non-Null Count Dtype
--- ------ -------------- -----
0 연번 167 non-null int64
1 분류 167 non-null object
2 건물명 167 non-null object
3 행정동 167 non-null object
4 주소 167 non-null object
5 세대수 167 non-null int64
6 위도 163 non-null float64
7 경도 163 non-null float64
dtypes: float64(2), int64(2), object(4)
memory usage: 10.6+ KB# NaN 데이터 제거
df=df.dropna()
df.info()<class 'pandas.core.frame.DataFrame'>
Int64Index: 163 entries, 0 to 166
Data columns (total 8 columns):
# Column Non-Null Count Dtype
--- ------ -------------- -----
0 연번 163 non-null int64
1 분류 163 non-null object
2 건물명 163 non-null object
3 행정동 163 non-null object
4 주소 163 non-null object
5 세대수 163 non-null int64
6 위도 163 non-null float64
7 경도 163 non-null float64
dtypes: float64(2), int64(2), object(4)
memory usage: 11.5+ KBdf.reset_index(drop=True).tail()
# 연변과 분류뒤에 빈칸 제거
df=df.rename(columns={'연번 ':'연번','분류 ':'분류'})
df.columns
df.describe()| - | 세대수 | 위도 | 경도 |
|---|---|---|---|
| count | 163.000000 | 163.000000 | 163.000000 |
| mean | 371.920245 | 37.497442 | 126.949817 |
| std | 413.115354 | 0.009532 | 0.019861 |
| min | 21.000000 | 37.477376 | 126.906940 |
| 25% | 86.000000 | 37.490626 | 126.933284 |
| 50% | 199.000000 | 37.496940 | 126.949902 |
| 75% | 518.500000 | 37.505321 | 126.967196 |
| max | 2621.000000 | 37.514280 | 126.981966 |
#folium
m=folium.Map(
    location=[ 37.495172947072,126.95453489844],
    zoom_start=13

)


for idx, rows in df.iterrows():
    # location
    lat,lng=rows.위도, rows.경도

    #icon - list >>> https://getbootstrap.com/docs/3.3/components/
    custom_icon=folium.Icon(
    color ='red' if rows.세대수>=199 else 'blue',
    icon_color='white',
    icon='home')

    #marker
    folium.Marker(
        location=[lat,lng],
        icon=custom_icon,
        tooltip=rows.분류,
        popup=rows.주소
    ).add_to(m)

    #ClickMarker
    folium.CircleMarker(
        location=[lat,lng],
        radius=rows.세대수*0.02,
        fill=True,
        color='#009dff' if rows.세대수<518 else '#ff0061',
        fill_color='#009dff'if rows.세대수<518 else '#ff0061'

    ).add_to(m)

m
2. 서울시 범죄 현환 지도 시각화
crime_anal_norm=pd.read_csv(
    '../data/02. crime_in_Seoul_final.csv', index_col=0,encoding='utf-8'
)
geo_path='../data/02. skorea_municipalities_geo_simple.json'
geo_str=json.load(open(geo_path,encoding='utf-8'))

crime_anal_norm.tail()| 강도 | 살인 | 강간 | 절도 | 폭력 | 강간검거율 | 강도검거율 | 살인검거율 | 절도검거율 | 폭력검거율 | 인구수 | CCTV | 범죄 | 검거 | |
|---|---|---|---|---|---|---|---|---|---|---|---|---|---|---|
| 구별 | ||||||||||||||
| 용산구 | 0.230769 | 0.285714 | 0.486434 | 0.405612 | 0.437110 | 85.258964 | 100.000000 | 100.000000 | 40.228341 | 84.228188 | 233734 | 2096 | 0.369128 | 81.943099 |
| 은평구 | 0.230769 | 0.428571 | 0.302326 | 0.453827 | 0.488449 | 91.025641 | 77.777778 | 100.000000 | 53.421369 | 86.636637 | 474124 | 2108 | 0.380788 | 81.772285 |
| 종로구 | 0.307692 | 0.428571 | 0.461240 | 0.528466 | 0.414925 | 74.369748 | 75.000000 | 33.333333 | 39.587629 | 87.361909 | 151999 | 1619 | 0.428179 | 61.930524 |
| 중구 | 0.205128 | 0.214286 | 0.383721 | 0.585671 | 0.407957 | 74.747475 | 87.500000 | 100.000000 | 42.511628 | 89.707865 | 130764 | 1023 | 0.359353 | 78.893394 |
| 중랑구 | 0.358974 | 0.571429 | 0.317829 | 0.460637 | 0.580125 | 91.463415 | 100.000000 | 87.500000 | 62.211709 | 85.714286 | 391110 | 916 | 0.457799 | 85.377882 |
# 살인 발생 건수 시각화

my_map=folium.Map(
    location=[37.5502,126.982],
    zoom_start=11,
    tiles='Stamen Toner'
)

folium.Choropleth(
    geo_data=geo_str, #우리나라 경계선 좌표가 답긴 데이터
    data=crime_anal_norm['살인'],
    columns=[crime_anal_norm.index,crime_anal_norm['살인']],
    key_on='feature.id',
    fill_color='PuRd',
    fill_opacity=0.8,
    line_opacity=0.5,
    legend_name='정규화된 살인 발생 건수'
).add_to(my_map)

my_map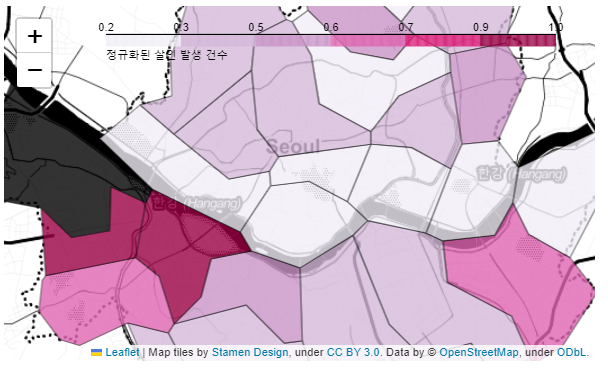
# 5대 범죄 발생 건수 시각화

my_map=folium.Map(
    location=[37.5502,126.982],
    zoom_start=11,
    tiles='Stamen Toner'
)

folium.Choropleth(
    geo_data=geo_str, #우리나라 경계선 좌표가 답긴 데이터
    data=crime_anal_norm['범죄'],
    columns=[crime_anal_norm.index,crime_anal_norm['범죄']],
    key_on='feature.id',
    fill_color='PuRd',
    fill_opacity=0.8,
    line_opacity=0.5,
    legend_name='정규화된 5대 범죄 발생 건수'
).add_to(my_map)

my_map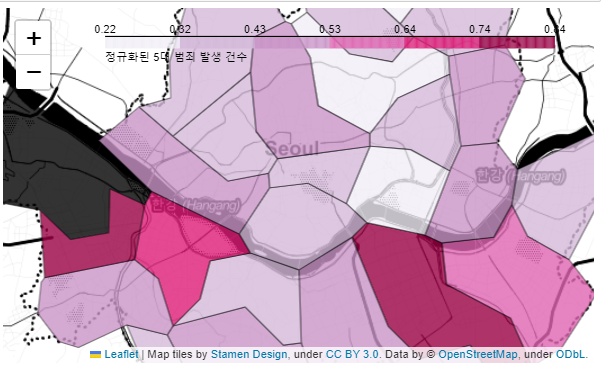
# 인구대비 범죄 발생 건수 시각화

tmp_criminal=crime_anal_norm['범죄']/crime_anal_norm['인구수']

my_map=folium.Map(
    location=[37.5502,126.982],
    zoom_start=11,
    tiles='Stamen Toner'
)

folium.Choropleth(
    geo_data=geo_str, #우리나라 경계선 좌표가 답긴 데이터
    data=tmp_criminal,
    columns=[crime_anal_norm.index,tmp_criminal],
    key_on='feature.id',
    fill_color='PuRd',
    fill_opacity=0.8,
    line_opacity=0.5,
    legend_name='인구대비 범죄 발생 건수'
).add_to(my_map)

my_map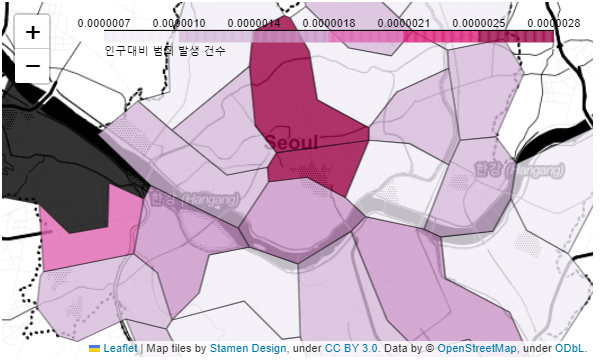
# 경찰서 별 범죄 발생 건수 시각화

crime_anal_station=pd.read_csv(
    '../data/02. crime_in_Seoul_raw.csv',
    encoding='utf-8'
)
crime_anal_station.tail(2)| - | 구분 | 강간검거 | 강간발생 | 강도검거 | 강도발생 | 살인검거 | 살인발생 | 절도검거 | 절도발생 | 폭력검거 | 폭력발생 | 구별 | lat | lng |
|---|---|---|---|---|---|---|---|---|---|---|---|---|---|---|
| 29 | 중부 | 96.0 | 141.0 | 3.0 | 3.0 | 2.0 | 2.0 | 485.0 | 1204.0 | 1164.0 | 1335.0 | 중구 | 37.563646 | 126.989580 |
| 30 | 혜화 | 64.0 | 101.0 | 6.0 | 6.0 | 2.0 | 2.0 | 379.0 | 988.0 | 842.0 | 972.0 | 종로구 | 37.571840 | 126.998856 |
col=['강간검거','강도검거','살인검거','절도검거','폭력검거']
tmp=crime_anal_station[col]/crime_anal_station[col].max() #정규화 0 - 1
crime_anal_station['검거']=np.mean(tmp,axis=1) # numpy axis = 1 >> 행을 말함 / pandas axis = 1 >> 열을말함
crime_anal_station.tail()| 구분 | 강간검거 | 강간발생 | 강도검거 | 강도발생 | 살인검거 | 살인발생 | 절도검거 | 절도발생 | 폭력검거 | 폭력발생 | 구별 | lat | lng | 검거 | |
|---|---|---|---|---|---|---|---|---|---|---|---|---|---|---|---|
| 26 | 종로 | 113.0 | 137.0 | 3.0 | 6.0 | 0.0 | 4.0 | 389.0 | 952.0 | 1135.0 | 1291.0 | 종로구 | 37.575558 | 126.984867 | 0.238103 |
| 27 | 종암 | 42.0 | 51.0 | 5.0 | 5.0 | 1.0 | 2.0 | 344.0 | 680.0 | 815.0 | 932.0 | 성북구 | 37.602059 | 127.032158 | 0.195242 |
| 28 | 중랑 | 150.0 | 164.0 | 14.0 | 14.0 | 7.0 | 8.0 | 1052.0 | 1691.0 | 2712.0 | 3164.0 | 중랑구 | 37.618692 | 127.104714 | 0.675873 |
| 29 | 중부 | 96.0 | 141.0 | 3.0 | 3.0 | 2.0 | 2.0 | 485.0 | 1204.0 | 1164.0 | 1335.0 | 중구 | 37.563646 | 126.989580 | 0.277182 |
| 30 | 혜화 | 64.0 | 101.0 | 6.0 | 6.0 | 2.0 | 2.0 | 379.0 | 988.0 | 842.0 | 972.0 | 종로구 | 37.571840 | 126.998856 | 0.240065 |
# 경찰서 위치 마커 표시
my_map=folium.Map(
    location=[37.5502, 126.982],
    zoom_start=11
)


for idx, rows in crime_anal_station.iterrows():

    folium.Marker(
        location=[rows['lat'],rows['lng']]

    ).add_to(my_map)

my_map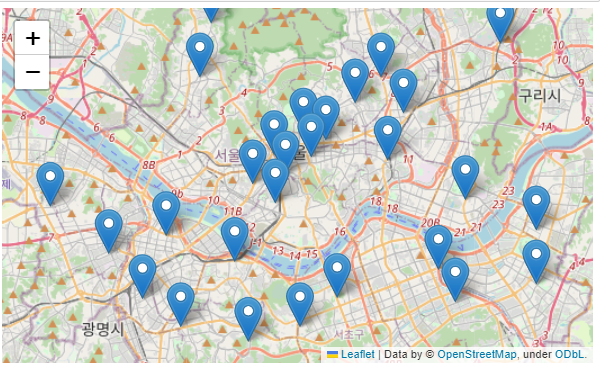
# Circle 추가 : 검거에 값을 곱한 뒤 원의 넓이 적용

my_map=folium.Map(
    location=[37.5502, 126.982],
    zoom_start=11
)

for idx, rows in crime_anal_station.iterrows():

    folium.CircleMarker(
        location=[rows['lat'],rows['lng']],
        radius=rows['검거']*50,
        popup=rows['구분'] + ' : '+'%.2f ' %rows['검거'],
        fill=True,
        color='#3186cc',
        fill_color='3186cc'

    ).add_to(my_map)

my_map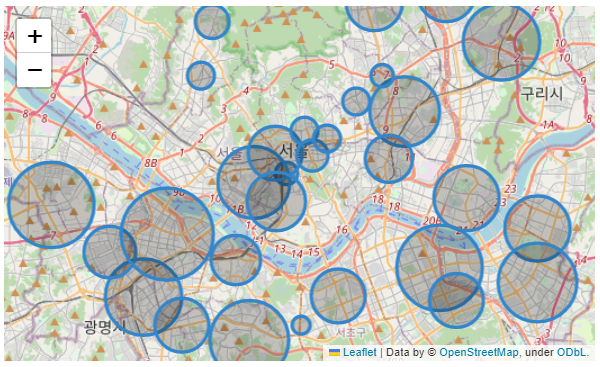
# 경계선 추가

my_map=folium.Map(
    location=[37.5502, 126.982],
    zoom_start=11
)

folium.Choropleth(
    geo_data=geo_str,
    data=crime_anal_norm['범죄'],
    columns=[crime_anal_norm.index,crime_anal_norm['범죄']],
    key_on='feature.id',
    fill_color='PuRd',
    fill_opacity=0.7,
    line_opacity=0.2,

).add_to(my_map)

my_map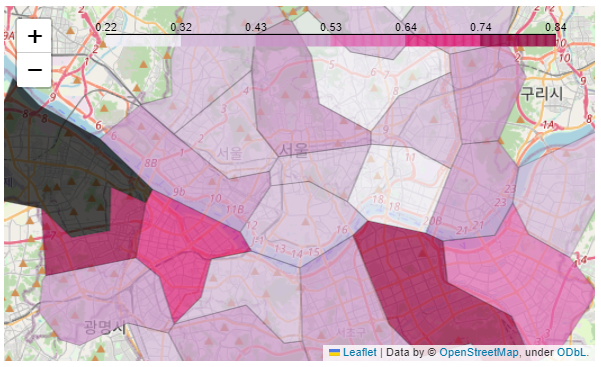
3. 서울시 범죄현황 발생 장소 분석
#추가 검증

crime_loc_raw=pd.read_csv(
    '../data/02. crime_in_Seoul_location.csv', thousands=',',encoding='euc-kr'
)
crime_loc_raw.tail()| - | 범죄명 | 장소 | 발생건수 |
|---|---|---|---|
| 60 | 폭력 | 교통수단 | 222 |
| 61 | 폭력 | 유원지 | 424 |
| 62 | 폭력 | 학교 | 203 |
| 63 | 폭력 | 금융기관 | 42 |
| 64 | 폭력 | 기타 | 26382 |
crime_loc_raw.info()<class 'pandas.core.frame.DataFrame'>
RangeIndex: 65 entries, 0 to 64
Data columns (total 3 columns):
# Column Non-Null Count Dtype
--- ------ -------------- -----
0 범죄명 65 non-null object
1 장소 65 non-null object
2 발생건수 65 non-null int64
dtypes: int64(1), object(2)
memory usage: 1.6+ KBcrime_loc=crime_loc_raw.pivot_table(
values=crime_loc_raw, index='장소', columns='범죄명', aggfunc=[np.sum]
)
crime_loc.columns=crime_loc.columns.droplevel([0,1])
crime_loc| 범죄명 | 강간.추행 | 강도 | 살인 | 절도 | 폭력 |
|---|---|---|---|---|---|
| 장소 | |||||
| 교통수단 | 691 | 0 | 0 | 457 | 222 |
| 금융기관 | 2 | 1 | 1 | 1081 | 42 |
| 기타 | 2128 | 67 | 65 | 21734 | 26382 |
| 노상 | 986 | 87 | 22 | 9329 | 24535 |
| 단독주택 | 395 | 15 | 30 | 2241 | 3579 |
| 사무실 | 132 | 8 | 1 | 682 | 1229 |
| 상점 | 95 | 34 | 1 | 4403 | 852 |
| 숙박업소, 목욕탕 | 389 | 9 | 4 | 828 | 303 |
| 아파트, 연립 다세대 | 284 | 18 | 12 | 1504 | 2839 |
| 역, 대합실 | 181 | 0 | 0 | 356 | 272 |
| 유원지 | 59 | 2 | 2 | 367 | 424 |
| 유흥 접객업소 | 398 | 13 | 8 | 2035 | 2645 |
| 학교 | 33 | 0 | 0 | 400 | 203 |
col=['살인','강도','강간','절도','폭력']
crime_loc_norm=crime_loc / crime_loc.max() # 정규화
crime_loc_norm['종합'] = np.mean(crime_loc_norm, axis=1)
crime_loc_norm
| 범죄명 | 강간.추행 | 강도 | 살인 | 절도 | 폭력 | 종합 |
|---|---|---|---|---|---|---|
| 장소 | ||||||
| 교통수단 | 0.324718 | 0.000000 | 0.000000 | 0.021027 | 0.008415 | 0.070832 |
| 금융기관 | 0.000940 | 0.011494 | 0.015385 | 0.049738 | 0.001592 | 0.015830 |
| 기타 | 1.000000 | 0.770115 | 1.000000 | 1.000000 | 1.000000 | 0.954023 |
| 노상 | 0.463346 | 1.000000 | 0.338462 | 0.429235 | 0.929990 | 0.632207 |
| 단독주택 | 0.185620 | 0.172414 | 0.461538 | 0.103110 | 0.135661 | 0.211669 |
| 사무실 | 0.062030 | 0.091954 | 0.015385 | 0.031379 | 0.046585 | 0.049467 |
| 상점 | 0.044643 | 0.390805 | 0.015385 | 0.202586 | 0.032295 | 0.137143 |
| 숙박업소, 목욕탕 | 0.182801 | 0.103448 | 0.061538 | 0.038097 | 0.011485 | 0.079474 |
| 아파트, 연립 다세대 | 0.133459 | 0.206897 | 0.184615 | 0.069200 | 0.107611 | 0.140356 |
| 역, 대합실 | 0.085056 | 0.000000 | 0.000000 | 0.016380 | 0.010310 | 0.022349 |
| 유원지 | 0.027726 | 0.022989 | 0.030769 | 0.016886 | 0.016072 | 0.022888 |
| 유흥 접객업소 | 0.187030 | 0.149425 | 0.123077 | 0.093632 | 0.100258 | 0.130684 |
| 학교 | 0.015508 | 0.000000 | 0.000000 | 0.018404 | 0.007695 | 0.008321 |
crime_loc_norm_sort=crime_loc_norm.sort_values('종합',ascending=False) #내림차순

def drawGraph():
    plt.figure(figsize=(10,10))
    sns.heatmap(
        crime_loc_norm_sort,
        annot=True,
        fmt='f',
        linewidths=0.5,
        cmap='RdPu')

    plt.title('범죄 발생 장소')
    plt.show()

drawGraph()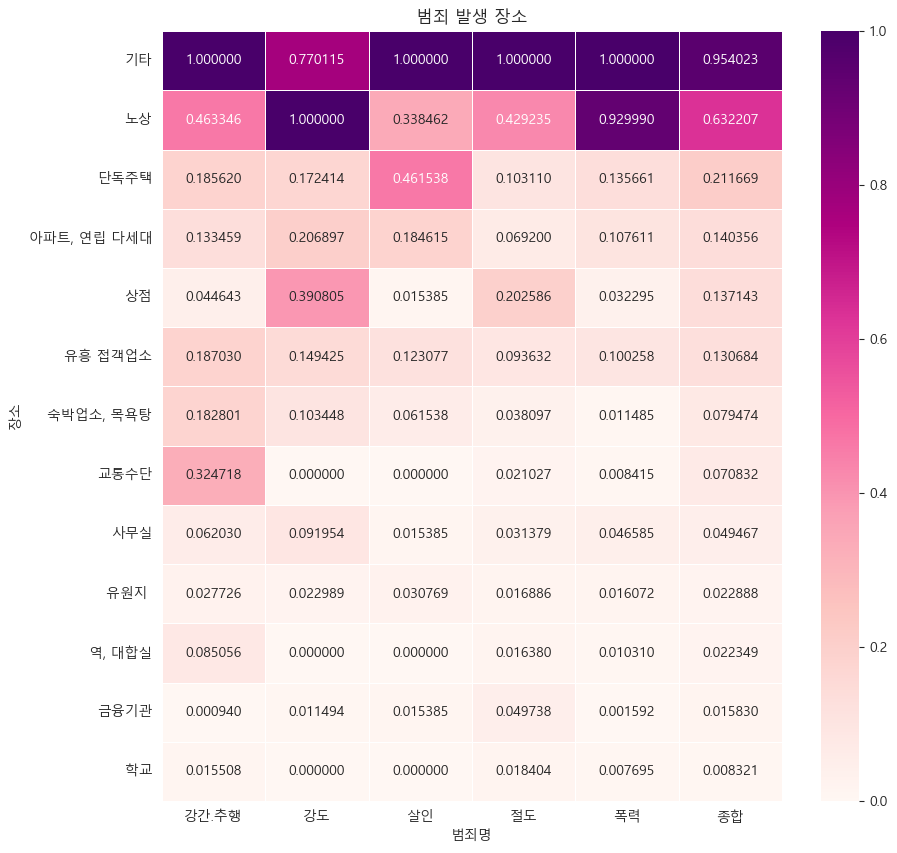

개발하고싶은사람
안녕하세요. 글 너무 잘 읽었어요. 혹시 서울시 범죄현황 데이터 어디서 다운받으셨는지 알 수 있을까요?