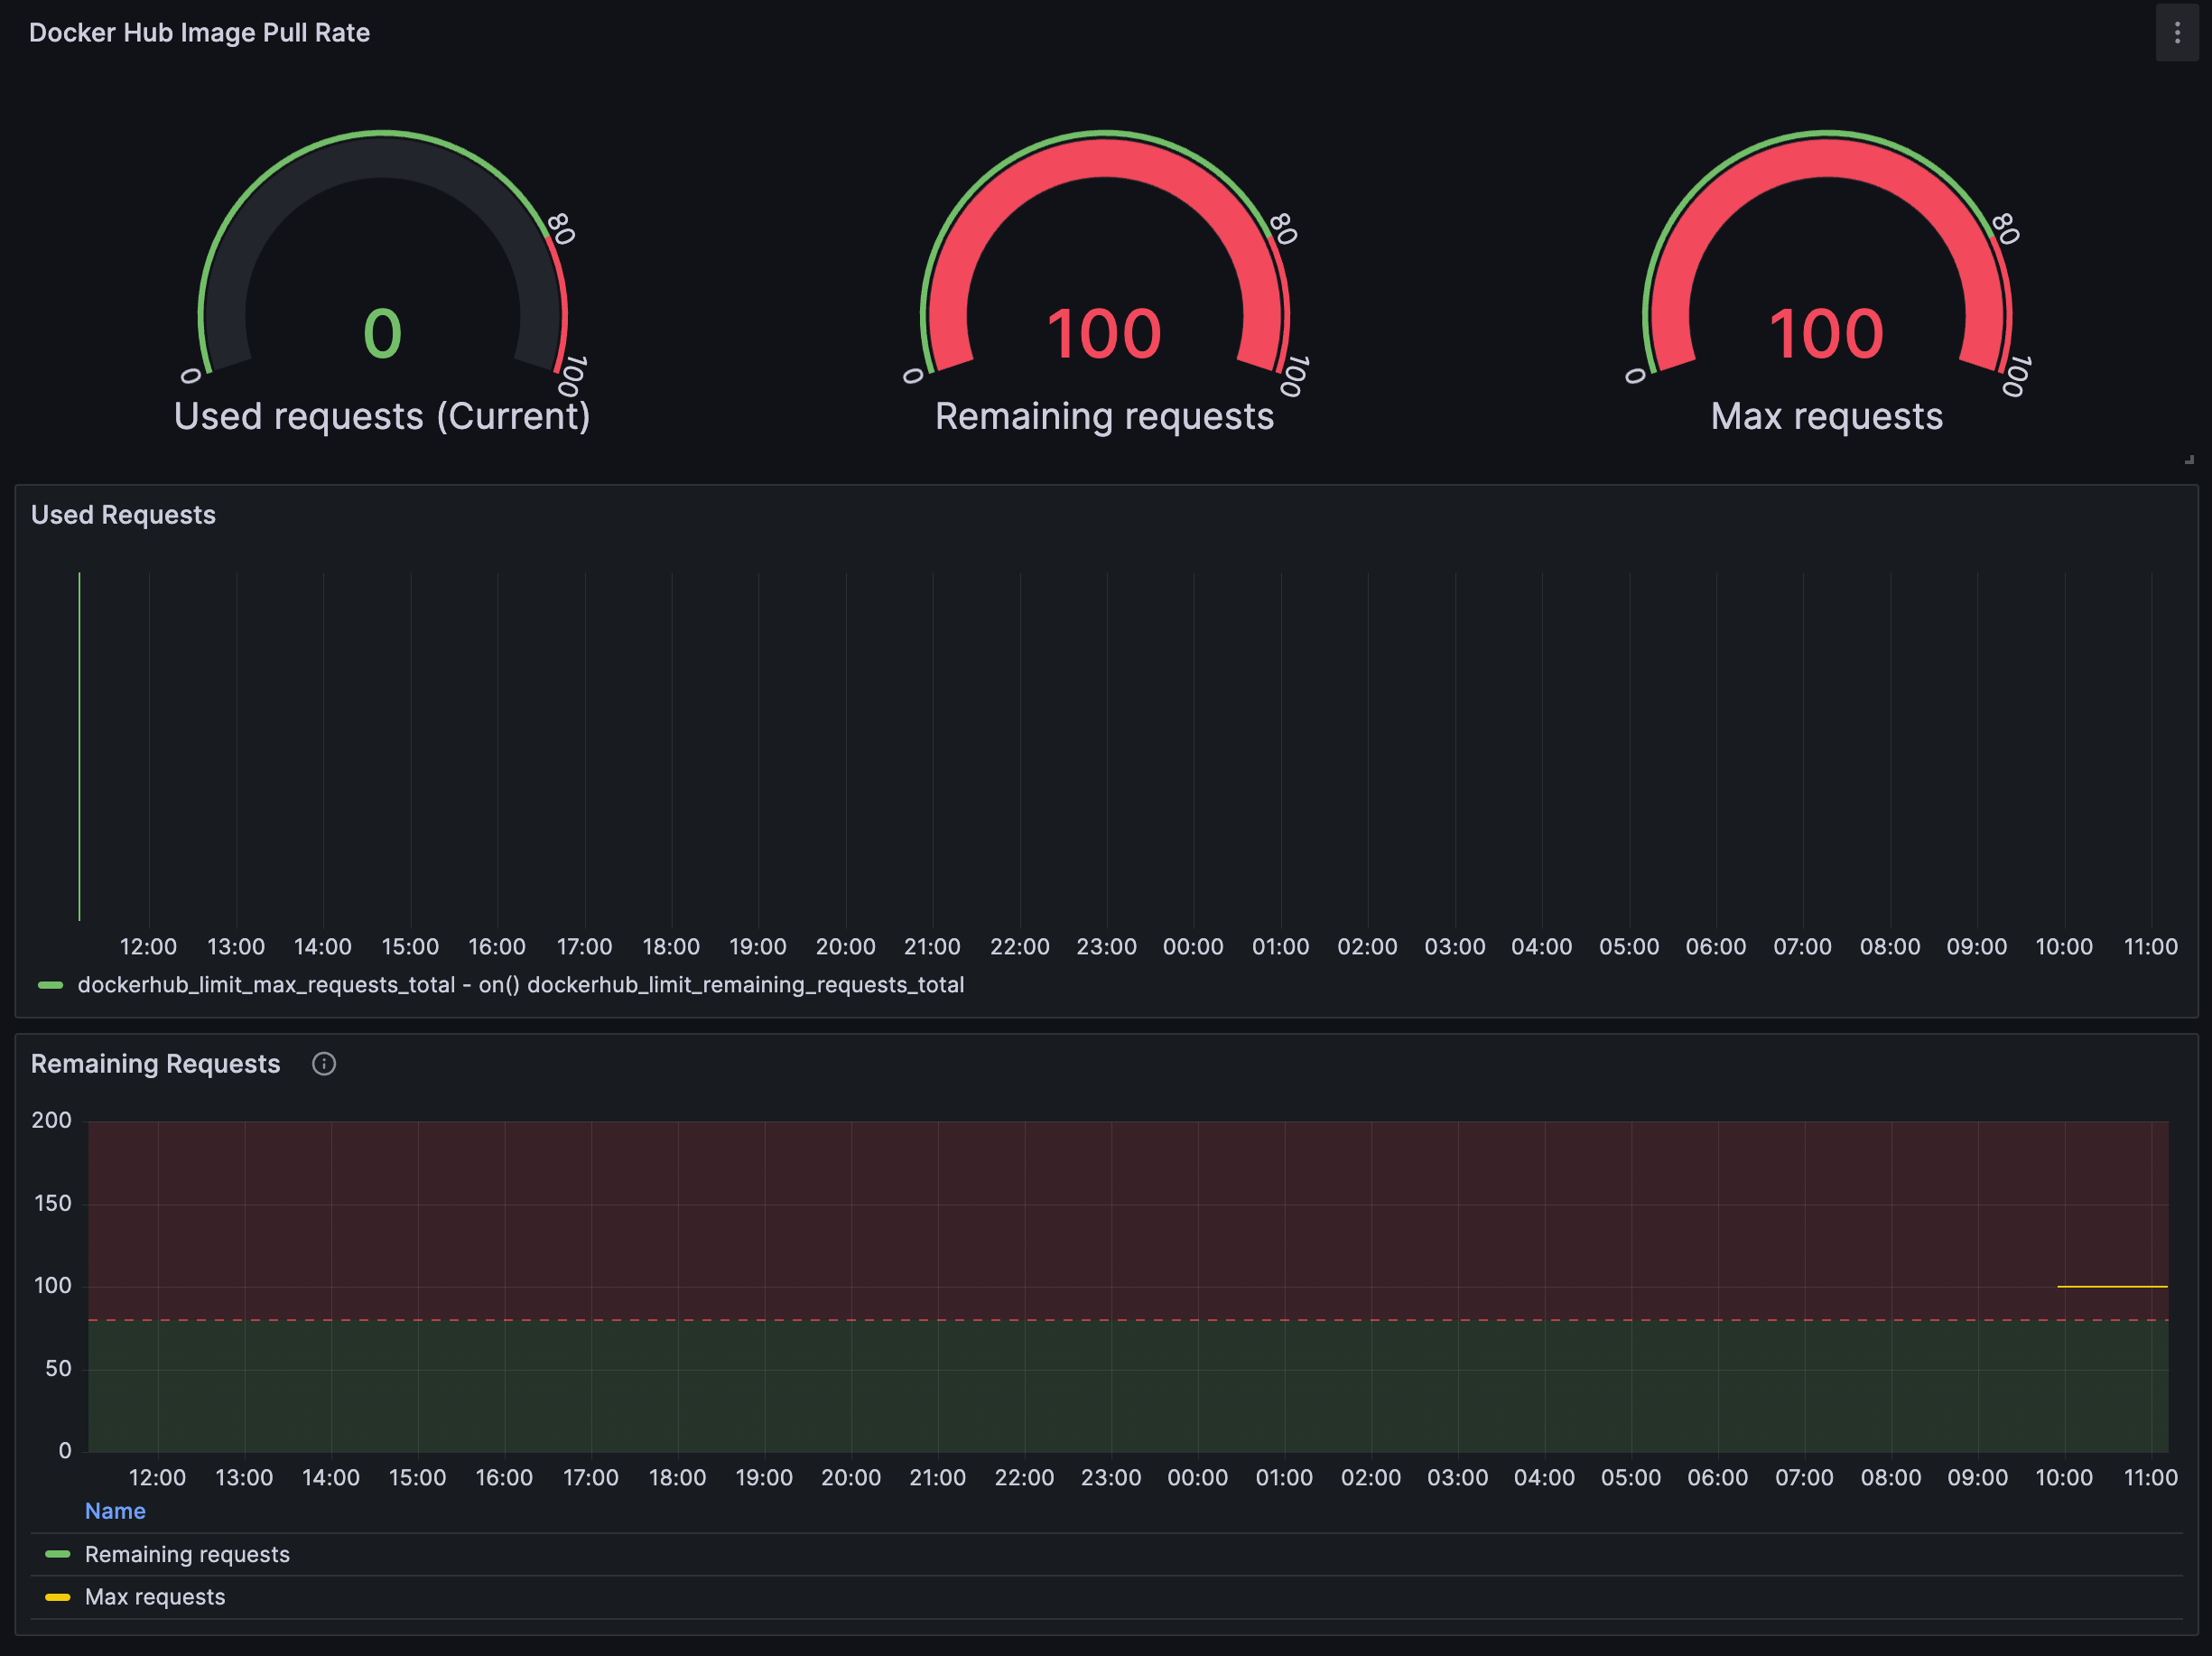
Dockerhub에서 익명으로 Image를 Pull 받게 되면 6시간 내 100회로 한정됨. (바로 터지면 ㅠㅠ 답이 ㅜㅜ 그전에 해결하기 위해 관계 어플리케이션을 준비)
docker-hub-rate-limit-exporter
Kubernetes 환경에서 가장 빠르게 구성은 .
/ci/allenabled-values.yaml 을 이용하면 됨# Default values for docker-hub-rate-limit-exporter.
# This is a YAML-formatted file.
# Declare variables to be passed into your templates.
config:
# Log level of the exporter
verbosity: 1
dockerhub:
username: ""
password: ""
deployment:
enabled: false
replicaCount: 1
daemonset:
enabled: true
updateStrategy:
type: RollingUpdate
rollingUpdate:
maxUnavailable: 1
image:
repository: viadee/docker-hub-rate-limit-exporter
tag: ""
pullPolicy: IfNotPresent
imagePullSecrets: []
nameOverride: ""
fullnameOverride: ""
serviceMonitor:
enabled: true
additionalLabels: {}
namespace: ""
jobLabel: ""
scheme: http
bearerTokenFile:
tlsConfig: {}
## proxyUrl: URL of a proxy that should be used for scraping.
##
proxyUrl: ""
## Override serviceMonitor selector
##
selectorOverride: {}
relabelings:
- action: replace
sourceLabels:
- __meta_kubernetes_pod_node_name
targetLabel: instance
- action: replace
sourceLabels:
- __meta_kubernetes_pod_host_ip
targetLabel: host_ip
metricRelabelings: []
interval: ""
scrapeTimeout: 25s
serviceAccount:
# Specifies whether a service account should be created
create: true
# Annotations to add to the service account
annotations: {}
# The name of the service account to use.
# If not set and create is true, a name is generated using the fullname template
name: ""
podAnnotations:
sidecar.istio.io/inject: "false"
securityContext:
fsGroup: 65534
runAsGroup: 65534
runAsNonRoot: true
runAsUser: 65534
containerSecurityContext:
capabilities:
add:
- SYS_TIME
service:
type: ClusterIP
port: 9100
targetPort: 9100
nodePort:
portName: metrics
timeoutSeconds: 5
annotations:
prometheus.io/scrape: "true"
resources:
limits:
cpu: 200m
memory: 96Mi
requests:
cpu: 50m
memory: 64Mi
nodeSelector: {}
tolerations: []
priorityClassName: ""
affinity: {}
# Expose the service to the host network
hostNetwork: false
# Share the host process ID namespace
hostPID: true
✓ 서비스모니터(ServiceMonitor) 도 설치는 되지만 간혹 안될경우도 있다. 이부분은 자세히 재검토 필요하셔요..
Dashboard (JSON) 참조
{
  "annotations": {
    "list": [
      {
        "builtIn": 1,
        "datasource": {
          "type": "datasource",
          "uid": "grafana"
        },
        "enable": true,
        "hide": true,
        "iconColor": "rgba(0, 211, 255, 1)",
        "name": "Annotations & Alerts",
        "type": "dashboard"
      }
    ]
  },
  "editable": true,
  "fiscalYearStartMonth": 0,
  "graphTooltip": 0,
  "id": 50259,
  "links": [],
  "liveNow": false,
  "panels": [
    {
      "datasource": {
        "type": "prometheus",
        "uid": "prometheus"
      },
      "fieldConfig": {
        "defaults": {
          "mappings": [],
          "thresholds": {
            "mode": "absolute",
            "steps": [
              {
                "color": "green",
                "value": null
              },
              {
                "color": "red",
                "value": 80
              }
            ]
          }
        },
        "overrides": []
      },
      "gridPos": {
        "h": 7,
        "w": 24,
        "x": 0,
        "y": 0
      },
      "id": 6,
      "options": {
        "orientation": "auto",
        "reduceOptions": {
          "calcs": [
            "lastNotNull"
          ],
          "fields": "",
          "values": false
        },
        "showThresholdLabels": true,
        "showThresholdMarkers": true
      },
      "pluginVersion": "10.1.5",
      "targets": [
        {
          "datasource": {
            "type": "prometheus",
            "uid": "prometheus"
          },
          "editorMode": "code",
          "expr": "dockerhub_limit_max_requests_total - on() dockerhub_limit_remaining_requests_total",
          "interval": "",
          "legendFormat": "Used requests (Current)",
          "queryType": "randomWalk",
          "range": true,
          "refId": "A"
        },
        {
          "datasource": {
            "type": "prometheus",
            "uid": "prometheus"
          },
          "expr": "dockerhub_limit_remaining_requests_total",
          "interval": "",
          "legendFormat": "Remaining requests",
          "refId": "B"
        },
        {
          "datasource": {
            "type": "prometheus",
            "uid": "prometheus"
          },
          "expr": "dockerhub_limit_max_requests_total",
          "interval": "",
          "legendFormat": "Max requests",
          "refId": "C"
        }
      ],
      "title": "Docker Hub Image Pull Rate",
      "transparent": true,
      "type": "gauge"
    },
    {
      "datasource": {
        "type": "prometheus",
        "uid": "prometheus"
      },
      "fieldConfig": {
        "defaults": {
          "color": {
            "mode": "continuous-GrYlRd"
          },
          "custom": {
            "axisCenteredZero": true,
            "axisColorMode": "series",
            "axisGridShow": true,
            "axisLabel": "",
            "axisPlacement": "auto",
            "barAlignment": 0,
            "drawStyle": "bars",
            "fillOpacity": 90,
            "gradientMode": "scheme",
            "hideFrom": {
              "legend": false,
              "tooltip": false,
              "viz": false
            },
            "insertNulls": false,
            "lineInterpolation": "linear",
            "lineWidth": 1,
            "pointSize": 5,
            "scaleDistribution": {
              "type": "linear"
            },
            "showPoints": "auto",
            "spanNulls": false,
            "stacking": {
              "group": "A",
              "mode": "percent"
            },
            "thresholdsStyle": {
              "mode": "line"
            }
          },
          "mappings": [],
          "thresholds": {
            "mode": "absolute",
            "steps": [
              {
                "color": "green",
                "value": null
              },
              {
                "color": "red",
                "value": 80
              }
            ]
          }
        },
        "overrides": []
      },
      "gridPos": {
        "h": 8,
        "w": 24,
        "x": 0,
        "y": 7
      },
      "id": 4,
      "options": {
        "legend": {
          "calcs": [],
          "displayMode": "list",
          "placement": "bottom",
          "showLegend": true
        },
        "timezone": [
          "browser"
        ],
        "tooltip": {
          "mode": "single",
          "sort": "none"
        }
      },
      "pluginVersion": "10.1.5",
      "targets": [
        {
          "datasource": {
            "type": "prometheus",
            "uid": "prometheus"
          },
          "expr": "dockerhub_limit_max_requests_total - on() dockerhub_limit_remaining_requests_total",
          "interval": "",
          "legendFormat": "",
          "queryType": "randomWalk",
          "refId": "A"
        }
      ],
      "title": "Used Requests",
      "type": "timeseries"
    },
    {
      "datasource": {
        "type": "prometheus",
        "uid": "prometheus"
      },
      "description": "Remaining Requests",
      "fieldConfig": {
        "defaults": {
          "color": {
            "mode": "palette-classic"
          },
          "custom": {
            "axisCenteredZero": false,
            "axisColorMode": "text",
            "axisLabel": "",
            "axisPlacement": "auto",
            "barAlignment": 0,
            "drawStyle": "line",
            "fillOpacity": 0,
            "gradientMode": "none",
            "hideFrom": {
              "legend": false,
              "tooltip": false,
              "viz": false
            },
            "insertNulls": false,
            "lineInterpolation": "smooth",
            "lineStyle": {
              "fill": "solid"
            },
            "lineWidth": 1,
            "pointSize": 5,
            "scaleDistribution": {
              "type": "linear"
            },
            "showPoints": "auto",
            "spanNulls": false,
            "stacking": {
              "group": "A",
              "mode": "none"
            },
            "thresholdsStyle": {
              "mode": "dashed+area"
            }
          },
          "mappings": [],
          "thresholds": {
            "mode": "absolute",
            "steps": [
              {
                "color": "green",
                "value": null
              },
              {
                "color": "red",
                "value": 80
              }
            ]
          }
        },
        "overrides": []
      },
      "gridPos": {
        "h": 9,
        "w": 24,
        "x": 0,
        "y": 15
      },
      "id": 2,
      "options": {
        "legend": {
          "calcs": [],
          "displayMode": "table",
          "placement": "bottom",
          "showLegend": true
        },
        "timezone": [
          "browser"
        ],
        "tooltip": {
          "mode": "single",
          "sort": "none"
        }
      },
      "pluginVersion": "10.1.5",
      "targets": [
        {
          "datasource": {
            "type": "prometheus",
            "uid": "prometheus"
          },
          "expr": "dockerhub_limit_remaining_requests_total",
          "interval": "",
          "legendFormat": "Remaining requests",
          "queryType": "randomWalk",
          "refId": "A"
        },
        {
          "datasource": {
            "type": "prometheus",
            "uid": "prometheus"
          },
          "expr": "dockerhub_limit_max_requests_total",
          "instant": false,
          "interval": "",
          "legendFormat": "Max requests",
          "refId": "B"
        }
      ],
      "title": "Remaining Requests",
      "type": "timeseries"
    }
  ],
  "refresh": "10s",
  "schemaVersion": 38,
  "style": "dark",
  "tags": [],
  "templating": {
    "list": []
  },
  "time": {
    "from": "now-24h",
    "to": "now"
  },
  "timepicker": {},
  "timezone": "",
  "title": "Docker Hub Rate Limits",
  "uid": "uZ_PBx2Mk",
  "version": 6,
  "weekStart": ""
}
이제는 이 상황이 발생되지 않도록 우회책을 찾아봐야겠군요.!!

귀찮아하지말고 계속 정리하고 공부하자