Why statsmodels?
: 기존에 R에서 가능했던 다양한 회귀분석과 시계열분석 방법론을 그대로 파이썬에서 이용할 수 있다.
시각화
from statsmodels.graphics.mosaicplot import mosaicmpsaic plot
mosaic(data명, ['열이름1', '열이름2']): 범주별 양과 비율을 그래프로 나타냄- list로 변수 이름을 담음. x y 순서 지키기
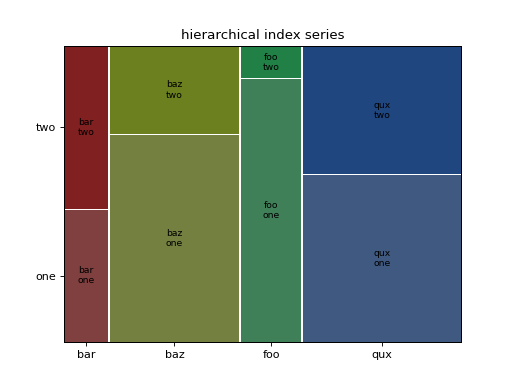
- list로 변수 이름을 담음. x y 순서 지키기
수치화(통계 분석)
로지스틱 회귀 분석
model = sm.Logit(titanic['Survived'], titanic['Age'])
result = model.fit()
print(result.pvalues)

# 출력
Optimization terminated successfully.
         Current function value: 0.661967
         Iterations 4
Age    3.932980e-13
dtype: float64
내 인생의 주연