
프로메테우스
서버
-
모니터링, 각 서버들이 현재 사용되고 있는 환경을 확인하고, 또한 각 웹서버들이 페이지 등을 넘어갈 때 각종 환경들을 확인하고자 한다. (2가지를 모두 모니터링 할 수 있다.)
-
IP 대신 이름으로 설정을 해놔야 모니터링 시 어느 서버인지 쉽게 확일 할 수 있다.
vi /etc/hostname200.200.200.51 server (모니터링)
200.200.200.30 django-1 (웹서버1)
200.200.200.40 django-2 (웹서버2)
200.200.200.55 database (데이터베이스)
200.200.200.50 haproxy (웹 분산처리) - 앞서 설정했던 IP 서버들이다. 이제 이친구들을 우린 모니터링할것이다.
cat > /etc/yum.repos.d/prometheus.repo <<'EOF'
[prometheus]
name=prometheus
baseurl=https://packagecloud.io/prometheus-rpm/release/el/$releasever/$basearch
repo_gpgcheck=1
enabled=1
gpgkey=https://packagecloud.io/prometheus-rpm/release/gpgkey
       https://raw.githubusercontent.com/lest/prometheus-rpm/master/RPM-GPG-KEY-prometheus-rpm
gpgcheck=1
metadata_expire=300
EOF- 필요한 레포지터리를 추가해준다.
dnf -y install prometheus2- 프로메테우스를 설치해준다.
vi /etc/prometheus/prometheus.yml
- job_name: node
	  static_configs:
	      - targets: ['haproxy:9100', 'django-1:9100', 'django-2:9100','database:9100']

- job_name: django
      metrics_path: /monitor/metrics
      static_configs:
          - targets: ['django-1:80', 'django-2:80']
        labels:
app: 'myblog'- 두 가지 영역을 설정해 준다.
- node의 이름을 가진 친구들은 컴퓨터의 상태를
- django의 이름을 가진 친구들은 django가 움직일때의 상태를 알려주도록 하는 것이다.
systemctl restart prometheus노드
- 프로메테우스가 받을 수 있도록 정보를 보내야하는데 보내야 하는 서버들도 작업을 해줘야한다.
cat > /etc/yum.repos.d/prometheus.repo <<'EOF'
[prometheus]
name=prometheus
baseurl=https://packagecloud.io/prometheus-rpm/release/el/$releasever/$basearch
repo_gpgcheck=1
enabled=1
gpgkey=https://packagecloud.io/prometheus-rpm/release/gpgkey
       https://raw.githubusercontent.com/lest/prometheus-rpm/master/RPM-GPG-KEY-prometheus-rpm
gpgcheck=1
metadata_expire=300
EOF- 필요한 레포지터리를 추가해준다.
dnf -y install node_exporter- 노드 익스포터를 설치해준다.
source [프로젝트폴더]/venv/bin/activate
pip install django-prometheus
- 장고 -프로메테우스를 설치해준다.
settings.py 작업
vi [프로젝트폴도]/config/settings.pyINSTALLED_APPS = [
...
'django_prometheus',
]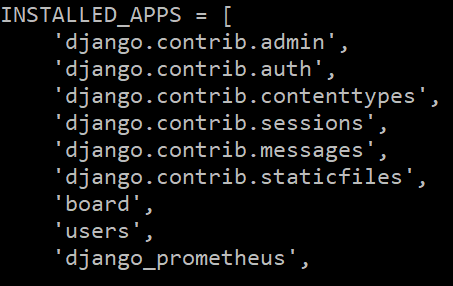
- INSTALLED_APPS
추가 'django_prometheus'
MIDDLEWAR = [
 'django_prometheus.middleware.PrometheusBeforeMiddleware',
...
 'django_prometheus.middleware.PrometheusAfterMiddleware',
]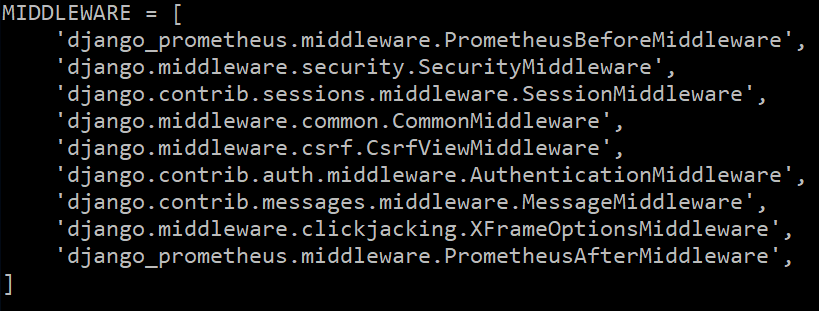
- MIDDLEWAR
맨 앞에 'django_prometheus.middleware.PrometheusBeforeMiddleware',
맨 뒤에 'django_prometheus.middleware.PrometheusAfterMiddleware',
DATABASE = {
 'default': {
        'ENGINE': 'django_prometheus.db.backends.mysql',
        ...}
        }
      }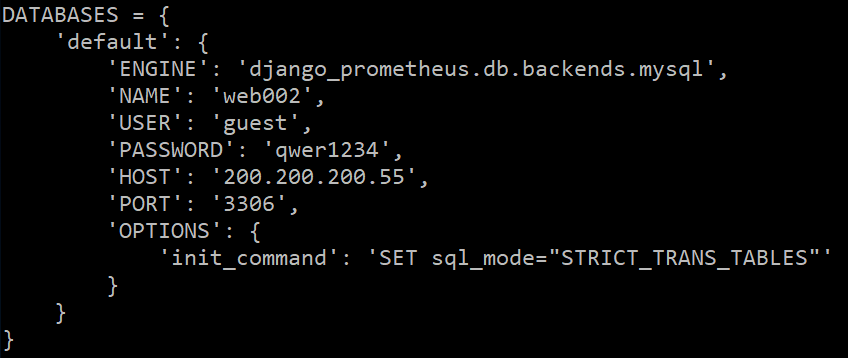
- DATABASE
변경 ENGINE -> 'django_prometheus.db.backends.mysql',
urls.py 작업
vi /[프로젝트폴더]/config/urls.pyinclude
path('monitor/', include('django_prometheus.urls')),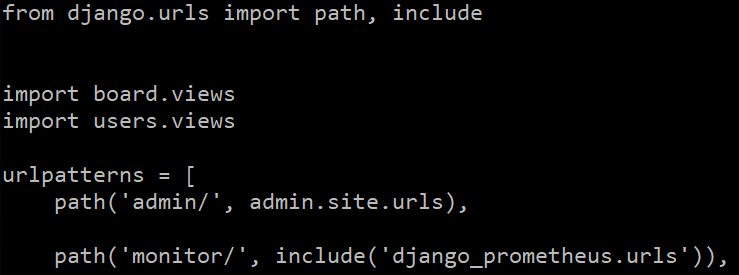
프로메테우스 서버 실행
[서버IP:9090]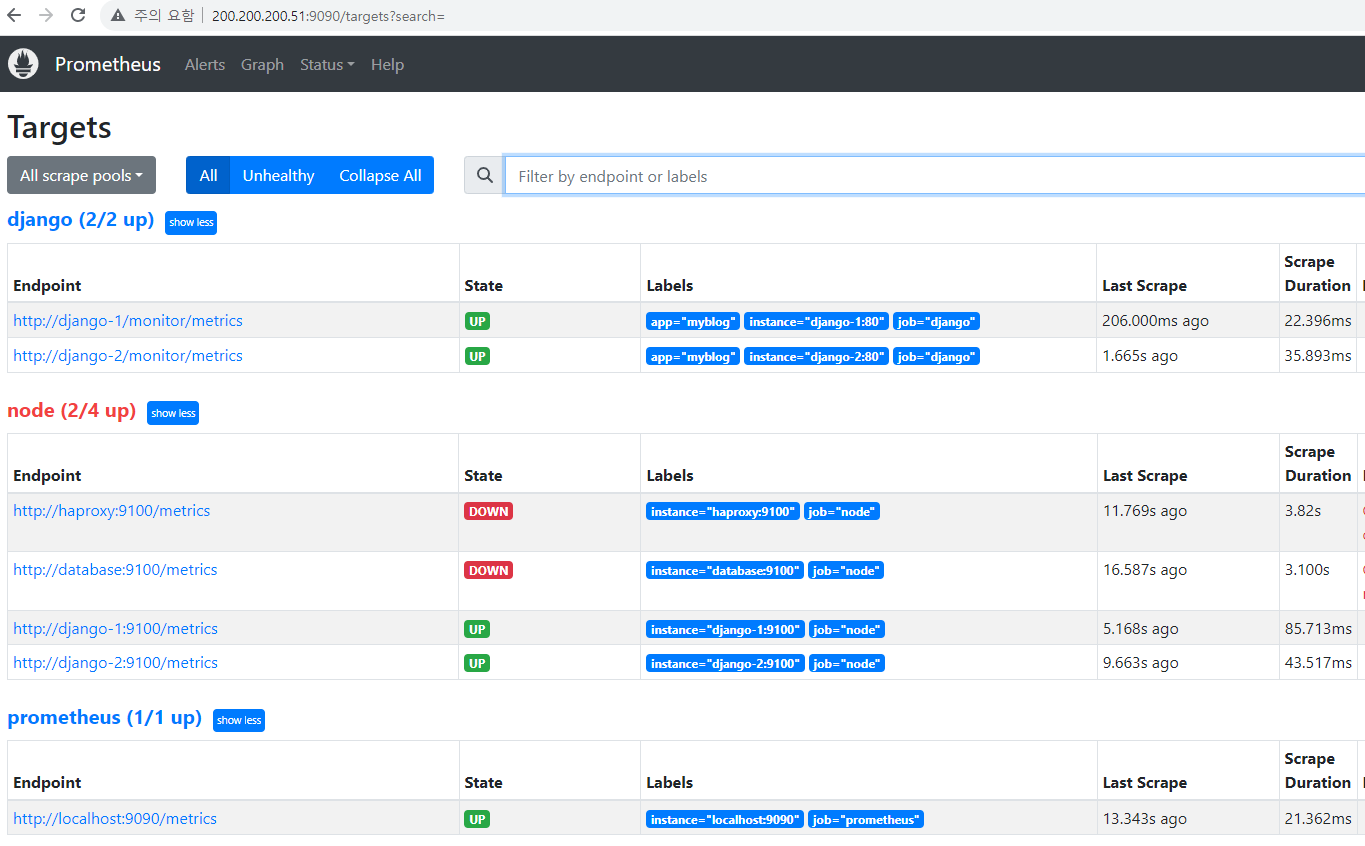
- 현재 haproxy와 database 서버는 가상머신을 종료한 상태이기 때문에 조회가 되지 않지만 위 와같이 :9090포트로 넘어가서 status -> Targets를 보면 연결된 상태를 확인 할 수 있다.
- 앞서 말했듯이 django의 경우는 장고가 움직일 때의 상태를 보여주는 것이고
node의 경우는 서버 컴퓨터의 작동 상태를 확인하겠다 이다.
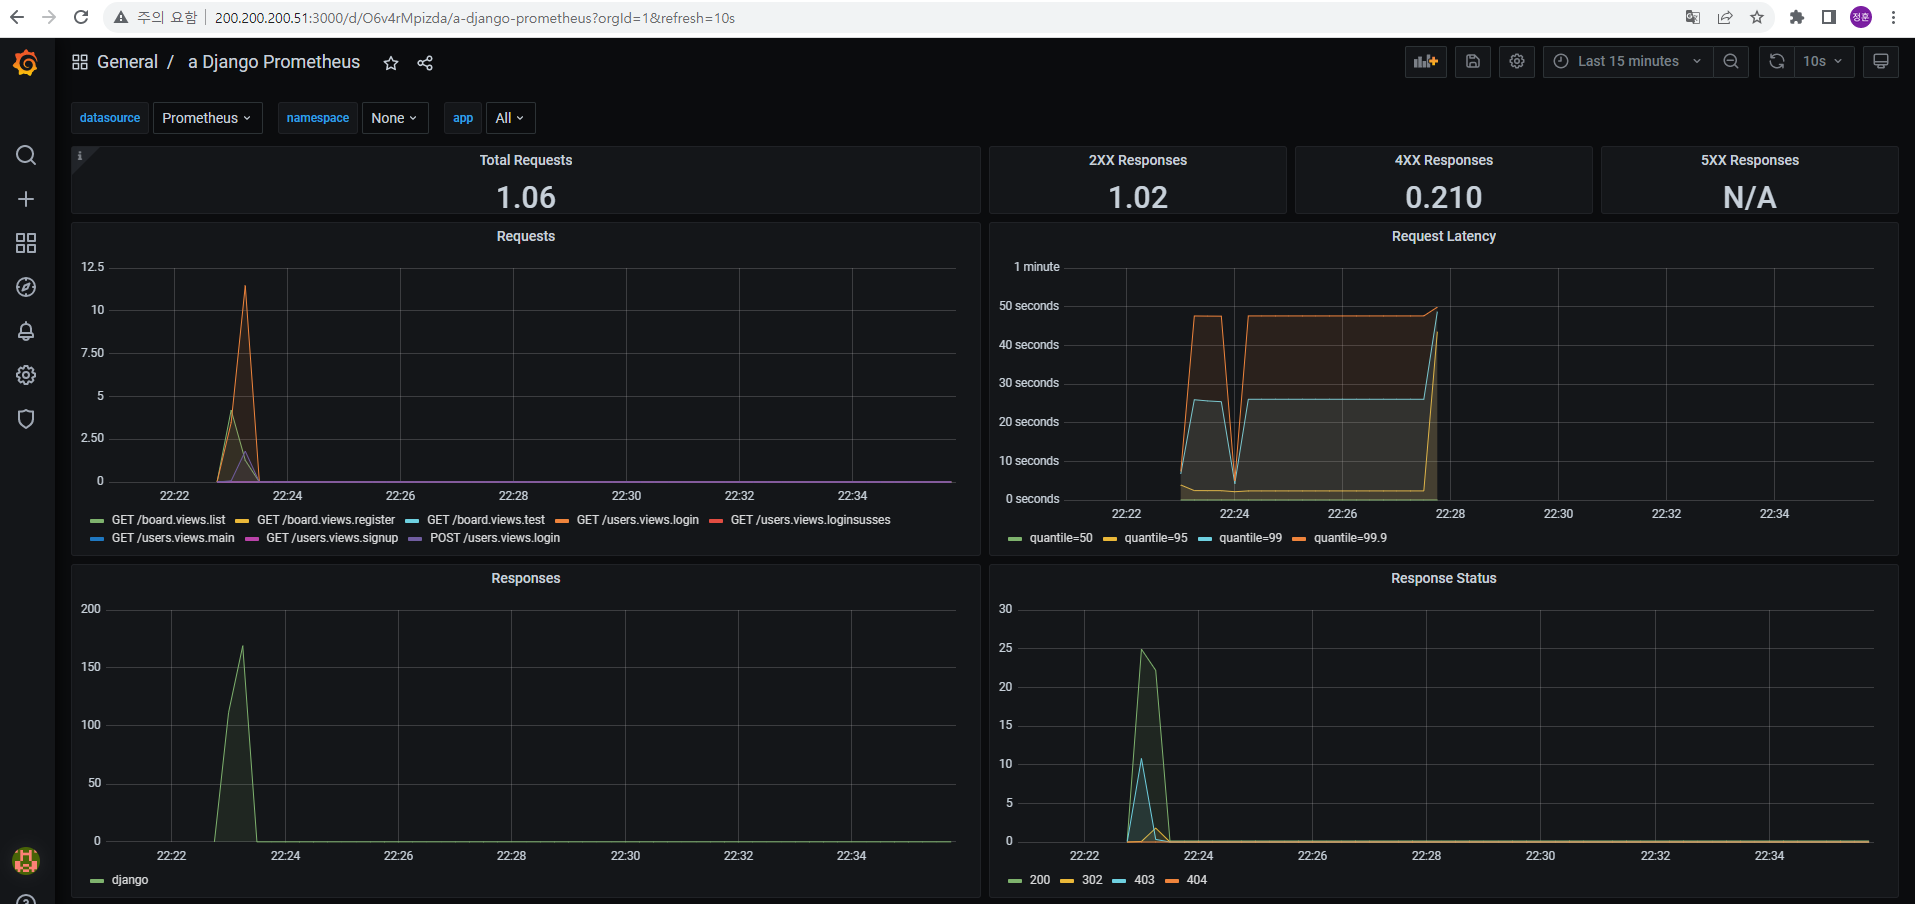
그라파나
- 프로메테우스에 전달된 내용을 화면으로 확인하기 위해 그라파나를 이용하고자 한다.
서버에서 설정
dnf -y install grafanavi /etc/grafana/grafana.ini
# 35번 라인
http_addr = 0.0.0.0- 그라파나를 설치해주고 설정부분을 위와같이 살짝 수정해준다.
systemctl restart grafana-server- 시스템을 재시작해 준다.
[서버IP:3000]-
그라파나가 설치된 서버 IP:3000 포트로 접속하면 초기에 ID와 PW를 설정해줘야한다.
-
초기 비밀번호는 둘다 admin이다.
-
https://www.server-world.info/en/note?os=CentOS_Stream_8&p=prometheus&f=5
-
이후 작업은 위 홈페이지에서 설정방법을 참고하였다.
-
설정화면의 구성은 직접만들어도 되지만 그라파나에서 제공하는 대쉬보드가 있기에 나는 import해서 구현하였다.
-
node의 경우는 12486 / djanog의 경우는 9528 을 import하였다.


싱숭생숭늉
Setting up Prometheus and Grafana was a real struggle for me at first. I kept running into issues with configuration files and making sure everything was talking to each other properly. This article really helped me understand the setup process better—huge thanks for the detailed breakdown!
While working on my server, I also needed to install Miniconda for managing Python environments. At first, I wasn’t sure how to do it correctly on Ubuntu 24.04, but I found this super helpful guide on how to install miniconda ubuntu. It made the whole process so much easier!